Evening BTC Market Analysis and Trading RecommendationsToday, U.S. markets are closed, leading to light trading activity and relatively limited overall market volatility. From a technical analysis perspective, the 4-hour K-line chart currently shows prices trading below the middle band of the Bollinger Bands, exhibiting a classic range-bound consolidation pattern. Bulls and bears are locked in a tug-of-war between key support and resistance levels, with K-line formations alternating between bullish and bearish patterns.
In terms of chart structure, the lower support zone has demonstrated strong buying conviction, while the upper resistance level has exerted clear restrictive force. Multiple failed upward breakouts have formed a short-term top. This box consolidation—characterized by resistance above and support below—is expected to sustain sideways trading through Friday.
Against the backdrop of no major positive catalysts, bearish momentum may gradually dominate if no substantial bullish triggers emerge. Maintain a trading strategy of selling into strength.
BTCUSDT
105000-105500
tp:104000-103000
Investment itself is not the source of risk; it is only when investment behavior escapes rational control that risks lie in wait. In the trading process, always bear in mind that restraining impulsiveness is the primary criterion for success. I share trading signals daily, and all signals have been accurate without error for a full month. Regardless of your past profits or losses, with my assistance, you have the hope to achieve a breakthrough in your investment.
BTCUSDT.5L trade ideas

CHECKL BTCUSDT SIGNAL READ CAPTAINEntry: around(102893.55)102653.66 ✅
Take Profit 101732.58✅
Take Profit 2: 101231.00✅
Last Target:100412.00 ✅
Stop Loss: 103304.27❌

BTCUSDT - 4H Supply-Demand + Order Flow ViewBINANCE:BTCUSDT is struggling to hold above the 103K zone, which has now flipped into resistance. Price recently tapped into the 104K–105K supply zone and faced rejection, confirming bearish pressure. The most recent short entry aligns with overhead liquidity absorption and weakness near the high-volume node (~105K) on the volume profile.
We're now revisiting the previous demand zone (101K–102K), which has held multiple times but is weakening. A breakdown below this level opens up the next major demand zone around 98.5K–99K and possibly 94K if momentum accelerates.
🔻 Bias: Bearish unless 104K is reclaimed.
🔍 Watching: Reaction at current support and volume cluster near 100K.
📊 Tools Used: S/D Zones, VWAP, Volume Profile, Confirmation Indicators.
📌 Trade safe. Set alerts and don’t chase.

BTC Testing Crucial Support – Breakdown or Bounce ?Bitcoin is currently testing a critical support zone around $103,573 – a break below could trigger a sharper move toward $101,400.
Price rejected from ~$105.8K
Support holding... for now
RSI dropping fast – now near 34 (1H TF)
Weakening momentum visible
This level is the last line of defense for bulls. If it cracks, expect volatility.
Watch closely. Break = panic or buying opportunity?
DYOR. Not Financial Advice.

btc short setupSL 10500
tp 102500
with ongoing world events and liquidations available at that range, its very much possible that bitcoin will and must tap 102 or lower for a creating fear and wiping retailers out. But short with caution might give fake outs to trap longs.
thanks
BTC- Bounce here or 93K incomingWhatever WTI does.. will determine what the Stock Market does.... which will determine what BTC does.. which will determine what all of Crypto does..

RangesReturning to range low form here is normal price action. Breakout to one side, breakout to the other, before the real breakout happens — most likely in the direction of the bigger trend, which is up.

Bullish Divergence on Daily TimeframeBullish posible ! Strong confirmation for BTCUSDT.
Good luck and DYOR

$BTCUSDT Eyes $120K After Key Support BounceBTCUSDT is holding strong above the ascending trendline and key support near $104K.
A fresh bounce suggests bullish momentum, with potential to break the $110K resistance.
If that happens, the next target could be around $120K. Trend remains bullish above support.
DYRO, NFA

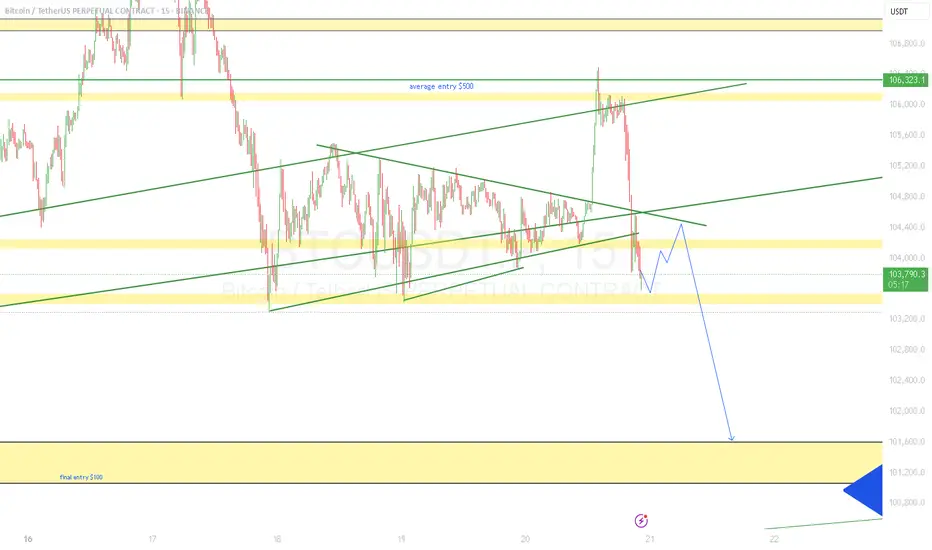
BTC/USDT Technical Analysis, 2025-06-18 09:45 UTC📘 BTC/USDT Scalping Setup – Whale-Assisted Dip Buy
This strategy is designed for high-precision, short-term long trades on BTC/USDT using the 15-minute chart. It targets oversold conditions with signs of reversal, confirmed by whale activity, volume spikes, and key support levels.
The edge comes from combining retail technicals (RSI, Stoch, MACD, candlestick patterns) with institutional confirmation (order flow, OBV, and large bids from whales).
✅ Key Strategy Components:
Oversold Technicals: RSI and Stochastic suggest price exhaustion.
Support Zone Alignment: Price is dipping near major support (pivot S1 or local low).
Reversal Candlestick: Clean bullish signals like Hammer or Engulfing show shift in sentiment.
Smart Money Confirmation:
Whale buyers (>5 BTC bids)
Bid dominance (>3%)
OBV rising = silent accumulation
Timing is Critical: Trades are only taken in the first 2 minutes of the 5-min candle with a volume burst.
🎯 Trade Management
Entry: On close of confirming candle (when all criteria align)
Take Profit: +1.2% (or ~1200 pts)
Stop Loss: -0.6% (or ~600 pts)
Risk/Reward: 1:2
📈 Why This Works
This is not just a basic RSI/Stochastic play — it’s a multi-confirmation strategy tuned for whale detection, volume acceleration, and institutional footprints. It’s ideal for high-volatility sessions and works best in range or retracement phases of a broader uptrend.
⚠️ Pro Tips
Avoid entries during extreme news volatility
Be disciplined – all filters must align (this is a precision setup)

#BTC Descending Triangle📊#BTC Descending Triangle✔️
🧠From the perspective of the chart, we have been sideways here for about three days, and the price is gradually being squeezed to form a descending triangle. Generally, we regard this model as a model that continues the original trend force (the trend at the hour level is a downward trend).
➡️A similar model analysis was also made in the previous article. Because the closing price at the 4h level is already below the lower edge of the triangle, I think the probability of further decline will be higher, so please be cautious in chasing the rise!
⚠️Note that if we break through the H point and stabilize, it means that my view is wrong.
🤜If you like my analysis, please like 💖 and share 💬 BITGET:BTCUSDT.P

BTC is squeezing between descending resistance.📊 BTC/USDT – 1H Chart Analysis: The Calm Before the Storm?
Bitcoin is currently coiling within a symmetrical triangle on the 1-hour chart – a technical pattern that often signals a strong breakout is just around the corner. The market is compressing, and momentum is building.
🔍 Key Levels to Watch:
🔹 Symmetrical Triangle:
BTC is squeezing between descending resistance and ascending support. This equilibrium usually doesn’t last long – expect a sharp move soon.
🔹 Demand Zone ($$$ / BPR):
A solid floor is forming near the BPR (Bullish Price Range), signaling potential buyer interest and liquidity resting just below.
🔹 Fair Value Gap (FVG):
To the upside, BTC is facing a liquidity pocket (FVG) that could act as a magnet if bulls take control.
⚡ Potential Scenarios:
📈 Bullish Breakout: A break and close above the triangle could trigger a rally towards the $105K–$106K zone. Watch for volume to confirm!
📉 Bearish Breakdown: Losing the lower trendline support might send BTC into a deeper correction toward previous demand zones.
🧠 Final Thoughts:
We're approaching a critical inflection point. The triangle is narrowing, and Wednesday, June 25 could be the date the market decides. Both bulls and bears should prepare for volatility.
🚨 As always: This is not financial advice.
🧠 DYOR – Do Your Own Research.
Manage risk. Trade smart. Stay sharp. 💹

Today's BTC trading strategy, I hope it will be helpful to youBitcoin prices have fluctuated frequently in recent days, presenting a complex landscape. Looking at price data from the past week, Bitcoin has seen significant volatility. On June 13, triggered by Israel's airstrikes on Iran that escalated tensions in the Middle East, Bitcoin hit a low of $102,614 per coin—edging close to the $100,000 threshold. As of June 20, Bitcoin hovered around $104,500. While this represents a rebound from the recent low, prices remain relatively unstable, reflecting intense battles between bulls and bears with no clear trend established.
Reviewing this year's price trajectory, Bitcoin fell below $40,000 per coin at the start of 2025 before launching a robust rally. In less than a year, prices more than doubled, briefly hitting $99,000 per coin to set a new all-time high. Recent volatility can be seen as a correction after the prior surge—a common occurrence in crypto markets, typically a process where the market digests earlier gains and seeks a new price equilibrium.
Global macroeconomic conditions and shifts in crypto regulatory policies significantly impact Bitcoin prices. Continuously monitor the Federal Reserve's monetary policy stance: if the Fed signals rate cuts or implements easing, increased market liquidity may fuel Bitcoin's rally, warranting appropriate long position additions. Conversely, if the Fed hikes rates or maintains a hawkish stance, exercise caution and consider reducing positions. Meanwhile, track global crypto regulatory dynamics: positive policies from more countries can strengthen long positions, while signals of regulatory tightening require prompt strategy adjustments and position reductions to mitigate risks. Additionally, stay attuned to market sentiment and investor psychology to avoid herd behavior.
In Bitcoin's complex and volatile environment, long strategies must be flexibly adjusted. Investors should align with their risk tolerance and investment objectives, strictly implement strategies, and strive to maximize returns while minimizing risks.
Today's BTC trading strategy, I hope it will be helpful to you
BTCUSDT BUY@103000~104000
SL:102000
TP:105000~106000

BTC will get doomed to 96k?NO not now, but you can see it ditto follows the movement as said earlier and shown. with little liquidity left on the top of it!

Upon reaching PDL price
Previous Day rejected the previous day's low.
When price reaches PDL if price shows a bullish CHOCH to the upside
there could be a bullish orderflow change @ near previous day low's
Could be a good long entry towards previous day high

BTC to 102.5k game plan. here you can see that bitcoin is trading within a zone that will likely lead to a breakout to the downside, unless geopolitical tensions somehow get freed up. I believe that we will see 102.5k by the end of the month, if not sooner.


ABC or 12345Just a little deeper to finish the wave count and we're all set. If it stays an ABC, it could mean an expanded flat correction, which wouldn't be good since it would mean we'd go deeper later.

Future market trend predictionIn the short term, the price trend of Bitcoin is full of uncertainties. On the one hand, if the global macroeconomic environment continues to deteriorate, with slower economic growth and increased inflationary pressures, it may prompt more investors to seek safe-haven assets. As an asset with certain safe-haven properties, Bitcoin may attract some capital inflows, providing support for its price. However, if regulatory policies are further tightened in the short term, especially if more stringent restrictive measures are introduced in countries and regions where Bitcoin trading is active, then the price of Bitcoin may face significant downward pressure.
you are currently struggling with losses,or are unsure which of the numerous trading strategies to follow,You have the option to join our VIP program. I will assist you and provide you with accurate trading signals, enabling you to navigate the financial markets with greater confidence and potentially achieve optimal trading results.

BTC RESPECTING THIS BOXESLast time we had great btc trade
This time play this boxes with good risk management

Possible outcome for $BTCBitcoin Price Analysis: Signs Pointing to a Potential Downtrend
The chart above illustrates a detailed analysis of BTCUSDT (Bitcoin paired with USDT) using Elliott Wave theory and key support/resistance levels. After what appears to be a completed 5-wave bullish cycle, the technical outlook suggests that Bitcoin may be poised for a significant downside correction.
Completion of the Elliott Wave Structure
The chart marks the completion of five distinct waves:
Wave (1) initiated the bullish trend.
Wave (2) represented the first significant pullback.
Wave (3) delivered a strong upward surge, surpassing previous highs.
Wave (4) brought another retracement, finding support near a previous resistance zone.
Wave (5) capped off the structure, reaching above the $100,000 mark before exhibiting signs of exhaustion.
According to Elliott Wave theory, a 5-wave impulse is typically followed by a corrective ABC pattern. The chart suggests that this correction is now underway.
But I think it is trying to create a double top pattern.
Key Levels to Watch
Highlighted on the chart are several crucial horizontal zones:
Near-term resistance: Around $109,600 – $112,000. Bitcoin struggled to maintain momentum above this area and has since started declining.
First major support zone: Around $75,000 – $80,000. This was a former resistance zone during Wave (3) and may now act as support during the early stages of the correction.
Critical support levels: Marked at $54,019, $50,000, and $46,877.5. A break below these levels would indicate a deeper corrective move, potentially aligning with the projected path shown on the chart.
Trendline Break and Bearish Outlook
The yellow upward trendline that supported the entire rally is at risk of being decisively broken. The chart projection shows Bitcoin slicing through this trendline, signaling a shift from a bullish to bearish market structure. If this occurs, it could lead to accelerated selling pressure as confidence in the uptrend erodes.
Projected Price Path
The white arrows in the image depict a scenario where Bitcoin could fall to around $54,000 and possibly as low as the $46,000 region if key supports give way. This represents a significant correction, but one that aligns with historical post-impulse patterns seen in previous Bitcoin cycles.
Conclusion
While Bitcoin has enjoyed an impressive rally culminating above the $100,000 level, technical indicators on this chart point to the increasing likelihood of a sustained downward correction. Traders and investors should monitor the key support levels closely and be prepared for heightened volatility as the market seeks a new equilibrium following this extended bull run.


June 12, 2025 Historical Comparison Analysis [Wave Analysis]No one knows tomorrow but what if???
Here, we have a historical comparison between December 07, 2020 to June 13, 2022, and January 22, 2024 to present day.
December 07, 2020 to November 08, 2021:
• Uptrend
• Flag (retracement)
• Uptrend continuation
• Range
• Downtrend
• Range (W or Double bottom pattern)
• Uptrend
• Flag (retracement)
• Uptrend continuation
November 08, 2021 to June 13, 2022:
• Downtrend
• Flag (retracement)
• Downtrend continuation
January 22, 2024 to May 19, 2025:
• Uptrend
• Flag (retracement)
• Uptrend continuation
• Range
• Downtrend
• Range (W or Double bottom pattern)
• Uptrend
May 19, 2025 to present day:
• .......
JUST WHAT IF HISTORY REPEATS ITSELF
