Red Alert For Intrday Selling #bitcoinHello trader's
This is your Red Alert level only for today intrday selling...
BTCUSDT.5L trade ideas

BTC/USDT Smart Money Roadmap | Daily FVG + ATH TargetSeenForex | ICT-Based Smart Money Analysis
Bitcoin is currently reacting within a Daily Weak Fair Value Gap (WFVG) after a series of liquidity sweeps ($$$). Price structure suggests two possible scenarios:
✅ Bullish Continuation Setup:
Daily WFVG acting as potential mitigation zone
Targeting ATH liquidity above $112,000
Confirmation required: bullish BOS or entry model near FVG
🔄 Bearish Liquidity Sweep Scenario:
Deeper liquidity draw possible below WFVG
Next potential demand zone around $85,000–$87,000
Clean inefficiency (FVG) below waiting to be filled
🧠 Wait for price reaction inside WFVG or deeper zone before taking action.
📊 Strategy Used:
ICT | Smart Money | Liquidity Sweep | Order Block | BOS | FVG
📅 Date: June 19, 2025
🔍 Analyst: SeenForex
#BTC #Bitcoin #BTCUSDT #SmartMoney #ICT #FVG #Liquidity #TechnicalAnalysis #CryptoTrading #SeenForex #OrderBlock #TradingViewIdeas

A Disciplined Approach to BTC/USDT - Wait for the Right Set Up!Right now, I’m closely monitoring BTC/USDT — and what immediately jumps out is how aggressively this rally has pushed upward 🚀. We’ve seen price climb into a key external range high, taking out liquidity that was likely sitting just above those prior highs 💧.
This kind of move is often where institutional players step in to offload positions, as the liquidity makes it easier to find counterparts for previous accumulation phases 🏦. The way this price action is unfolding, I wouldn't be surprised to see a correction or retracement soon.
With the market this stretched, I’m not looking to get long here — especially not while BTC is trading at such a clear premium 🎯. No edge in chasing the highs.
Instead, I’ll be sitting back, waiting for a healthy pullback and a confirmed bullish structure shift before considering any entries 🔄📊. There’s no need to force trades in these conditions. Patience protects capital 🛡️.
⚠️ As always, this is not financial advice — just my current market perspective.

Bitcoin - overview with Initiative AnalysisHey traders and investors!
📍 Context
On the daily timeframe, the market is in a sideways range.
The boundaries are marked with black lines.
Buyer initiative is currently active.
Targets: 108,952; 110,530; 111,980.
📊 Key Actions
The seller attempted twice, on increased volume, to break down below the range, but both times the buyer brought the price back inside. Only seller wicks remained below the lower boundary.
🎯 Trade Idea
🔹 Look for long setups from 105 500 -104,622 or the 103,400–100,718 zone.
There is no context for short trades at the moment.
This analysis is based on the Initiative Analysis concept (IA).
Wishing you profitable trades!

Can #BTC continue to rise?📊Can #BTC continue to rise?
🧠From a structural perspective, we started to rebound after being very close to the ideal target area of the bearish cup-handle structure, and broke through the downward trend line, which means that the correction phase is over.
➡️So next we need to pay attention to the long trading opportunities after the pullback. At present, this position belongs to the contradictory range. It can continue to rise, but it will be very uncomfortable if we chase the rise. So wait patiently for trading opportunities after the pullback. We can pay attention to the neckline support area (102000-103000).
➡️If there is no pullback, but it continues to rise, then the resistance near 106500 is also worth our attention. This is the support-resistance conversion area that has been tested many times.
🤜If you like my analysis, please like 💖 and share 💬
BITGET:BTCUSDT.P

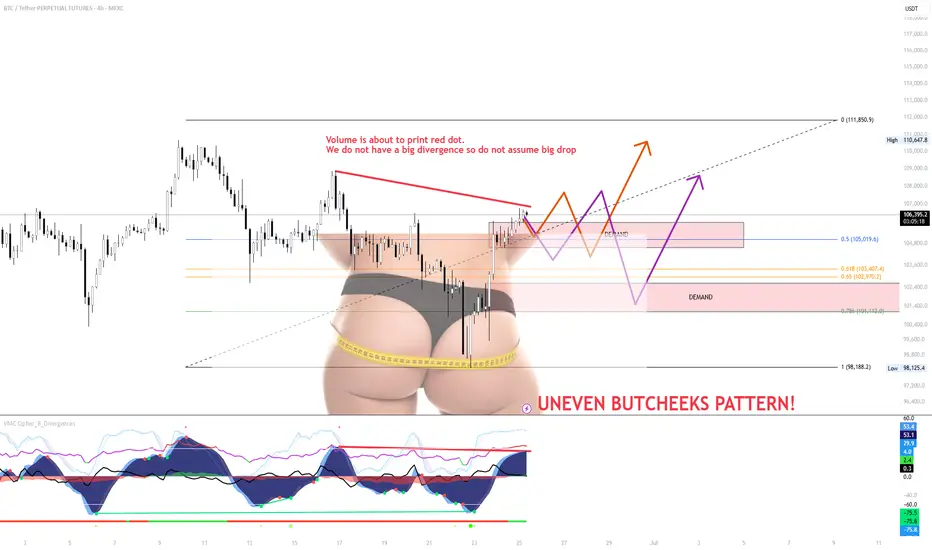
SMALL RETEST on BTC and continuation of BTC TrendThe small range forming just under local resistance is weak and showing signs of exhaustion. Despite a possible red dot printing soon, volume is not confirming a strong bearish divergence, so don’t assume a major drop is guaranteed just yet.
The “Uneven Butcheeks” pattern visually highlights imbalance
A fakeout back into the range, or
A flush to grab liquidity sitting beneath key demand zones.
Key Scenarios
Scenario A (Orange Path)
A breakout through the overhead supply zone could trigger upside continuation toward $111,850.
But unless it’s backed by strong volume and broader BTC strength, I’ll be fading this move.
Right now, this doesn’t look like conviction from bulls — it looks like exhaustion.
Scenario B (Purple Path)
A rejection at current levels or a weak fakeout could break back into the demand zone.
With thin structure below and low buy-side aggression, price could sweep down toward $102.9k–$101.1k, or even lower.
If we get this move, I’ll be watching how buyers behave around the lower demand — that’s where bulls need to prove themselves.
⚠️ Strategy:
Don’t front-run this — let the price confirm or invalidate.
Watch volume. Watch BTC dominance.
Until then, this zone is chop-heavy, and patience = protection.
Wednesday, Trade of the day 📊 Wednesday Trading Update
Tuesday didn’t give us any tangible plays — price action was choppy, unconvincing, and mostly noise. But that’s behind us. Let’s see what Wednesday brings, especially with London and NY sessions ahead.
Midweek is notoriously volatile for BYC, and historically, Wednesday has often been the day that breaks the range or gives us a proper deviation setup — so eyes sharp today 👀.
My trades today will stick to standard range plays, nothing forced. We're still sitting above 4H supply, and unless we get a clean breakout with structure shift, I’ll remain cautious and reactive, not predictive.
Here’s what I’m watching today:
👉 Look for clear market structure shifts on the LTF (lower timeframes)
👉 Divergences can give early signs if you're using oscillators
If I get time, I might record a quick session later. No promises, but I’ll update if that changes.
🎥 If you're unsure what to look for, go back through the video archive — everything you need has already been broken down in detail.
📅 Weekly Schedule:
Wednesday – ❌ No class
Thursday – ❌ No class
Friday – ❌ No class
Let’s stay sharp — volatile Wednesdays tend to reward patience and precision.

BTC rejected from the Resistance trend line BTCUSDT is currently testing a descending trendline near $105,364, with a potential bearish rejection expected. The chart suggests a short setup targeting the $102,200 area, while a break above $106,943 would invalidate the trade.

BTC midterm plan possibility
The current Bitcoin chart shows a P.O.3 pattern formation. Looking at the price targets, we can see a clear path to $100,000, which stands as a major psychological price level. The ongoing A-B-C pattern structure supports this price movement. If Bitcoin successfully breaks through the $100k level, we could potentially see an extension to around $120,000. After January, there's a strong possibility of a bullish trend that could help reach these targets, though this remains speculative and uncertain. Market movements depend on various factors, so always do your own research before making any investment decisions.This is one of the scenarios.Other way is going beyond 85k strongly and make pull back or continuation pattern (sideways)after that reach 100k.

Bitcoin Reclaims Momentum: War Fears Fading, Bulls Eye $125K! MARKETSCOM:BITCOIN just delivered a powerful bounce right off the critical $100K level. A key psychological and technical support zone tested multiple times in recent sessions. This time, the bounce came with strong volume confirmation, signaling renewed buyer interest. As geopolitical tensions in the Middle East begin to ease, market confidence is returning, fueling bullish sentiment across the board.
CRYPTOCAP:BTC now looks poised to retest the $110K resistance zone, where some short-term rejection could occur. However, a decisive breakout above $110K opens the gates for a potential rally toward the next major target at $125K. Stay sharp, always manage your risk, and don’t forget to set a proper stop loss. The trend is strong, and momentum is building!
Follow Our Tradingview Account for More Technical Analysis Updates, | Like, Share and Comment Your thoughts
Once again a perfect time to enter a short
As we are closing in to key resistance area we can see that we are getting a lot of smaller bodied 4H candlesticks. This is indicating a weak buy side and that we are looking to top out!
We also got overbought on the hourly RSI and the MACD has flipped bearish
Combining a crocodile tooth shaped formation taking form on the 15min, a rejection from the downward sloping trend line (third rejection indicates strong trend line) and that we are looking to reverse at key resistance. I entered a 100x short at 106375.
As I am writing we also got in another confirmation on the hourly timeframe. As we can see we got a nice bearish engulfing candlestick.
I think the chart speak for itself. We are about to go down big time!

BTCUSDT – Rebound from trendline, targeting 115,300On the daily chart, BTCUSDT has bounced from a confluence support zone around 105,200, where the rising trendline meets the FVG, confirming that the bullish structure remains intact. The current price pattern suggests a continuation of the uptrend, with a short-term target at the 115,300 resistance zone — a level that has previously rejected price multiple times.
If this level is broken, momentum could extend toward the 120,000 area in the medium term. As long as the price holds above the trendline, the bullish outlook remains valid.
On the news front, market sentiment is improving as Bitcoin spot ETFs in the U.S. show signs of renewed inflows, coupled with growing expectations that the Fed might pause rate hikes due to recent signs of economic weakness.

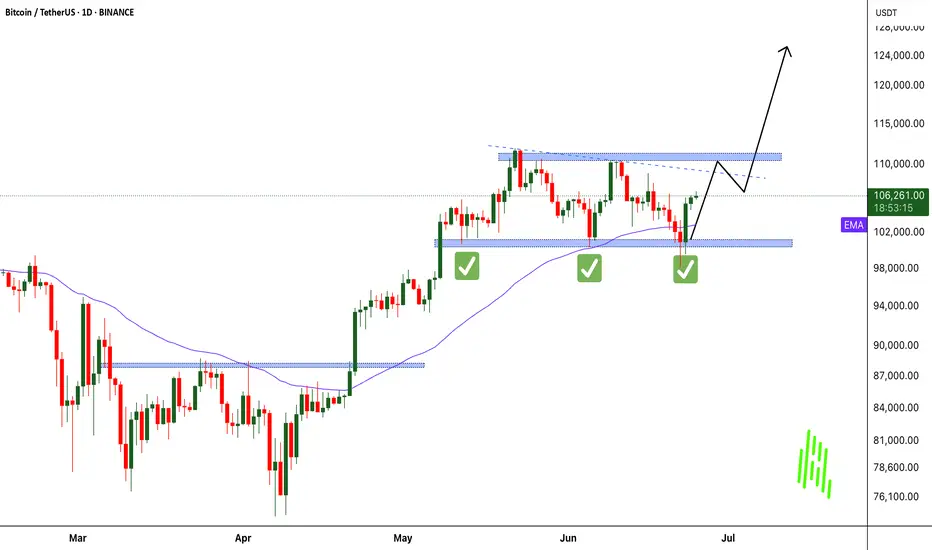
Bitcoin Will Continue Rising —Long-Term Chart —$200,000+ New ATHIn November 2021, the week after the all-time high was a crash. The weeks that followed were a continuation and the market went full red and didn't stop dropping until November 2022, a year later.
In May 2025, the week after the all-time high is neutral, sideways. Four weeks later and Bitcoin continues sideways consolidating near resistance, ready to break to new highs and continue rising.
Market conditions now are very, very different compared to 2021. Right now, we are only halfway through the current bull market, for Bitcoin, and we have room left available for plenty of growth.
In a matter of days, maybe 5-6 days, we get a new all-time high and this means not the end of the bull market but the start of the next and final bullish wave.
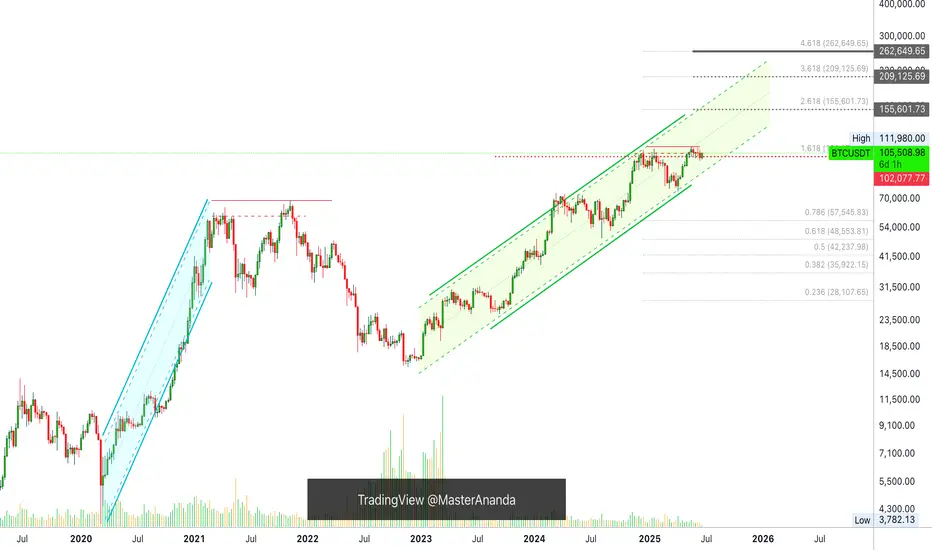
These targets on the chart are the most accurate of all numbers because they are based on almost 5 years of data.
Next target and minimum price for Bitcoin in the coming months is $155,601 but we know there is likely to be more, much more. With the institutional wave now in full force, banks opening to crypto because they have no other choice and the world evolving faster than anything we thought possible, we are aiming for $200,000 or more.
The next relevant level after $155,600 is $209,125. Which one is your target for this new 2025 all-time high?
Do you think Bitcoin will peak in late 2025 or early 2026?
Do you think you will manage to be successful in this round or are you bound to make the same mistakes? Over-trading, over-leverage, no being patient enough; not waiting for the right time to enter and not selling when the market is trading very high, greed; What will it be?
Do you think you have what it takes to succeed? You do!
Even if you made mistakes in the past or even if you are already doing good, you have what it takes.
If you are doing bad, this experience can be used to improve your game. If you are doing great, great, let's do better. There is never enough growth; we are happy, we are grateful but we accept abundance because we receive abundance thanks to hard work.
It is still very early but the market is starting to heat up. Once the bullish action starts, there is nothing that can stop us. The world will change for us. We will adapt to all market and geopolitical conditions, we will continue to improve and evolve.
The best one is not the one that makes no mistakes but the one that can extract learning from all experiences. Success is not being right all the time, success is never giving up.
Will you give up? Or, will you continue to trade long-term?
» Bitcoin is going up!
Namaste.
$btc/usdt short swing sh set upth:
sh htf liq + htf sh fib (1.136/1.272) + anti cypher harmonic pattern

$btc long zones set upsth: htf + ltf liq + sh fib lvls + 61.8 fib 1d + 78.6 1d fib + cypher 1d harmonic pattern

BTCUSDT Short Setup Below Major Trendline ResistanceBTCUSDT is currently testing the upper boundary of a descending trendline, which has acted as strong resistance over multiple touches. Price is now at $106,300, a key area aligned with previous rejections and now forming a potential lower high within the structure.
This setup presents a short opportunity, with:
- A clear rejection level at the descending trendline.
- A defined Stop Loss at $108,270, just above recent swing highs and the upper trendline.
- A Take Profit target at $100,559, a level near the bottom channel and prior support.
Trade Parameters:
- Entry: ~$106,300
- Stop Loss: $108,270
- Take Profit: $100,559
- Risk:Reward Ratio: ~1:2.91
A breakdown from this level could trigger continuation to the downside, while a close above the trendline with momentum would invalidate the setup.
Bias: Bearish Rejection from Trendline
Confirmation: Strong wick or bearish engulfing candle near the resistance zone

BTCUSDT Technical Outlook TC is trading at $106k , with resistance confirmed near $106.14k–$106.22k and support at $104.8k .
A daily drop below $104.8k would confirm a short setup. Conversely, a break above $106.2k on elevated volume is required to challenge the $107k–$108k zone.
Absent significant volume, expect continued sideways action between $105k–$106k.

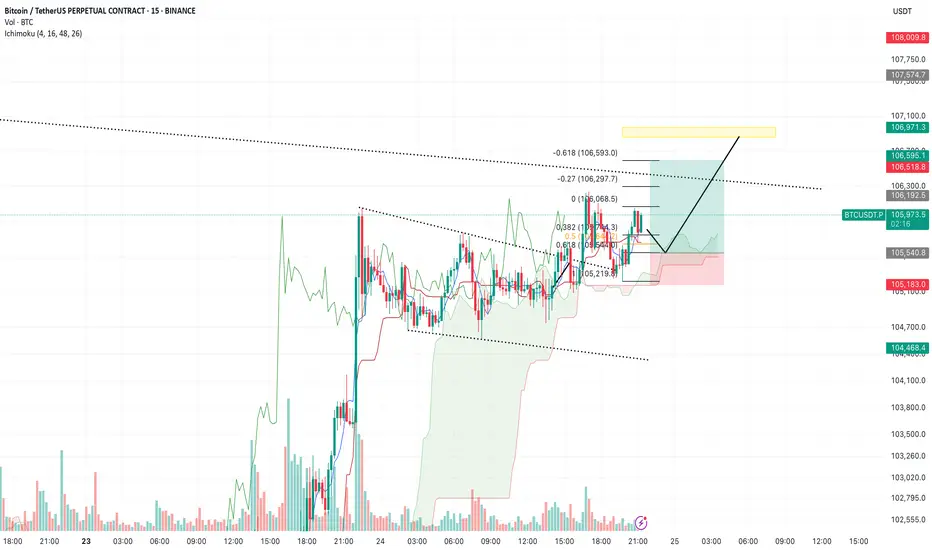
BTC/USDT – Update & New Plan (15m, Ichimoku)Previous idea recap:
Bulls proved stronger than expected — we didn’t get the move down to 104,000 as anticipated. Instead, price rallied directly to the 106,300 block, as outlined earlier, and saw only a brief pullback.
Current outlook:
Buyers remain in control here. My new base case is a move towards 106,900 (yellow liquidity block). Ideally, I’d like to see a quick dip to the 105,550 area first, which would set up a strong launch for the next leg higher into the key liquidity zone.
Watching how price reacts on minor pullbacks — still expecting buyers to step in and push us to 106,900 where significant liquidity is stacked.
Key levels:
Minor support: 105,550
Main target: 106,900 (yellow block)
Bulls remain in control above 105,550
Will update if conditions change.
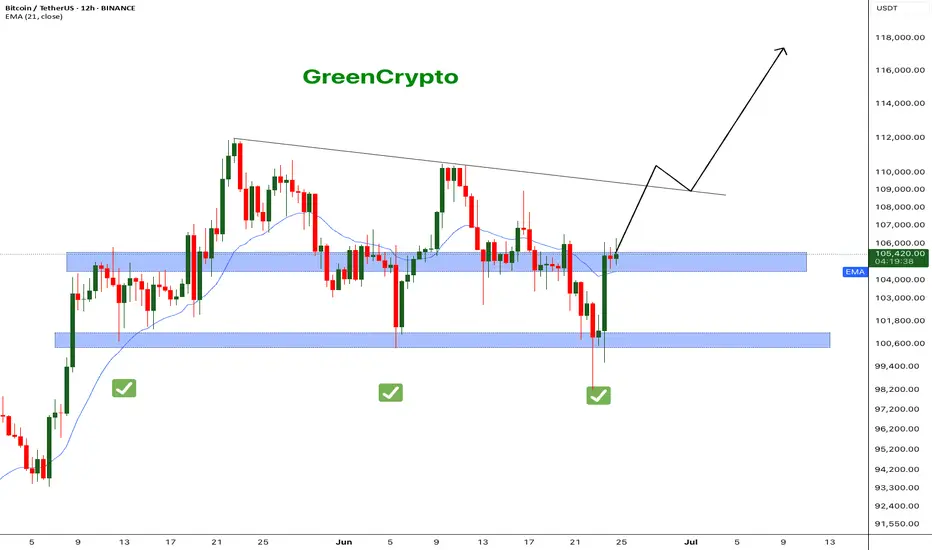
Bitcoin - What's next ? BINANCE:BTCUSDT (12H CHART) Technical Analysis Update
Now that ceasefire is announced, bitcoin price has successfully recovered to the resistance level and currently trading at the resistance zone. It's critical that bitcoin breaks this resistance for it to hit the next resistance around 110K .
I'm expecting price to reach 110k this week and we can see some consolidation in that range before moving further up.
Follow our TradingView account for more technical analysis updates. | Like, share, and comment your thoughts.
Cheers
GreenCrypto
Market next target ⚠️ Disruption Analysis – BTC/USDT
1. False Bullish Narrative
The chart labels the structure as “Bullish”, yet recent price action shows:
A strong rejection near 106,000.
Followed by multiple red candles with increasing volume — a common sign of sell pressure re-entering the market.
The bullish label may be premature or misleading based on this momentum shift.
2. Bearish Structure Developing
The price is starting to form a lower high after the sharp drop.
The outlined path resembles a head-and-shoulders pattern in early development, often preceding a bearish breakdown.
The breakdown could lead directly to the "Target" zone or even below if momentum increases.
3. Volume Divergence
The volume spike during the pump was not sustained. Post-spike, volume is declining on green candles, suggesting buyers are exhausted.
Sellers are likely using liquidity at the top to exit positions, not initiate new longs.
4. Support Turned Resistance
The red boxes mark failed support zones which now may act as resistance.
If price attempts to retest these zones and fails, it would confirm bearish control and validate the downward path toward the target (104,400–104,000).

Bitcoin - Bounce Incoming or Breakdown to 97.5k?Market Context
Bitcoin recently swept the 100k lows, clearing out built-up liquidity beneath that level. This move formed a strong reaction candle, suggesting interest from buyers and confirming the presence of resting demand. The sweep aligns with the concept of smart money targeting obvious liquidity pools before shifting direction. It also marks a potential short-term low, at least temporarily.
Short-Term Structure and FVG Setup
Following the sweep, price tapped into a clean 1H fair value gap and has been respecting it so far. This is our immediate line in the sand. As long as this gap holds, we’re dealing with a scenario of temporary bullish order flow. The market structure on lower timeframes suggests the potential for a short-term rebound, possibly into the inefficiencies left above.
Upside Target and Gap Fill Potential
If price continues to hold the 1H FVG, we could see a push higher that targets unfilled gaps above, particularly the one where we saw a clean rejection previously. There’s a clear inducement just above recent highs, so a sweep of those could be used to fill that imbalance. This would align with the idea of running internal liquidity before reversing or stalling at supply.
Bearish Breakdown Scenario
On the flip side, if price breaks down from the 1H FVG without reclaiming structure, the entire bullish idea invalidates. In that case, I expect price to gravitate back toward the 97.5k zone. This would be a logical area for deeper mitigation and potential reaccumulation, especially since it sits below the current consolidation. The failure to hold the gap would signal weak demand and continuation of the broader bearish leg.
Scouting Liquidity and Price Flow
Right now, the main idea is tied to how price behaves around the short-term 1H FVG. That is the pivot. Hold it, and we should see some form of liquidity run into the unfilled gap above. Lose it, and the next wave of downside should unlock, pushing us closer to 97.5k. Either way, liquidity remains the core driver in both directions.
Conclusion
Price has swept major downside liquidity and is now reacting to a key imbalance. As long as the 1H fair value gap holds, I expect short-term upside targeting unfilled inefficiencies and internal highs. A failure to hold would shift the bias back to the downside, with the 97.5k range as the next probable draw on liquidity.
___________________________________
Thanks for your support!
If you found this idea helpful or learned something new, drop a like 👍 and leave a comment, I’d love to hear your thoughts! 🚀

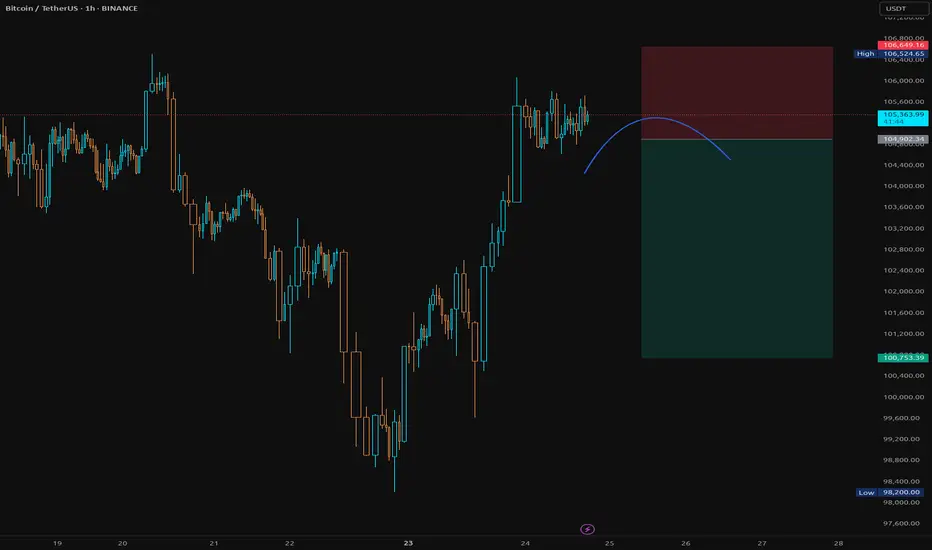
BTC Short Setup – Breakdown Below Structure💡 Idea:
Bitcoin is consolidating under a key structure after a sharp bullish move. If price breaks below the curved neckline, it could signal the start of a local downtrend.
🔔 Trade Plan:
Entry: Below $104,902 (after a clear 1H candle close under the curved line)
Stop-Loss (SL): $106,649 (above the recent swing high)
Take-Profit (TP): $100,735 (targeting major support zone)
Risk/Reward: Approximately 1:2.38
🧠 Reasoning:
Price is forming a rounding top structure, indicating potential exhaustion of bullish momentum. A break below the curve could lead to a retracement toward the $100k support level.
📆 Timeframe: 1H
⚠️ Always wait for confirmation and manage your risk.
Where are we going?BTC is at a critical level of resistance at the prior low. Breaking above this level would suggest a change in the trend. A rejection would suggest a final downward movement, which I would prefer in order to complete a 1-2-3-4-5 wave count and avoid an expanded flat correction.
