BTCUSDTHello Traders! 👋
What are your thoughts on BITCOIN?
In our previous outlook, we anticipated a pullback to the channel bottom followed by a bullish move, and so far, price has followed that scenario perfectly.
Bitcoin is now approaching the channel top and a major resistance zone. At this point, we are watching two potential scenarios:
Scenario 1 – Pullback Before Continuation:
If price rejects the resistance, a correction toward the midline of the channel (which aligns with a key support level) may occur. This could offer a strong entry point for the next bullish wave.
Scenario 2 – Breakout and Retest:
If Bitcoin breaks above the channel and resistance zone, we can look for buy opportunities on the pullback to the broken level, with potential targets at higher levels.
Price action in this area is crucial. Both a midline pullback and a resistance breakout could provide valuable trading setups.
Is Bitcoin gearing up for a breakout, or is another correction coming first? Share your view below! 🤔👇
Don’t forget to like and share your thoughts in the comments! ❤️
BTCUSDT.5L trade ideas

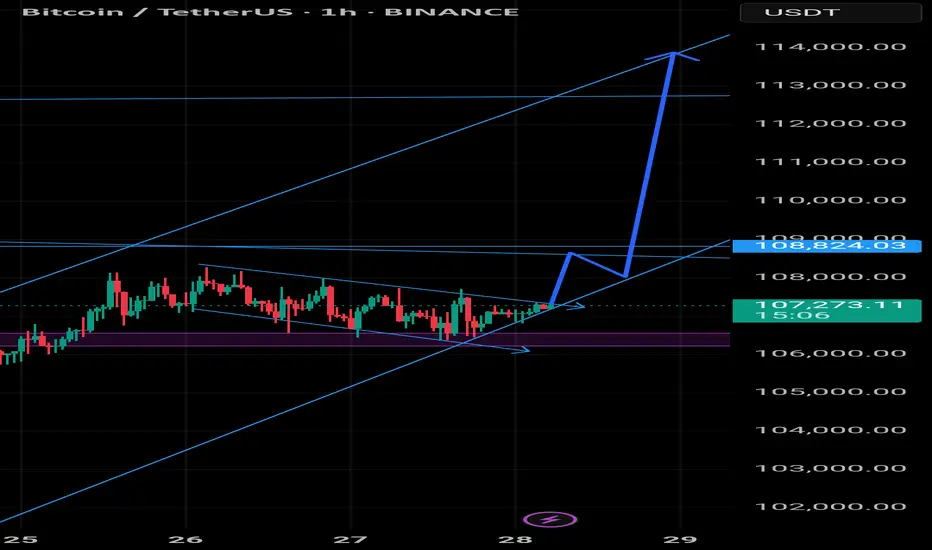
BTCBtc was trading inside falling wedge since a weak. it has cleared it now and has very good possibility of pumping hard to 112k

BTC's Mid 2025 OutlookBitcoin is currently trading around $107,000 on the 4-hour 4H timeframe, navigating a consolidation phase following a sharp rally that culminated in a new all-time high of $111,900 in May 2025. Despite recent price corrections, BTC remains up 3% on the week, reflecting underlying bullish momentum. This sustained strength hints at continued confidence in the market, particularly among larger players.
A notable development supporting this view is the increase in the number of Bitcoin wallets holding at least 10 BTC, which has surged to a three-month high of 152,280. This metric is widely regarded as a proxy for whale activity and may indicate renewed institutional interest, especially amid accelerating inflows into spot Bitcoin ETFs.
On the 4H chart, Bitcoin appears to be consolidating within a tight range, hovering just beneath a key supply zone at $107,000, which could act as short-term resistance.
Several potential outcomes are currently in play:
Bullish scenario:
A breakout above the $107,000–$108,000 range could clear the path toward the critical resistance at $115,000. A successful move above this threshold would likely signal resumption of the broader uptrend, with some technical analysts eyeing a potential cup and handle formation that could project long-term targets up to \$180,000
Bearish scenario:
If BTC fails to hold above the current level, it may correct toward the first major support at $102,800, with further downside risk to $98,500. In a more pessimistic setup, price could extend losses toward $96,000, especially if macroeconomic or geopolitical pressures intensify
Key levels to watch:
Resistance: $107,000 - $115,000
Support: $102,800 - $98,500 - $96,000
Market Sentiment and External Drivers:
Bitcoin's price is being shaped not only by technical dynamics but also by powerful external forces
Spot Bitcoin ETFs:
The US regulatory greenlight for spot ETFs has dramatically altered market dynamics. With projections of $190 billion in assets under management AUM for these products by the end of 2025, institutional access to BTC has become more streamlined, providing strong tailwinds for long-term accumulation
Geopolitical risk and macro conditions:
Global uncertainty, particularly due to escalating tensions in the Middle East and potential US military involvement, has introduced volatility. At the same time, rising inflation and economic instability in developed markets is a double-edged sword, either undermining risk assets or conversely boosting Bitcoin’s narrative as digital gold and a hedge against fiat devaluation
Forward-Looking Outlook:
Bitcoin is at a critical juncture. The ability to sustain above $107,000 and reclaim the $115,000 resistance will be pivotal. A confirmed breakout could open the door to price discovery and possibly a surge toward $130,000 to $150,000, with $180,000 as an extended target in more bullish scenarios
However, a failure to hold key support levels could shift momentum toward the bears, prompting a deeper correction toward the $96,000 zone. Traders should monitor:
- Price reaction around $107,000 and $115,000
- ETF inflow data and AUM growth
- Macro news especially inflation reports and central bank commentary
- Developments in global conflict zones impacting risk appetite
Conclusion:
Bitcoin’s medium-term direction hinges on a delicate interplay of technical consolidation institutional flow and macro geopolitical signals. While the bullish structure remains intact for now a decisive move in either direction above $115,000 or below $98,000 could set the tone for the next major trend.

Bitcoin 100K$ is strong soon range will end and bulls will winSoon we are looking for a heavy rise here like the green arrows on chart and new ATH which would be nonstop and first target for that is around 120K$.
Also we should consider that we have range zone around 100K$ support to 110K$ resistance zone and we need breakout first and then next possible move is obvious.
DISCLAIMER: ((trade based on your own decision))
<<press like👍 if you enjoy💚

BTC/USDT high win scalping signals in 15 minutes are as follows- Signal: LONG
- Admission: 107,260 ~ 107,340
- Take Profit: 107,620, 107,880

Bitcoin Bounced Right Where It ShouldBitcoin continues to respect the script — breakout, clean retest, and now holding strong.
The 50 EMA has been a reliable dynamic support throughout the entire uptrend, and once again, it helped catch the recent dip. Price has now successfully retested the breakout zone and is starting to bounce.
Structure looks healthy, momentum is building, and unless the support fails, the next leg up could be just around the corner.
Simple setups. No noise. Just trend.
DYOR, NFA

Bitcoin ready to move towards 85,000When a trend line is broken, it suffers for a few days and then moves
Tp1:85000
To2:80000
2p3:63000

Bitcoin ready to move towards 85,000Be prepared to fall after breaking the trend line and back to the target of 85,000.
Bitcoin ready to move towards 85,000🤪🤪🤪🤪🤪

Up for BitcoinHi traders,
Last week Bitcoin made a small correction up and after that another drop just as I've said.
After it retested the Weekly FVG and broke the previous swing low it went impulsive up again.
This could be the next impulse wave to new ATH's. So wait for the correction down to finish and trade longs.
Let's see what the market does and react.
Trade idea: Wait for the correction down to finish to trade longs.
If you want to learn more about trading FVG's with wave analysis, please make sure to follow me.
This shared post is only my point of view on what could be the next move in this pair based on my analysis.
Don't be emotional, just trade your plan!
Eduwave

Bitcoin Next Move These are the two levels I am currently looking at to trade.
If we sweep the local high at 109k then we will be trading into a zone of supply as well which is good confluence in terms of a setup, most important is going to be the reaction of price off of that level.
My higher probability setup will be around the 111k level as that is where we have multiple sets of Poor highs and it is closer to the range high. I always prefer trading near the extremities of the ranges for higher probability setups.
I would also consider a long from 103k if we get a fast flush into that level but I prefer 101-102s to long as that is at the range low.
Note:
1. Always observe reaction at key levels before entry to avoid forced trades.
2. Maintain disciplined stop loss placement especially near supply sweeps and flush longs.
3. Prioritize setups at range extremes (102k or 111k) for optimal entries aligned with your edge.

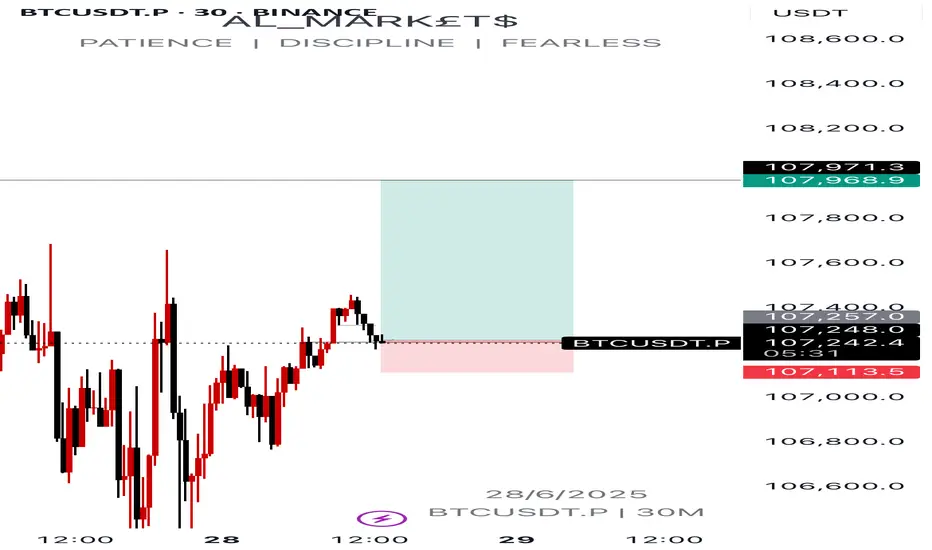
BTCUSDT.P potential short term buysCurrent price action is pointing out to potential short term buys on btc.
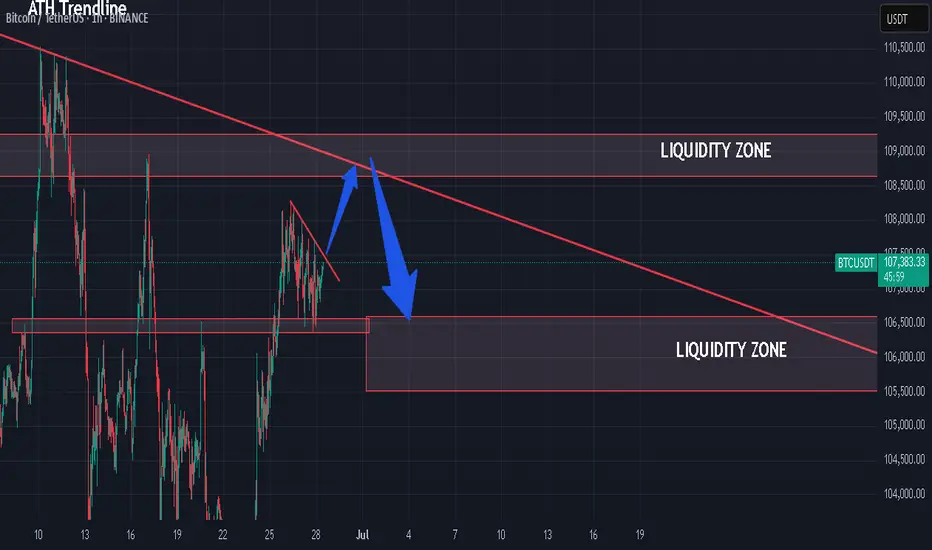
BTC - Will the Bears finally get their chance?Buy Side Liquidity Sweep in Progress
Price is currently climbing toward a region densely packed with resting buy side liquidity, marked by multiple previous highs. The area around 108,900 to 111,000 is especially significant, with two clear liquidity pools stacked above recent swing highs. These levels are likely to attract price as market participants seek to trigger stop orders and induce fresh buying interest—setting the stage for a potential reversal.
Weakness in the Current Impulse
The recent rally has advanced with minimal retracement and virtually no visible Gaps. This lack of corrective structure often indicates imbalance and suggests the move is overextended. When price moves upward too cleanly, it tends to leave behind thin liquidity zones, making the entire leg vulnerable to a sharper correction once exhaustion sets in.
Fair Value Gap as a Draw Below
Below current price lies a prominent bullish Fair Value Gap around 104,000. This inefficiency was left unfilled during the last leg up and may now serve as a magnet for price. These types of Gaps are often revisited by the market in an effort to rebalance supply and demand, especially after aggressive moves that break structure to the upside.
Once the higher liquidity levels are swept, watch for a clear reaction—either a strong rejection or lower timeframe structure shift—which could signal that the top is in. If that shift materializes, price may begin a downward leg targeting the unfilled Gap below. The magnitude of the move, combined with the lack of structure on the way up, leaves plenty of room for corrective action.
For those looking to engage, waiting for confirmation on a lower timeframe—such as a break of short-term bullish structure or the formation of a bearish Gap—can help time entries more precisely. In setups like these, patience is key: let the Sweep play out, observe how price reacts, and only then consider stepping in.

Btc usdt 1-3-6-12 mouthAnalysis of Bitcoin's movement for the near future. For 1-3-6 months. Based on candlestick and technical analysis

BTCUSDT 30min Breakout Watch | Micro to Macro AlignmentSummary
Bitcoin is showing a classic multi-timeframe confluence setup. On the weekly chart, BTC is holding above key EMAs with bullish continuation patterns. The daily chart shows a breakout from a descending triangle, while 4H and 30-min charts confirm a narrowing price wedge inside a larger compression zone. Momentum is rising, but volume remains subdued. A confirmed breakout above $108K may trigger a measured move toward $114K–$118K, while a breakdown below $105K could lead to deeper retracements.
BTC 30m chart forming a tight triangle with bull flag structure inside.
Price hugging EMAs, RSI ~52, Kalman flipped green, ADX ~23 = prepping for move. Breakout above $107.6K can push fast to $108.3K+. Breakdown below $106.6K weakens structure.
Scaling out
4H: Descending wedge with bullish RSI divergence, ADX rising, support at $104.5K.
1D: Breakout from falling wedge, reclaiming EMAs, but needs volume.
1W: Bullish flag breakout setup; EMAs aligned; RSI > 57, room to run toward $114K if $108K clears.
Watch volume confirmation across timeframes for trend validation.

Bitcoin's Growth Potential Intact Despite Short-Term UncertainyBitcoin has rallied to $108k after sweeping liquidity below $98k, driven by easing geopolitical tensions in the Middle East. The cryptocurrency's fundamentals and structural trends suggest room for growth, but it appears to have exhausted its momentum, entering a consolidation or accumulation phase. Technically, the 4-hour chart is limited, but a potential correction to $104k-$103k could occur before further growth. For now, traders can focus on short-term buys and sells in the $106k-$108k range, awaiting clearer direction.

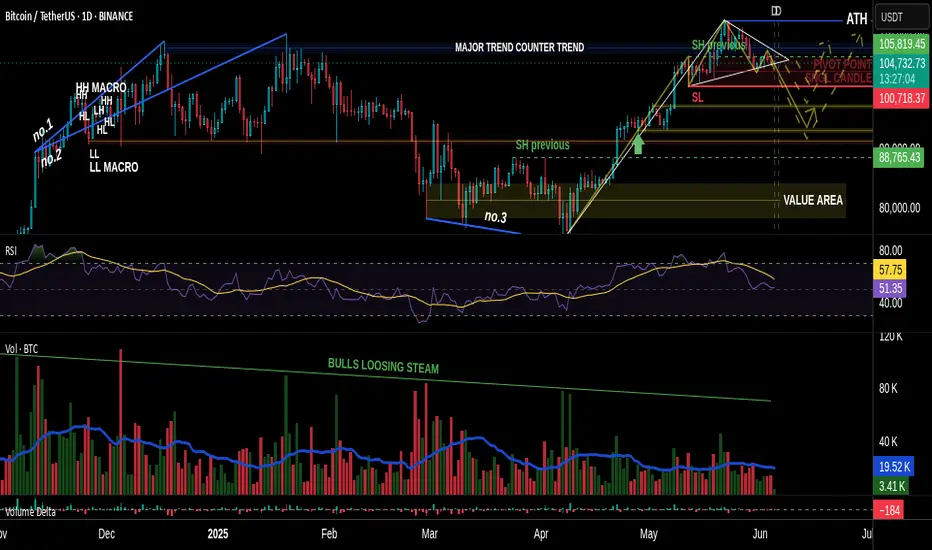
VSA vs BTC: Into a Bearish Scenario or Not?Predicting the market requires skill.
Most traders fail at one crucial point: they don’t see the market as a living, breathing organism—a structure where one move leads to another, like cause and effect in motion.
That’s what we often call reading the psychology of the market. When you begin to grasp the fundamental principles behind that, you step into the realm of elite traders.
And yes—Volume Spread Analysis (VSA) is a powerful tool, but only if you know how to read it properly.
I’m not a certified trader or financial advisor, and I don’t give signals, entries, or exits. I’m simply a solo observer, sharing a slice of what true technical and fundamental analysis looks like.
And yes—it takes time. It takes skills. Now, if we want to even attempt predicting the future of price action, we must understand something: A chart is not a single truth. It’s a battlefield of conflicting signals.
Patterns, marks, levels—some suggest bullish continuation, others hint at sharp reversals. Confusion is inevitable if you don’t learn to distinguish which signs matter.
In our current BTC chart, we’re witnessing this contradiction unfold clearly:
• A bullish flag formation...
• Yet within it, the emerging completion of a Head & Shoulders pattern!
How arrogant can the market be! 😄
A moment to laugh—but also a moment to observe how cleverly the crowd is misled.
This is classic manipulation, wrapped in a textbook setup.
But what’s most telling isn’t the pattern on the surface—it’s the volume beneath the structure.
It’s always the quiet details that speak the loudest.
Before price shows its true face, volume often leaves footprints. In our case, those footprints were already leading toward a bearish path—long before the structure began to shape itself clearly.
So while retail eyes focused on the bullish flag, the underlying volume had already begun withdrawing support.
Not aggressively—no. Subtly, almost elegantly, in that familiar way institutions mask intention:
• Spikes that don’t hold
• Buying that doesn’t follow through
• And a steady fade in commitment as price climbs into weakness
It’s in those quiet inconsistencies where VSA earns its value.
It tells us: the move isn’t about what’s obvious.
It’s about what never fully materialized.
So yes, the pattern may still remain incomplete. The Head & Shoulders may yet fail to validate.
But for those who were watching volume first—not structure—the script was already being written.
✒️ From now on, professionally speaking, we must still wait:
• For the Head & Shoulders to confirm or dissolve. So eyes targeted at the swing low level near 107k
• And for volume to either legitimize or invalidate the entire setup
Only then does the chart grant us permission to speak in certainties.
🐾 But so far…
• The clues have favored the bears.
• Sell opportunities appeared early and often—for those who know what to look for.
• Bullish spikes in volume? They were met with silence.
• Momentum fizzled under a macro backdrop of fading demand.
If you were in the right mindset, and aligned even the lower timeframes to basic structural zones,
you already saw the path ahead wasn’t being carved by the bulls.
Let them finish the patterns.
Let the candles paint the story.
But for those trained in volume, the ink has already dried.
And if you're still reading, maybe you already sense it—
real insight doesn’t shout, and it never floats in abundance.
Value has never been about noise. It’s about what’s rare, quiet, and overlooked by the crowd.
Just like in the markets—the true signals aren’t loud, and they’re never free in the economic sense.
Just as price rises where supply thins, the same applies here:
what’s scarce... holds weight.
PS For last A little exercise, something to grasp on. Have you noticed how Volume & RSI behaves in lower time frames? 4Hour or 1Hour for example. Can you identify how volume confirms a bearish move. Do you discover the correct correlation and combined use between VSA & RSI. Remember my previous insight
See you next time!
PRICE SPECULATION ON BTCUSD!Price updates from the H1 timeframe . Price is likely to drop from the current high after we saw a distribution stage currently forming, therefore, a sell opportunity is envisaged.


Middle East peace/war = Bitcoin’s Explosive Price CoilDo you know why every time tensions rise in the Middle East, Bitcoin springs upward like a compressed coil?
This market reaction isn’t just a coincidence it’s the result of a mix of psychological and economic factors we’ll explore today.
Get ready to understand how these crises can create golden opportunities for the world’s favorite digital currency.
Hello✌
Spend 3 minutes ⏰ reading this educational material.
🎯 Analytical Insight on Bitcoin:
Price is approaching a significant support level that has held strong historically. A potential rebound from this zone could lead to at least a 7% upside move 📈, with the primary target set around $115,000—near a key descending trendline on the daily chart. Watching this level closely for confirmation 🔍.
Now , let's dive into the educational section,
Market Psychology: When War Plays with Fear and Greed 🧠
Middle East crises act like a spring: when released, they trigger intense fear in the market. Many traders react emotionally and start selling their holdings. The key point: this fear often flips into greed.
When Bitcoin’s price drops due to war fears, savvy traders seize the opportunity and enter the market. This cycle of fear and greed causes Bitcoin’s price to surge faster than usual just like a compressed spring suddenly releasing.
If you understand these market emotions and trade without bias, you can maximize gains from such volatility.
Key TradingView Tools for Bitcoin Analysis 📊
When the Middle East conflict heats up, market volatility spikes, affecting Bitcoin as a high-risk asset.
Using essential indicators like RSI , Fibonacci retracements , and volume on TradingView helps you pinpoint precise entry and exit points and better understand market reactions.
Practical Tips for Better Tool Usage ⚙️
To get the most out of TradingView:
Activate several indicators simultaneously and compare price movements with volume.
Draw Fibonacci retracements on previous trends to find key support and resistance levels.
Check RSI to see if Bitcoin is overbought or oversold.
Monitor trading volume to confirm momentum shifts.
This approach turns your analysis from guesswork into a logical, actionable strategy.
How Middle East War Drives Bitcoin Growth: Final Analysis 🚀
As tensions escalate, investors seek safe-haven assets, and Bitcoin, known as digital gold, attracts massive attention. Also, banking restrictions and sanctions push liquidity toward cryptocurrencies.
These condition s, combined with market psychology and the analytical tools we covered, make Bitcoin behave like a compressed spring that suddenly leaps upward, driving significant growth. Traders aware of these trends and skilled in using indicators and sentiment can find better profit opportunities.
Recommendations 📌
Geopolitical tensions in the Middle East act as a powerful trigger for Bitcoin volatility. Understanding market psychology, smart use of TradingView tools, and having a solid risk management strategy are key to success in such times. I recommend keeping an eye not just on technical analysis but also on market sentiment and political news to make the best timely decisions.
✨ Need a little love!
We put so much love and time into bringing you useful content & your support truly keeps us going. don’t be shy—drop a comment below. We’d love to hear from you! 💛
Big thanks,
Mad Whale 🐋
📜 Please remember to do your own research before making any investment decisions. Also, don’t forget to check the disclaimer at the bottom of each post for more details.

BTC Trade Setup 28.06.2025 BTC Possible Trade Setup.
Entry 108.600 - 109.000
TP.1 106.500
TP.2 105.500
SL 110.000
its my own analysis, i am not liable of any loss.
Btcusdt A break above the trend line could lead to a potential run up in BTC price but a break below the purple support could lead to a drastic drop in price
BITCOIN PRICEACTION TRADING STRATEGIESBitcoin’s price is influenced by macroeconomic factors, including U.S. inflation trends and institutional adoption (e.g., Bitcoin ETFs with $138B in assets). Its volatility remains high, with 10% daily moves possible, driven by 24/7 trading and sentiment shifts. Recent recovery from a dip below $102,000 was tied to geopolitical tensions, but macro signals suggest a risk-on environment supporting further gains.
Outlook: Bitcoin is at a critical juncture, with technical indicators leaning bullish but resistance at $108,000 posing a challenge. A decisive breakout above $108,950 could signal a move toward $111,000-$115,000, failure to hold this level will retest 100k$ level or below.and below 100k could turn bearish .

Bitcoin - Time to sell, huge drop will follow (must see!)Bitcoin is currently approaching a very strong resistance of this major bullish flag! We definitely want to sell resistances and buy supports, not the other way around, until we have confirmations. Bitcoin's price action is statistically very boring during summer seasons! Usually high volatility kicks in in September. I think we cannot really expect a new all-time high in the next few weeks. Instead, we should see a big range. In the short term, Bitcoin should go back at least to around 102,600 USDT to fill up the FVG. Also, markets always move in waves, and this move from 98,200 seems to be exhausted already.
On the chart we can clearly see a blue trendline, and price went below this trendline at the end of May. This indicates that the uptrend is over and a consolidation/distribution phase is in progress. This phase is usually represented as a bull flag, triangle, rectangle, or wedge. When we look at the current price action, it looks like a bullish flag consolidation pattern. Bitcoin is currently in the sell around 109k
There are 2 types of traders. The first one they love to trade ranges, and the second they love to trade breakouts and higher volatility environments. Currently I think Bitcoin is creating a range, so do not expect any crazy movements until this bullish flag is valid.
Bullish flags are usually bullish patterns, but often they break down and act like bearish patterns. So what would happen if this bullish flag breaks down? That would send the price of Bitcoin to the 0.618 FIB, which is at 88,882 USDT. What if this bullish flag breaks out? That would send the price of Bitcoin to 116,000 to 125,000, but to establish this price, we first need to see the low of the bull flag, which is not confirmed yet. I will definitely inform you in one of my next analyses, so write a comment with your altcoin + hit the like button, and I will make an analysis for you in response.
Trading tip at the end: "A trader needs to accept the losses to maintain their emotional stability. Losses are a crucial internal part of trading that helps traders to learn how to grow from their losses. Traders learn from losses and implement required changes in their strategies for better results in future trades." Trading is not hard if you have a good coach! This is not a trade setup, as there is no stop-loss or profit target. I share my trades privately. Thank you, and I wish you successful trades!
