#BTCUSDT.p Bearish📉 Short Trade Alert! We're eyeing a potential downside move with a clear entry, stop loss, and multiple profit targets. Keeping a close watch on this one. #Trading #MarketAnalysis #ShortTrade #RiskReward
BTCUSDT.5L trade ideas

BTC - Testing Trendline Here is an update to our previous post:
Zoom into the lowertime frame (1H) here is a zoomed in look at what is going on. Right now BTC just tested the trendline we pointed out in the last post. As you can see we have many touchpoints of support on this trendline (green arrows). Very important to monitor BTC's price action around this trendline.
If price is to lose this level then we would want to watch our fib target of $103k. If price can continue to hold it as support then a move back to test the red trendline is likely.

Bitcoin Short-Term Outlook – Coming Week📈 Bitcoin Short-Term Outlook – Coming Week
Currently, Bitcoin is expected to gather liquidity around the $106,000 zone, potentially initiating a move toward the $110,000 resistance level.
This area will be crucial in determining the next directional move.
🔍 The market's reaction around $110,000 will be closely monitored, and the analysis will be updated once that level is reached.
📌 Note: This outlook is based on current market conditions and may require adjustments if sentiment or price structure changes.

BTC - Daily Chart - Bull flag route 7/1/2025July 1st, 2025
BTC - Daily Chart
A bull flag route = Two Scenarios
1. Breakout - UP
- Retrace before the $105k area
- Consolidate
- Break out the top line
SL $104k
TP1 @ 108k
TP2 @ 111k
Final TP @ 113k NEW ATH
2. Fail support - DOWN
- 105k fail to support
- Aim for the button of the flag for support
SL $106k
TP @100k
Final TP @96k

BITCOIN PREDICTION THAT WILL MAKE BULLS CRYI am sharing with you exclusive insights that I am seeing on MARKETSCOM:BITCOIN right now.
WARNING: If you are a bull, you might start crying hysterically while watching this video.

BTC/USDT Technical Analysis, 2025-07-01 19:30 UTCA bullish trade opportunity was identified after price action formed a Piercing Line candlestick pattern, signaling a potential reversal from recent lows.
🔹 Technical Overview:
Entry Price: 105,869.86 USDT
Take Profit (TP): 106,939.86 USDT
Stop Loss (SL): 104,669.86 USDT
200 EMA: 106,320.49 USDT (Price is trading below — potential dip-buy opportunity)
Pattern Detected: Piercing Line (bullish reversal)
🔹 Volume Context:
Recent candles showed moderate volume with signs of buyer interest increasing.
OBV trend has turned slightly positive, supporting a short-term bullish case.
🔹 Order Flow:
Price action is showing signs of recovery from a local support zone.
Some imbalance in the order book tilted toward buyers, with supportive bid liquidity observed.
This setup combines trend deviation, bullish price action, and support reaction, creating a favorable risk-to-reward scenario. Trade is now active and being monitored toward the defined TP level, with strict stop-loss protection in place.

Bitcoin Next Move These are the two levels I am currently looking at to trade.
If we sweep the local high at 109k then we will be trading into a zone of supply as well which is good confluence in terms of a setup, most important is going to be the reaction of price off of that level.
My higher probability setup will be around the 111k level as that is where we have multiple sets of Poor highs and it is closer to the range high. I always prefer trading near the extremities of the ranges for higher probability setups.
I would also consider a long from 103k if we get a fast flush into that level but I prefer 101-102s to long as that is at the range low.
Note:
1. Always observe reaction at key levels before entry to avoid forced trades.
2. Maintain disciplined stop loss placement especially near supply sweeps and flush longs.
3. Prioritize setups at range extremes (102k or 111k) for optimal entries aligned with your edge.

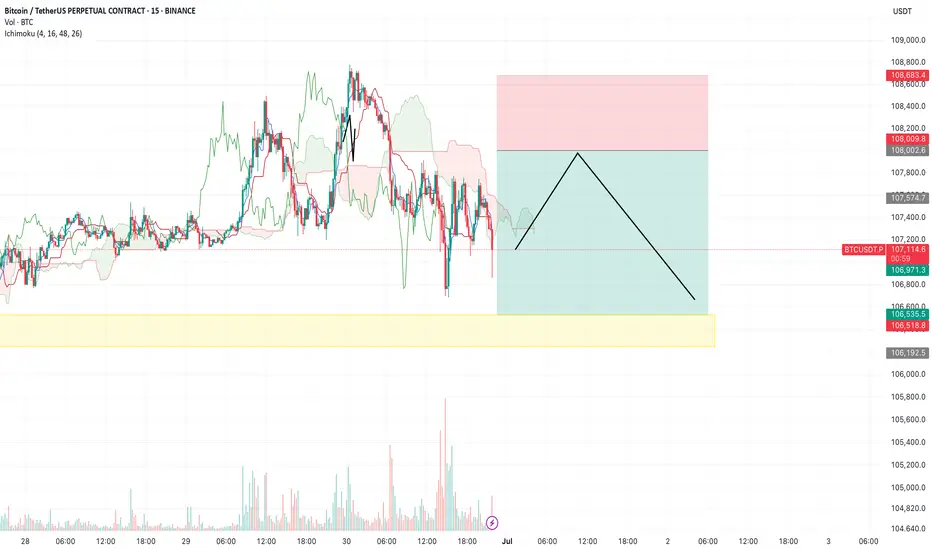
BTC/USDT – Trade Review & New Plan (15m, Ichimoku) by RiscoraYesterday’s short setup didn’t work out as planned — stop-loss was hit as bulls showed strong momentum. However, I still believe that a move to the yellow block (downside liquidity zone) is possible, and the idea remains valid.
The main mistake was with the stop placement, not the scenario itself. After taking a loss, I’m more cautious: reducing risk, lowering position size, and entering with less conviction. Bulls were dominant yesterday, so I’m keeping my risk tight on this trade.
I’ll take the setup again, but with a more conservative approach. If price breaks and holds above my stop-loss level, it will confirm a shift in sentiment to bullish, and I’ll look to flip my bias accordingly.
Key points:
Previous short was stopped out — reviewing risk
Still see potential for a move to the yellow block
Lower risk, smaller size after a loss
If price holds above stop, trend flips bullish
Let’s see how this plays out.
#BTC #Crypto #Trading #Ichimoku #Riscora
BTC on Close Compression -110k?Not now, but looks like will test 107,800 again from the point, what say?

The Pattern That Could Launch Bitcoin, pt. 2There appears to be an IH&S pattern forming inside of the larger IH&S's right shoulder (see my previous post for the larger one). I've seen this happen a few times and then a break out upwards! Results may vary of course lol.
If it drops from here support could be at around $102k and then $100,500.

BTC - Still StrugglingPlease refer to the last post:
We have been monitoring BTC at this red trendline for a potential breakout. In this post we are examining a lower timeframe (6H) to see how this structure is developing.
Price tried to rally to the red line, but sellers came in and swiftly pushed price back down. This is looking to be a third rejection at this red trendline so far.
Buyers are also fighting on the LTF. We have seen the low/mid $106k levels acting a support.
A break below $106k could lead to a drop back to our white trendline. This white trendline was recently established with 2 points of resistance (red arrows) followed by it being flipped into new support with 2 touchpoints (green arrows). Depending on when/if this trendline is tested it could bring BTC anywhere between $103-105k. Will update this post if that does happen.
In the meantime our three areas to watch on the lower timeframes.
-A break above the red trendline
-The midline around $106k continuing to hold
-The white trendline being tested

trade idea on btcthis is my idea about bitcoin movement in next hours.the target is shown in picture.follow for more....
long bitcoin from 106160ALL trading ideas have entry point + stop loss + take profit + Risk level.
hello Traders, here is the full analysis for this pair, let me know in the comment section below if you have any questions, the entry will be taken only if all rules of the strategies will be satisfied. I suggest you keep this pair on your watchlist and see if the rules of your strategy are satisfied. Please also refer to the Important Risk Notice linked below.
Disclaimer

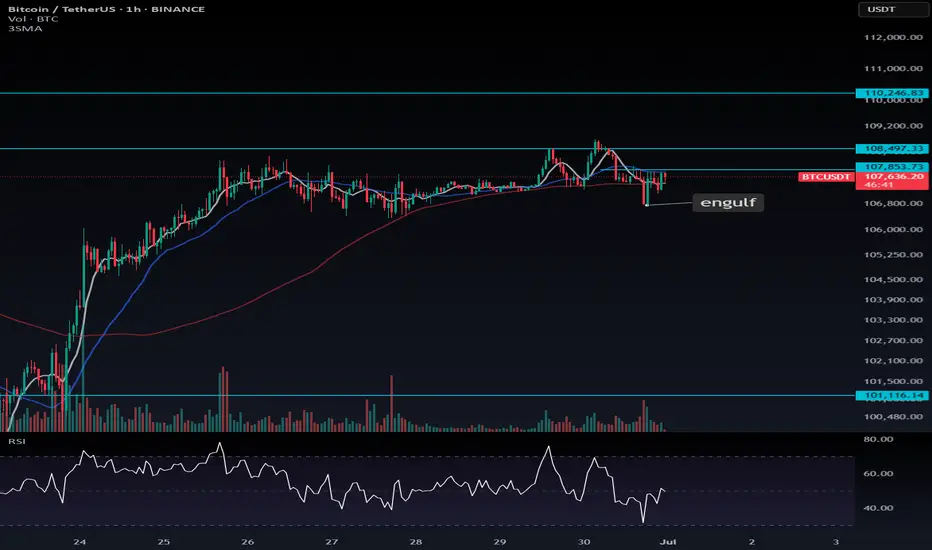
BTC Bullish Engulfing – Multiple Long Opportunities🚀 BTC Bullish Engulfing – Multiple Long Opportunities
Following the bullish engulfing candle, there are two potential long entries for Bitcoin:
🎯 Aggressive Entry: at $107,853.7 (higher risk)
✅ Conservative Entry: at $108,497.3
🔐 Stop-loss advice:
Place your stop either:
At a level that won’t be easily hit by short-term noise, or
At a level that confirms a short-term trend reversal if breached.
📈 If neither trigger plays out, set a stop-buy order at $110,246. A strong breakout is likely above this level, so don't miss it if momentum kicks in.
🧠 The choice is yours:
Enter early and accept the risk of getting stopped out
Or wait for confirmation and risk missing the trade
📌 If you’re already in a BTC long based on earlier signals, consider opening a position in high market cap altcoins to diversify exposure.
---
💬 Which entry level are you going for — early risk or breakout confirmation? Let me know in the comments! Always curious to see your strategies.
The Critical Blue Line – Will Bitcoin Soar or Sink
🔹 Bitcoin Technical Analysis – Key Blue Line, Bear Trap Possibility & Long-Term Scenario
On the Bitcoin chart, the blue horizontal level has acted multiple times as both support and resistance. The price has broken it several times but failed to sustain above, indicating high-volume decision-making zones by institutions and large players.
📉 Why this pattern keeps repeating:
Strong supply and demand concentration at this level.
Inability to break and hold shows market indecision.
Repeated fakeouts are likely used to shake out weak hands.
🔍 Important hidden scenario: Bear Trap Potential
If the price dips below the blue line but quickly reclaims it, it may form a bear trap, tricking short sellers into entering prematurely. This move could ignite strong bullish momentum from trapped sellers and renewed buyers.
🔮 If price holds above the blue line:
Signals market strength and potential bullish structure shift.
Targets:
109,800
117,200
120,000+ (Long-term)
📛 If support fails again:
Retracement toward the lower channel near 101,000 or lower is possible.
📊 Conclusion:
This zone is one of the most critical decision points in the current market. Traders should combine volume, candlestick behavior, and confirmation signals to avoid getting trapped by fake breaks

BTC/USDT 4H Outlook - Bearish Setup playing outAs expected, BTC is now moving toward the 4H liquidity zone.
❗Price is breaking structure from the Daily FVG resistance, showing bearish momentum.
🔍 Current confluences in play:
— Rejection from Daily FVG
— 4H structure shift
— Clean imbalance below
🎯 My next key zone is 104K (4H liquidity)
Reaction there will guide the next move.
Stay tuned for more updates

BTC/USDT – 4H Liquidity Sweep Likely Before Bullish ReactionBitcoin is showing signs of distribution within a daily FVG range. The recent failure to break above 107,000 with strength suggests a sweep of downside liquidity is likely.
🧩 Key Observations:
• Price is still respecting the daily FVG above (imbalance not fully filled).
• A visible liquidity pool is sitting below recent 4H lows near 104,000.
• Confluence with 4H support zone and lower daily FVG around 102,000.
🎯 What I Expect:
• Price to sweep 4H liquidity → tag 104K area
• Possible wick or reaction from there
• If momentum increases, price could tap into the deeper imbalance around 102K
📌 Setup Bias:
Short-term bearish (targeting liquidity grab), then reassessing for long setups near support + FVG convergence.
🧠 This setup is built on smart money principles — liquidity engineering, fair value gap fills, and mitigation.
⸻
Key Levels:
• 🔴 Resistance: 107,000–108,000 (Daily FVG top)
• ⚫ Target Zone: 104,000 (Liquidity + 4H support)
• 🟣 Potential Bounce Zone: 102,000 (Lower Daily FVG)

BTCUSDT – Multi-Timeframe Analysis | Demand Zone Sweep SetupAnalyzing BTCUSDT using 15m, 1h, 4h, and 1D timeframes.
Current structure shows a potential demand zone sweep followed by a reclaim setup.
Key confluences include:
RSI divergence forming on the 15m and 1h
Possible CHoCH on the 15m chart confirming bullish intent
Daily structure still intact as long as 106k holds
TP1, TP2, and SL levels are marked on the chart.
Monitoring closely for bullish confirmation before entry.
Trade what you see, not what you feel.

BTC limit BIDPlacing bids at the Key S/R level and targeting buy side liquidity and stops at the bearish structure
reason for the limit setup is liquidity wicks around the 106500-106400 and market makers will try to take that liquidity after monthly open or daily open

BTC next boom beginning I'm going to see boom in btc
Here’s the analysis of Bitcoin’s (BTC) next expected move in English, based on current market conditions and technical indicators:
---
### **1. Short-Term Outlook (Next 24-48 Hours)**
- Bitcoin is currently trading around **$107,400**, with **$108,000-$109,000** acting as a strong resistance zone.
- If BTC breaks above **$109,870** and closes above it, the next target could be **$114,950**.
- If the price fails to break resistance, a pullback to **$105,300** or **$103,900** (support levels) is possible.
- The **30-minute RSI is at 52.22** (neutral-bullish), and the MACD histogram is in positive territory.
---
### **2. Medium-Term Outlook (1 Week to 1 Month)**
- **Coincodex predicts**:
- **$116,914** (+8.98%) by July 2025.
- **$136,858** in the next 3 months.
- **DigitalCoinPrice forecasts**:
- Average price of **$221,961** by late 2025, with a potential high of **$235,354**.
---
### **3. Key Technical Indicators**
- **4-Hour Chart**:
- BTC is testing the **upper Bollinger Band ($108,672)**. A breakout could target **$114,956**.
- **Support Levels**:
- Immediate support: **$105,358** (EMA 100).
- Strong support: **$103,996**.
---
### **4. Market Sentiment**
- The **Fear & Greed Index** is currently at **74 (Greed)**, indicating bullish sentiment but also potential overbought conditions.
- **Volume**: Stable buying volume suggests sustained interest, but a drop could signal consolidation.
---
### **5. Potential Scenarios**
- **Bullish Case**: Break above **$109,870** → Rally toward **$114,950-$116,000**.
- **Bearish Case**: Rejection at resistance → Drop to **$105,300-$103,900**.

BTC/USD Multi-Timeframe Analysis – 1H & 5m🕐 1-Hour Overview:
BTC is currently consolidating inside a range-bound structure, showing signs of indecision.
Resistance Zone: $105,000 – $106,000
Support Zone: $100,000 – $101,000
The price must break out of this box to define the next major direction.
➡️ A bullish breakout above 106K could lead to $108K+
⬅️ A breakdown below 100K may trigger downside momentum.
⏱ 5-Minute Execution Zone:
The 5m chart shows a rebound from an oversold move, forming higher lows and approaching key resistance.
Minor Resistance: $107,000
Key Breakout Level: $107,400
🎯 Trading Scenario:
If we get a strong bullish candle closing above $107,400
Then: Entry Long with target near $108,000
Stop Loss: Below recent 5m low – around $106,800
✅ Strategy Context:
Timeframe alignment between HTF and LTF
Scalp entry with confirmation
Risk managed around structural zones
🔗 Powered by ALIP FX
📌 Follow for more ideas, and smart scalping setups
#Bitcoin #BTCUSD #Scalping #PriceAction #ALIPFX

BTC Weekly Analysis : Rise or Fall ? Let's SeeBy analyzing the #Bitcoin chart on the weekly timeframe, we can see that last week’s candle closed at $108,350, and BTC is currently trading around $107,500. If the price manages to hold above $105,700, we could expect further upside momentum. The next potential bullish targets are $111,700, $124,000, and $131,800.
So far, this analysis has yielded over 9% return, and we’ll be sharing more updates soon from lower timeframes!
🎥 If you enjoyed this video analysis and found it helpful, please show your support with a LIKE and COMMENT below!
These video-style breakdowns take time and effort, and I’ll only continue them with your support 🙌
Your engagement is my biggest motivation to keep going 💛
Thanks for being part of the journey!

BTCUSDTCryptocurrency Futures Market Disclaimer 🚨🚨🚨
Trading cryptocurrency futures involves high risks and is not suitable for all investors.
Cryptocurrency prices are highly volatile, which can lead to significant gains or losses in a short period.
Before engaging in crypto futures trading, consider your risk tolerance, experience, and financial situation.
Risk of Loss: You may lose more than your initial capital due to the leveraged nature of futures. You are fully responsible for any losses incurred.
Market Volatility: Crypto prices can fluctuate significantly due to factors such as market sentiment, regulations, or unforeseen events.
Leverage Risk: The use of leverage can amplify profits but also increases the risk of total loss.
Regulatory Uncertainty: Regulations related to cryptocurrencies vary by jurisdiction and may change, affecting the value or legality of trading.
Technical Risks: Platform disruptions, hacking, or technical issues may result in losses.
This information is not financial, investment, or trading advice. Consult a professional financial advisor before making decisions. We are not liable for any losses or damages arising from cryptocurrency futures trading.
Note: Ensure compliance with local regulations regarding cryptocurrency trading in your region.
thanks for like and follow @ydnldn to have more information outlook and free signal.
About me :
"I am a passionate swing trader focused on analyzing financial markets to capture profit opportunities from medium-term price movements. With a disciplined approach and in-depth technical analysis, I concentrate on identifying trends, support-resistance levels, and price patterns to make informed trading decisions. I prioritize strict risk management to protect capital while maximizing profit potential. Always learning and adapting to market dynamics, I enjoy the process of refining strategies to achieve consistency in trading."
