BTC LETS RETRY AGAINBINANCE:BTCUSDT.P Is gathering Bullish momentum again to try going war against that resistance. On this short video, i explained the reason why im looking to buy btc, Both entry and exist are on the video. Good luck to us all.
BTCUSDT.5L trade ideas

waiting for new ATH this week , btc💎 BTC PLAN UPDATE FOR THE BEGINNING OF THE WEEK (07/07)
NOTABLE BITCOIN NEWS: Focus on 4 key points today
1. Elon Musk – “America Party” to Support Bitcoin
Elon Musk has confirmed that his newly formed political party, the “America Party,” will support Bitcoin, stating that “fiat is hopeless.”
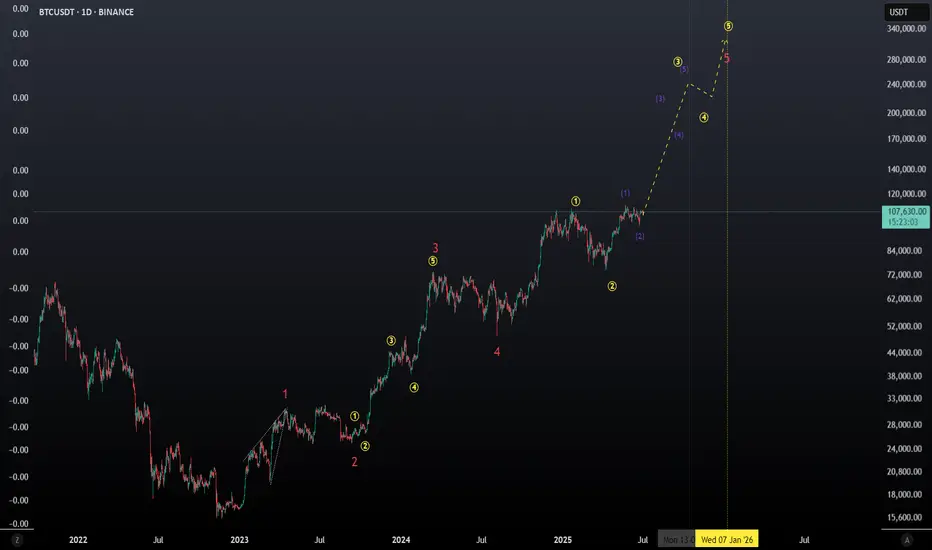
2. Cup-and-Handle Pattern Analysis: Targeting $230K
According to technical analysis by Cointelegraph, BTC is forming a “cup and handle” pattern on the monthly chart, which could lead to a target peak of $230,000 if a breakout continues.
3. BTC Price Holds Steady Around $109K Amid “Crypto Week” and Trade Tensions
Bitcoin is currently trading around $109,000, influenced by “Crypto Week” and concerns over U.S. tariffs.
4. Institutional Inflows Increase, But Market Demand Weakens
According to CoinDesk, institutional investors are still buying BTC, but not enough to offset declining demand in the spot market, negatively affecting short-term market sentiment.
⸻
TECHNICAL ANALYSIS PERSPECTIVE
The short-term trend remains bullish. However, the steep slope of the trend indicates buying pressure is still being contested and unstable.
BTC remains stuck at Fibonacci levels—pay close attention to the resistance zones at 112K and 115K. If these two resistance levels are broken, investors may get the answer to whether BTC can approach the 120K level.
In the short term, both gold and BTC are moving sideways, indicating that market liquidity and investor capital are unstable and being divided across multiple portfolios.
==> This analysis is for reference only. Wishing all investors successful trading!

BTC bullish sentiment and All time highs?BTC is printing a good structure and characteristics resembling the highs of 2021. 2025 is the only bullish year left before BTC crashes again.
Usually BTC is bullish in the end of the year. This OCT/NOV could print 130K-136k for btc before a fatal crash

BTC/USDT Back Test Perhaps it's not surprising to say that I see a chance to put the $99,000 zone back in the test. Just because of the FVG. Even if it doesn't happen, I see an upward trend now.

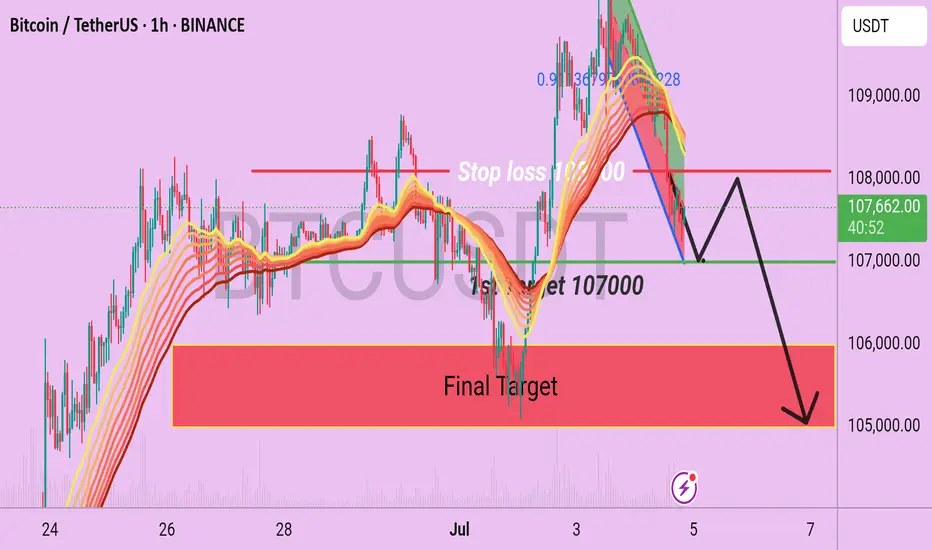
BTC/USDT H1 Chart Out look Bitcoin is Now running at near the 107500 and following a short term Bearish pattern on EMA 50 and 200 by using that we can consider on sell side with the given Targets like 107000 which is near the Bitcoin is consolidating and the Final target support is 106000/105000.
Bearish Scenario
1st Target is 107000 ( from here it may make some retest)
2nd Target is 106000( main target).
3rd Target is 105000.
Use stop loss at 108100.
BITCOINTHE pullback into structure will be watched ,if the daily candle gets rejects on the daily trendline, then the buy holds .if they fail then the daily cross supply roof will send price tanking
the price action is playing a quick one ,technically i wasn't expecting a break of 4hr demand descending trendline line acting as support floor. patience is key, allow the daily candle to close for clear directional bias..
the uptrend future will lie on daily candle close and the weekly candle close will be the final verdict.
trading is 100% educated probability, so don't take personal, even when your analysis are wrong ,accept it and try again.
overall, resilience and consistency are what will distinguish you from other traders.
do have a happy blessed weekend.
we coming new week on money and winnings .
#btc #bitcoin #gold #silver #copper

BITCOIN TWO LONG TRADE SETUPS Two potential long trades for Bitcoin are mentioned.
Each trade has an entry point, profit target, and stop loss.
A bullish divergence in the 24-minute time frame is recommended before making the trade.

BTCUSDTTHE current breakout from our 4hour channel signifies the presence of liquidity and a buy into 115k
with dollar index dropping ,NOW 108K broken,wait for retest ,buy and hold into 115k-118k supply roof.
#BTC #BITCOIN

BTC weekly price predictionthis is my personal idea and analysis and i dont follow any other one analysis

BTC Weekly Analysis : Rise or Fall ? Let's SeeBy analyzing the #Bitcoin chart on the weekly timeframe, we can see that last week’s candle closed at $108,350, and BTC is currently trading around $107,500. If the price manages to hold above $105,700, we could expect further upside momentum. The next potential bullish targets are $111,700, $124,000, and $131,800.
So far, this analysis has yielded over 9% return, and we’ll be sharing more updates soon from lower timeframes!
🎥 If you enjoyed this video analysis and found it helpful, please show your support with a LIKE and COMMENT below!
These video-style breakdowns take time and effort, and I’ll only continue them with your support 🙌
Your engagement is my biggest motivation to keep going 💛
Thanks for being part of the journey!

$BTC Outlook Macro These next few months are mega bullish.
Expecting a big move upwards + an altseason.
Bitcoin (BTC): Bullish as Long as Buyers Hold EMAs | $112K Next?Bitcoin buyers have taken full control since bouncing from EMAs on the 2nd of July (where also our entry point was sitting last week).
Since then we have seen decent buyside dominance and we are looking for further pressure from buyers, which would result in a retest of the current ATH area, but keep in mind—we are in a very dangerous zone (near a new ATH where buyers are still showing dominance which is giving us a sign that this is not yet the full potential of the coin).
We are bullish as long as we are above the EMAs!
Swallow Academy

BTC SCALP TRADE / Long Setupwait for the entry, must use SL. If final tp is achieved then trade is not valid, active till final tp. Must use proper risk management. Expecting upside move. If SL hit then take previous trade, It's still valid.

btc/usdtI think it's time for Bitcoin to grow. It doesn't matter what the news is. This time, Bitcoin and Tether's dominance have reached their peak and are ready to make Bitcoin grow. This is my analysis. What do you think?

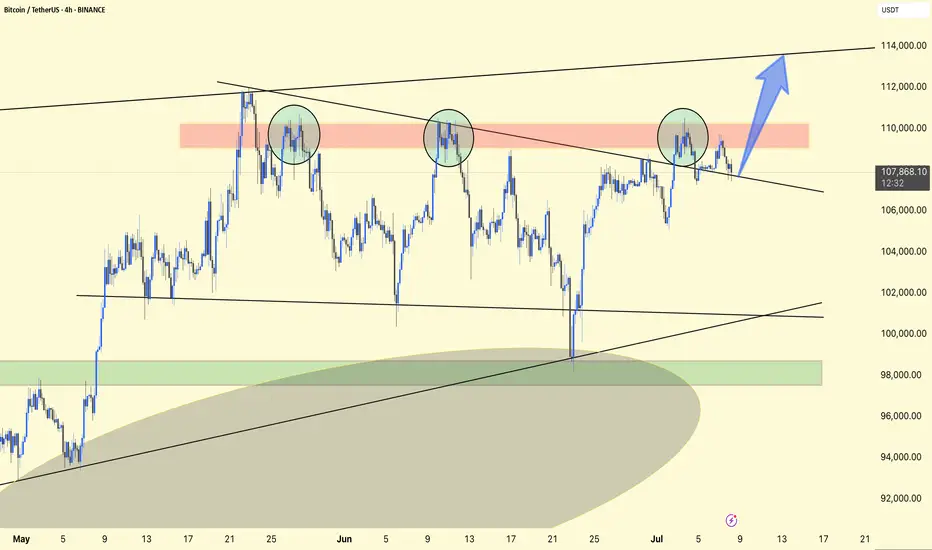
BTCUSDT 4H Analysis
BTC is consolidating below the key resistance zone highlighted in red (~$109,000–$110,000).
The price continues to form higher lows, showing bullish pressure despite rejection in the red zone.
The structure resembles an ascending triangle, indicating a potential breakout.
Upside Target: ~$113,500–$114,000 if the price moves above ~$110,000 with strong volumes.
Support Zone: ~$106,000–$106,300 must hold to keep the bullish scenario intact.
If the support breaks, the price could retest ~$102,000–$103,000.
Small Insights: Repeated retests of resistance suggest that bulls are absorbing supply. A strong push above the red zone could trigger a short squeeze.
Stay alert!
BTCUSDT Forming Bullish WaveBTCUSDT is currently setting up a promising bullish wave pattern, showing signs of steady upward momentum that could deliver a healthy 10% to 20% gain in the near term. After a period of consolidation and healthy correction, Bitcoin’s price is starting to push above key resistance levels, indicating strong buying interest and renewed confidence among long-term investors and institutional traders alike. This setup has caught the attention of market participants looking to capitalize on Bitcoin’s next potential leg up.
Recent on-chain data and technical indicators show a robust foundation for this bullish wave pattern, with increasing trading volume supporting the upward move. Bitcoin continues to hold above crucial support zones, which adds further confidence for buyers aiming to ride the trend towards its next major psychological levels. The overall sentiment remains positive as Bitcoin’s dominance in the crypto market signals strength, helping to drive capital inflow from altcoins back into the king of crypto.
As we know, Bitcoin’s market behavior often sets the tone for the entire crypto ecosystem, so this bullish scenario could spill over into other major altcoins as well. Traders and investors should keep an eye on key resistance zones, potential breakout levels, and any sudden surges in volume that confirm the wave pattern is playing out as expected. Patience and disciplined risk management will be essential to maximizing profits during this phase.
✅ Show your support by hitting the like button and
✅ Leaving a comment below! (What is You opinion about this Coin)
Your feedback and engagement keep me inspired to share more insightful market analysis with you!

Bullish?This range looks like it wants to break to the upside. Maybe one more drop to 107.6K as a fakeout — but that remains to be seen.

$BTC/USDT Eyes $121KCRYPTOCAP:BTC has broken out of the descending wedge and is holding above key support around $106K.
The structure looks bullish with a potential move toward $121K (+11.24%).
As long as the price stays above the breakout zone, momentum favors the bulls.
DYOR, NFA

#BTC Update #2 – July 5, 2025🟠 #BTC Update #2 – July 5, 2025
I still see $112,000 as Bitcoin’s next major target. That said, the $110,000 zone continues to offer strong resistance, and price hasn’t managed to break through it with conviction yet.
If BTC can’t clear $110K with momentum, I expect a potential pullback. For now, I consider price action to be stuck in a decision zone. Without a clean breakout above $110K, I wouldn’t be surprised to see a deeper correction before any meaningful upside continues.

BTC vs DXY – Macro Setup at a Crossroads
Looking at BTC and DXY on the weekly, we’ve seen 3 key periods so far. In the first two, the pattern was clear: BTC went up, DXY went down.
Now we’re in the third period: what’s next?
👉 Has the move already played out?
👉 Is it happening now?
👉 Has DXY bottomed and BTC topped, or will DXY go lower while BTC climbs?
Macro conditions may help guide us.
BTC looks strong — supported by ETF inflows, on-chain strength, and institutional demand.
DXY looks weak — with softer economic data and rising expectations for rate cuts.
In my view, tariffs are likely to weigh heavier on DXY than BTC, favoring more upside for BTC.
The recent Big Beautiful Bill could also add fuel to BTC while adding pressure on DXY.
Always take profits and manage risk.
Interaction is welcome.

BITCOIN TOUCHED 110K — THEN REJECTEDNot what bulls wanted to see.
With massive gaps below, this kind of price action ain’t it.

As simple as it gets - Short then longDescending channel, posible scalping trades ahead before support confirmation at 98,000-100,000. Once confirmed, I would expect a nice bullish swing towards breakout. What do you all think?

Long opportunity in BTC/USDT.PSThe 107963.44 level has already been broken. So we need to wait to retest the same level.
Reasons : -
1. 30 MIN BOS Breakout.
2. it retested the fibonocci 0.611 level.
Entry : 107963.44
TP : 109065.90
SL : 107415.57
Disclaimer : I'm not recommending to take this entry. Do with your analysis too.
