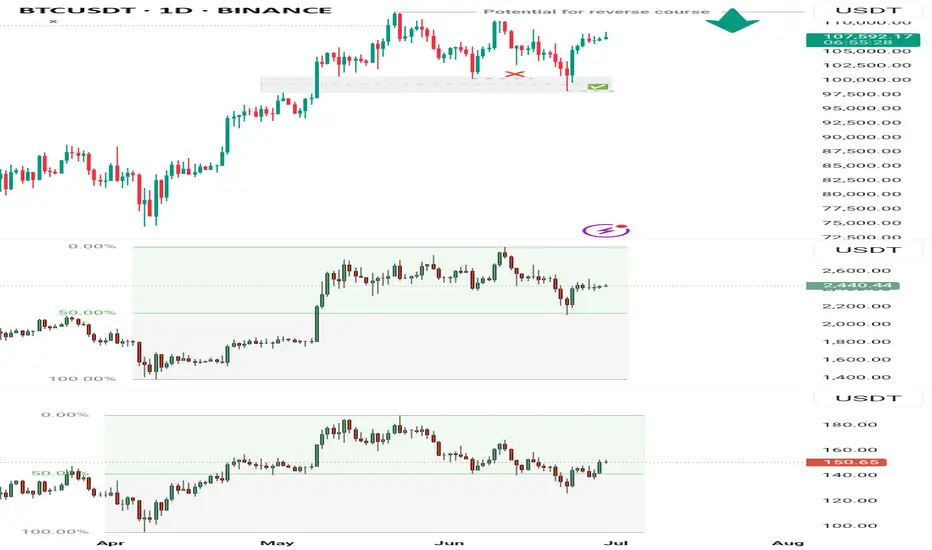
BTCUSDT: Bounce Incoming?BTCUSDT Technical analysis update
-March 2024 resistance is now expected to act as a strong support level.
-The price has touched the 0.618 Fibonacci retracement level, suggesting a potential reversal from this zone.
-The 200 EMA on the 2-day chart is positioned as a strong dynamic support, reinforcing the bullish case.
We can expect a bounce from the $72-75k level.
BTCUSDT.5L trade ideas

Bitcoin at Risk: Will Geopolitical Tensions Push BTC Below $90K?By analyzing the #Bitcoin chart on the weekly timeframe, we can see that the price continued its correction amid rising tensions and conflict between Iran and Israel, dropping to as low as $98,000. Currently, Bitcoin is trading around $101,000, and if these tensions escalate further — especially if Iran decides to close the Strait of Hormuz — it could significantly impact global markets, and Bitcoin would not be an exception.
If BTC fails to hold above $100,000 by the end of the week, a continuation of the drop toward $90,000 is possible.
Please support me with your likes and comments to motivate me to share more analysis with you and share your opinion about the possible trend of this chart with me !
Best Regards , Arman Shaban

How to Tell BITCOIN is BULLISH using MOVING AVERAGES OnlyBTC is trading sideways and it sparks a lot of debate whether or not we are at the beginning of a new bearish cycle, or if there is still a push upwards waiting to happen.
Here's how you can use the Moving Averages to determine whether or not BTC is bullish.
Don't miss this update on my stance on the market and why I think ALT Season is waiting:
______________________
BINANCE:BTCUSDT

Bitcoin Weekly, Not Good But... Opportunities AboundI cannot say about the weekly timeframe the same I said for the daily, the situation here is different. The chart looks bad. The weekly close changes nothing.
If Bitcoin moves and closes weekly above $106,000, this can be good news, but any trading below this level has bearish potential. It can be a period of bullish consolidation but the bearish potential cannot be ignored. So, I will keep it short. Bitcoin remains in doubt on the weekly timeframe.
Bullish above $100,000. Bearish below $100,000.
It has been six weeks with Bitcoin moving with basically no change.
Last week's action did produce some loses for some traders, but for us the market remains the same. We focus on the altcoins, ignore Bitcoin for now, there is no growth and the action is still happening near resistance; at short-term support but overall, closer to a top than a bottom. It is risky to say the least. Many altcoins are trading at bottom prices and growing strong. We go for the low risk vs high potential for reward chart setups. We don't mind the market shaking, evolving or reacting to some geopolitical event, we do care about making the right choices... Focus on the altcoins for now, and for long...
Hold on. I shall give you more information.
Bearish action is indeed present but still weak.
Bearish volume is very low.
The fact that more than 1B worth of leveraged positions were liquidated calls for a pause. Each and every time this amount of money is taken out of peoples hands and transferred to the exchanges, the market changes direction. Regardless of the signals, the bigger picture or the long-term. This is a huge transfer, the whales are getting richer, retail is getting rekt.
So, the market is likely to shake some more. This is only because Bitcoin is trading way too high and hasn't produced any significant retrace after considerable growth. Again, we buy those trading low near support. We sell those trading high near resistance. As long as this is the MO, we are sure to win in the long-run.
I wouldn't want to buy-long a project that is crashing when there are others growing, yet to grow and with huge potential for growth.
Remember, the market is big now, Bitcoin is very strong above 100K. It can happen that Bitcoin goes on a retrace while the altcoins move ahead. Money flowing out of the big projects reaches the smaller projects, classic bull market dynamic. Nothing surprising; opportunities are endless.
Thanks a lot for your continued support.
Namaste.

Bitcoin Weekly Ultra-BearishThe 100K support is still valid but the weekly timeframe chart isn't looking good.
Good afternoon my fellow Cryptocurrency trader, how are you feeling today?
Bitcoin peaked the week 19-May. Then we have bearish action only.
The week after 19-May was red, then two neutral weeks and a continuation this week. It looks pretty bad right now, terrible to be honest.
» The main support range sits between $82,500 and $88,888.
Thank you for reading.
This support zone will only become active is 100K breaks on the weekly timeframe.
Namaste.

BTCUSDT Market Outlook (Daily Chart)BTC’s failure to rally into a new all-time high (ATH) from the June 5th low can be attributed to the fact that price wasn't coming from a true discount zone. Similarly, key correlated assets like ETH and SOL also hadn’t reached their respective discount levels at that point. This misalignment created an unbalanced market structure, which necessitated a corrective move to realign broader market pricing.
Now that both ETH and SOL have tapped into their discount zones and shown signs of recovery, the conditions are more technically sound to project a potential ATH for BTC in the coming weeks or month. However, on a broader scale, this current rally could serve as a liquidity trap — drawing buyers into a high before distribution.
As for now, any sudden price drop should be seen as a potential buying opportunity into the anticipated new ATH. But caution remains key — any strong sell signal or reversal confirmation near the ATH zone could trigger a significant selloff as sellers regain control.
BTC/USDT, 4H chart, Futures - Bullish projection.The price is expected to consume time in its SQZ and take liquidity at the bottom of the range to make decisions... to UP

BTCUSDT – Rebound from trendline, targeting 115,300On the daily chart, BTCUSDT has bounced from a confluence support zone around 105,200, where the rising trendline meets the FVG, confirming that the bullish structure remains intact. The current price pattern suggests a continuation of the uptrend, with a short-term target at the 115,300 resistance zone — a level that has previously rejected price multiple times.
If this level is broken, momentum could extend toward the 120,000 area in the medium term. As long as the price holds above the trendline, the bullish outlook remains valid.
On the news front, market sentiment is improving as Bitcoin spot ETFs in the U.S. show signs of renewed inflows, coupled with growing expectations that the Fed might pause rate hikes due to recent signs of economic weakness.

Bitcoin Completely Transformed Into a Bearish SetupBTC Completely Transformed Into a Bearish Setup
Since last week, BTC and most of the Alcoins have changed their direction from clearly rising to falling.
The reason why this happened is another topic, because it is never a clear reason, but it happens.
If the price is going to respect this falling pattern, BTC should easily fall to 97800 and 94500, otherwise it may transform and change its appearance again.
It is difficult to understand whether BTC has ended the uptrend so far and the downtrend has begun.
Or if we are in a larger bullish correction.
However, with the current data, it is only falling.
You may find more details in the chart!
Thank you and Good Luck!
❤️PS: Please support with a like or comment if you find this analysis useful for your trading day❤️

BitSupport and resistance levels are identified on the one-hour timeframe, and the momentum increases in either direction when broken.

BTC TIME TO HEAD SOUTH BTC has given a CHOCH
Proper risk management
Sit tight as we ride to 102634.59 region.

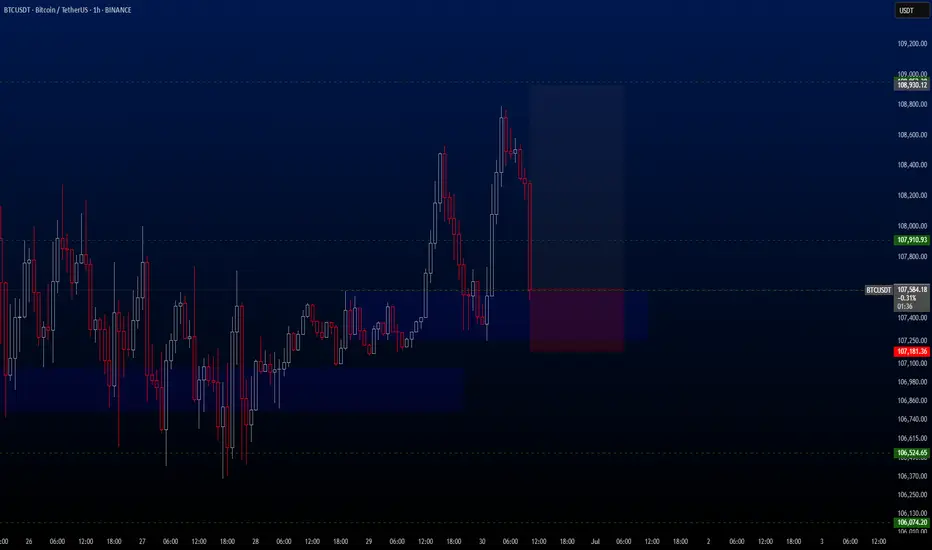
BTCUSDT Hello traders. Wishing you a great start to the week!
This week’s first trade opportunity comes from the BTCUSDT pair. Over the weekend, the pair showed significant volatility, dropping from 108,776 to 107,565 in just a few hours. However, I see this drop as a potential buying opportunity.
In my view, the price is likely to bounce back towards the 108,930.12 level in the short term. Therefore, I’ve activated the trade and I’m sharing the details with you below:
🔍 Trade Details
✔️ Timeframe: 1-Hour (H1)
✔️ Risk-to-Reward Ratio: 1:3.20
✔️ Trade Direction: Buy
✔️ Entry Price: 107,590.73
✔️ Take Profit: 108,930.12
✔️ Stop Loss: 107,181.36
🕒 If momentum weakens or price consolidates in a tight range, I will keep this trade open only until 23:00 (UTC+4). After that, I’ll manually close it—whether in profit or loss—based on how price action evolves.
🔔 Disclaimer: This is not financial advice. I’m simply sharing a trade I’ve taken based on my personal trading system, strictly for educational and illustrative purposes.
📌 Interested in a systematic, data-driven trading approach?
💡 Follow the page and turn on notifications to stay updated on future trade setups and advanced market insights.
BTC shorting opportunity comes againBTC climbed above 108000 again, and the short-term bullish power was slightly stronger. According to the current strength, BTC still has room for growth, but it is still under pressure in the 109000-110000 area in the short term; if there is no major positive news, BTC may find it difficult to break through the resistance area in the short term under the current conditions, and may even experience stagflation and retreat again after approaching the resistance area.
Therefore, I think shorting BTC with the help of the resistance area is still the first choice for short-term trading. We can boldly short BTC in the 108500-109500 area and look towards the target area around 106000 again.

BTC Short Swing Ideaswill be shot on bearish mode to btc with simple indicator, sign on major rejection trend within hourly timeframe and will targeting the next possible retracement at nearest support box. DYOR.
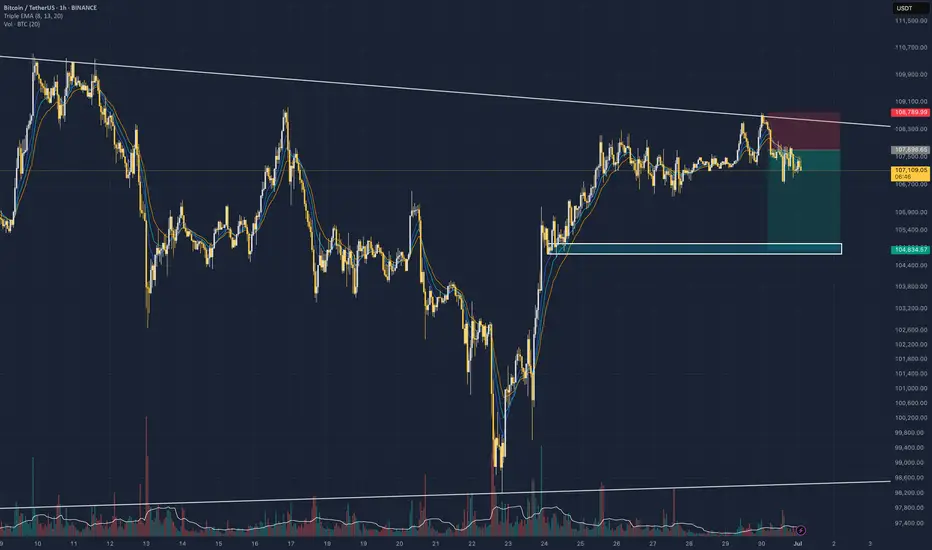
Bitcoin - Weekend OutlookCRYPTOCAP:BTC | 6h
Bitcoin is compressing below its all-time high, with 108k as the local resistance that must be reclaimed for a bullish continuation to retest the highs.
I expect the price to clear some poor highs around 108.8k–109.6k before taking out the bad lows around 106.3k-105.4k
As long as we hold above 104k , I believe we’re in a strong position and expect we will retest the highs.
However, losing the 103k support level would be concerning.

HolderStat┆BTCUSD forming the triangleBINANCE:BTCUSDT has reclaimed the $106,000 support and broken out of a triangle structure. The path now leads toward 111K, a major resistance zone. Similar setups have triggered strong rallies before, and bulls are defending levels aggressively.

BTC LONG TRADE BTC LONG TRADE
ENTRY : 106398.1
PROFIT : 107512.7
STOP : 106028.8
ALL trading ideas have entry point + stop loss + take profit + Risk level.
hello Traders, here is the full analysis for this pair, let me know in the comment section below if you have any questions, the entry will be taken only if all rules of the strategies will be satisfied. I suggest you keep this pair on your watchlist and see if the rules of your strategy are satisfied. Please also refer to the Important Risk Notice linked below.
Disclaimer

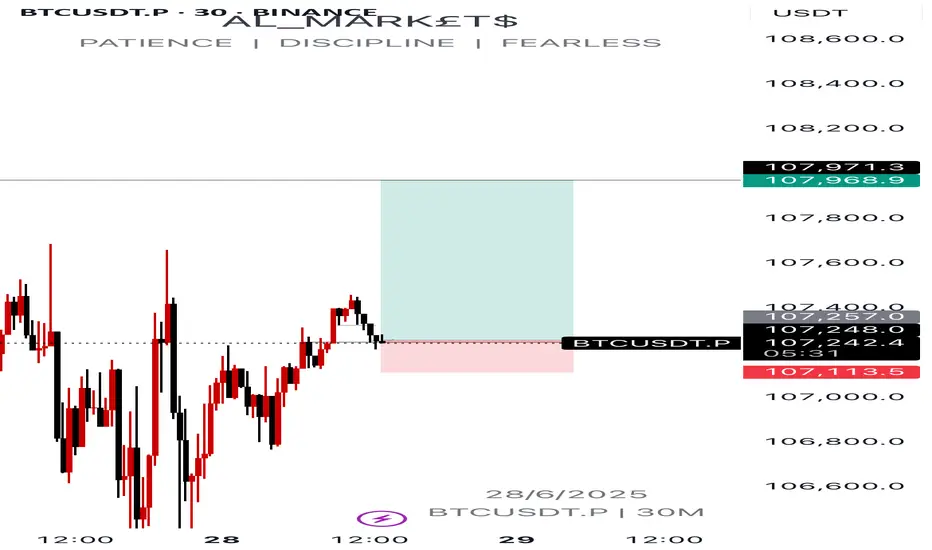
BTCUSDT.P potential short term buysCurrent price action is pointing out to potential short term buys on btc.
BTCUSDTHi snipers. On the one-day timeframe, we are witnessing the formation of a harmonic pattern called a flag. This pattern usually forms in the middle of a trend and then the previous trend continues. The flag consists of two parts: a bar and a flag. In the flag, the price is moving in a channel between two parallel lines. If the price breaks through and crosses the upper ceiling of the channel, we will probably reach new prices. I am practicing and learning. This is not a buy or sell offer.

Called The Bottom GuysThem: "How did you call the start of the Rally?"
Me: ...
#crypto #bitcoin #trading #portfolio
BTCUSDT: Bullish Outlook Following Liquidity Sweepnavigating around pivotal areas defined by Breaker Blocks (BB) and Fair Value Gaps (FVG) on both the 1-hour and 2-hour charts. These zones represent high-probability areas for market reactions, whether as support for continuation or as points for potential short-term retracement before a larger rally.
strongly favors a bullish continuation for BTC. monitor interactions with the identified BB/FVG zones for optimal entry points, anticipating a potential dip to sweep short-term BSL or mitigate imbalances before the next significant leg up.

Bitcoin (BTCUSDT) Market Update – DailyBitcoin remains in a tight range between $110,221.73 (resistance) and $101,546.27 (support). These two levels are the main reference points for initiating high-probability trades.
🔸 Market Context:
The primary trend is bullish, so the priority remains on long setups.
Short positions should only be considered below $101,546.27 with confirmation.
With the prevailing bullish structure, early entries can be taken with a low-risk trigger at $108,746.08.
🔸 Moving Averages & Momentum:
The SMA 7 has caught up with the daily candles, but we haven’t seen a strong reaction yet.
If today's candle wicks above the SMA 7, we can more confidently pursue long setups starting tomorrow.
Otherwise, we may see a pullback toward the SMA 25, especially given the decreasing volume typical of ranging phases.
🔸 Lower Timeframe Setup (1H/4H):
A micro range box can be observed between $108,746 and $106,649.78.
If price approaches $108,746 with increasing volume, that can serve as a valid long trigger on intraday timeframes.
⏳ Final Note: Patience is key while BTC trades inside this range. The bullish structure remains intact, and opportunities for long trades are more favorable for now. Wait for clean breakouts or volume-based confirmations before entering new trades.
#BTCUSDT #BitcoinAnalysis #CryptoUpdate #BTCPrice #CryptoStrategy #BitcoinRange #LongSetup #TechnicalAnalysis #TradingView

MONDAY - TRADE OF THE DAYFew nice plays over the weekend shame I am not active on weekends.
I will be posting a video later today so see you in class!
