BTC — Chop → Range Low Sweep → Range High1. Watch for push to range mids (119.4–121.3)
2. Anticipate move back to range low (115,750) — buy zone
3. Target range high (125,000) after sweep
If no sweep to RL — scenario invalid
BTCUSDT.P trade ideas


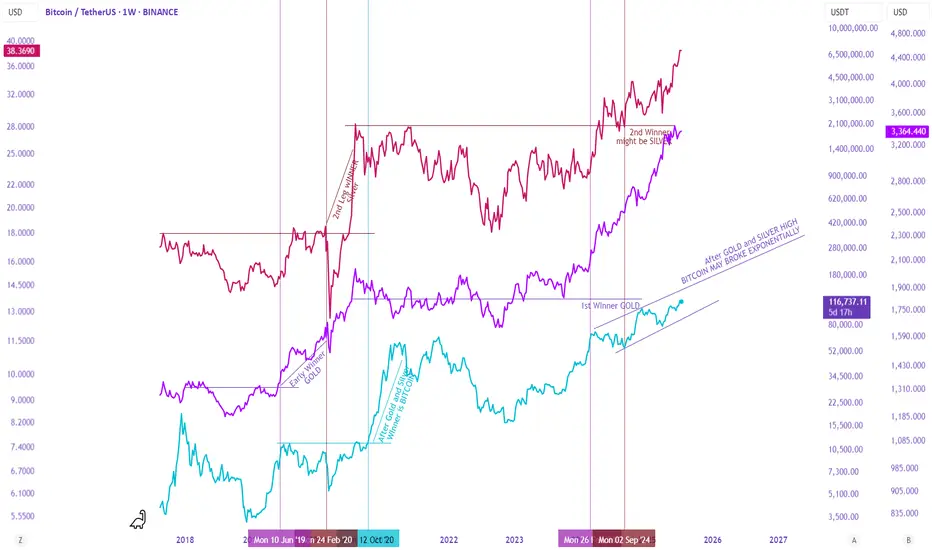
Gold, Silver, and Bitcoin – A Staggered Anti-Currency Rotation?There seems to be a complex yet recurring relationship between Gold, Silver, and Bitcoin during anti-currency phases (when fiat weakens).
First Leg – Gold Leads
Gold typically leads the first leg, breaking out to new highs. Silver follows but lags—trending up without breaking major resistance. During this phase, the Gold/Silver ratio expands.
Second Leg – Silver Takes Over
Eventually, Silver breaks resistance and becomes the second leg leader. As it outperforms Gold, the Gold/Silver ratio contracts back to mean.
Bitcoin, during this time, is usually bottoming or entering Stage 2 (early uptrend). This time, it has already broken resistance but is rising slower than in past cycles.
Third Leg – Bitcoin Dominates
As Gold and Silver peak and begin to correct, Bitcoin accelerates, often making new all-time highs (ATH).
This staggered rotation played out during the 2018–2022 cycle. Let's see if history rhymes in this cycle.
BTCUSDTmy entry on this trade idea is taken from a point of interest below an inducement (X).. I extended my stoploss area to cover for the whole swing as price can target the liquidity there before going as I anticipate.. just a trade idea, not financial advise
Entry; $113312.6
Take Profit; $117985.3
Stop Loss; $112314.0

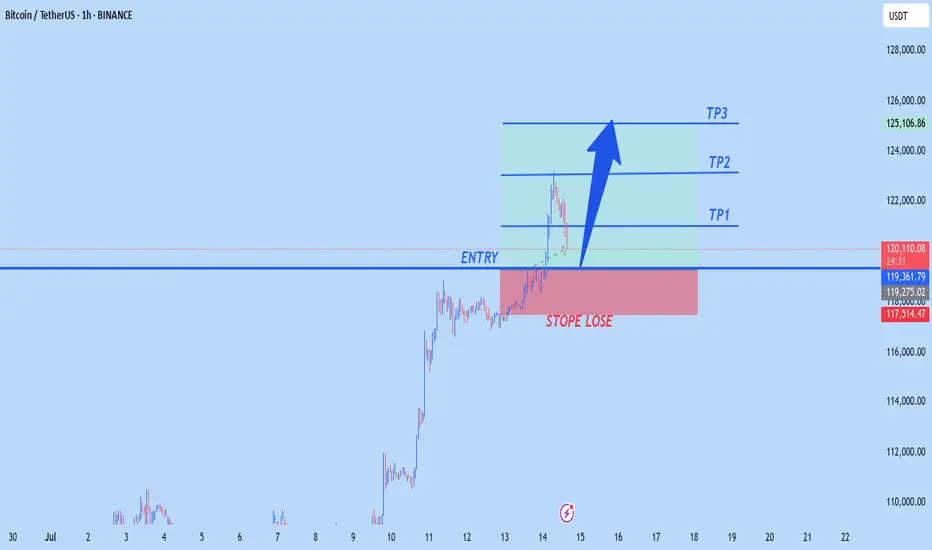
BTCUSD NEW OUTLOOKBtc buy from 119,000
TP1 122,000
Tp2 123,000
Tp3 125,000
STOPE LOSE 117,500
Trade at your own risk
2 RRBitcoin has risen significantly, if it retraces some it will likely stop at the indicated range. Target will need to be selected after the entry based on the development of the chart.
BTCUSDT – Market Update & RecommendationBTCUSDT – Market Update & Recommendation
In my previous analysis published on June 1, 2025 (TradingView), I mentioned the corrective pullback towards the $100k area before BTC resumed its next upward wave.
My latest evaluation (posted recently on my personal blog, linked in my TradingView signature) stated clearly that BTC would rise toward $110k, then experience a minor retracement to around $108.2k before consolidating and reaching new ATH between $118k–$125k.
At present, BTC has successfully touched the $118k mark and is undergoing a minor correction—this is a critical consolidation phase before price approaches the significant $125k distribution zone.
Recommendation:
Investors holding BTC purchased below $108k should closely monitor price action to secure profits as necessary.
Consider signals for potential Swing Short positions based on monthly (M) timeframe bottoms. This is a powerful and extended signal, potentially lasting until the end of 2025.
Caution is advised for any new BTCUSDT positions at this time.
Link:

Bitcoin is bullish in world of War or Peace Simple and easy it is like Gold but better version and limited edition one.
Both(BTC & XAU) are bullish most of the time because future is not for Paper Tokens like Dollar or Yuan or Ruble or Euro or ..
Currency of strong countries seems interesting But soon with more laws and Taxes and Rules against each other Economic which USA start it, more and more Trades and things are going to take place in Crypto where the money is still non Trackable or it is tax free.
Also in a world of War as i mentioned in previous Analysis too, more Buys and Sells are going to take place via Crypto instead of countries currency.
Some countries Now are buying and selling weapons from their enemies even and it is possible in Crypto which no one judge or find the transactions.
interesting things which can not all written here are now need Crypto more than ever.
These prices are like a joke and soon maybe with or without some stop loss hunting to the downside and kicking out buyers with leverage market of Crypto will face another Huge gain.
DISCLAIMER: ((trade based on your own decision))
<<press like👍 if you enjoy💚

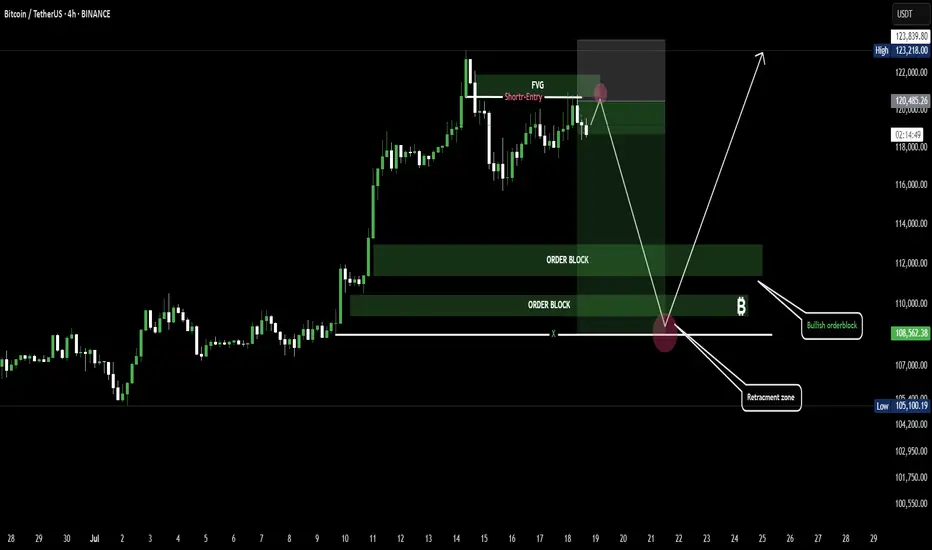
BTC Retracement Loading.....Bullish Bounce Ahead?Bitcoin is showing signs of a short-term pullback after tapping into a Fair Value Gap (FVG) zone, triggering a potential short setup. Price is likely to retrace toward the bullish order block and retracement zone around 105,000–110,000. If that area holds, we could see a strong bounce back toward the 123,000 level.
Short-term BITCOIN analysisShor-term
In my opinion, Bitcoin could make a move towards $113,000-115,000 and then start moving upwards. In any case, according to previous analysis and apart from short-term fluctuations, it could touch the target of $140,000-150,000.
Good luck
NEoWave Chart

Bitcoin is ULTRA MEGA Bullish!See the trend lines and fib levels for your resistance and support levels. It's great that Bitcoin is breaking through the blue trend line on top. If it chops sideways here for a while at this level, this will serve as a strong new support level for bitcoin when it comes back down in Q4.
I believe $130k is the lowest potential target for bitcoins ATH this cycle. Until that level is approaching, I'm ultra mega bullish and trading altcoins with leverage. USDT Dominance and BTC Dominance are in free fall right now so altcoins are pumping hard while bitcoin chills at the resistance levels.

BTSI signals high riskThe BTSI has signaled a high risk area for BTC. These can happen and price can still go up for a while until a bear deviation. The bars pattern is what happened the last time.

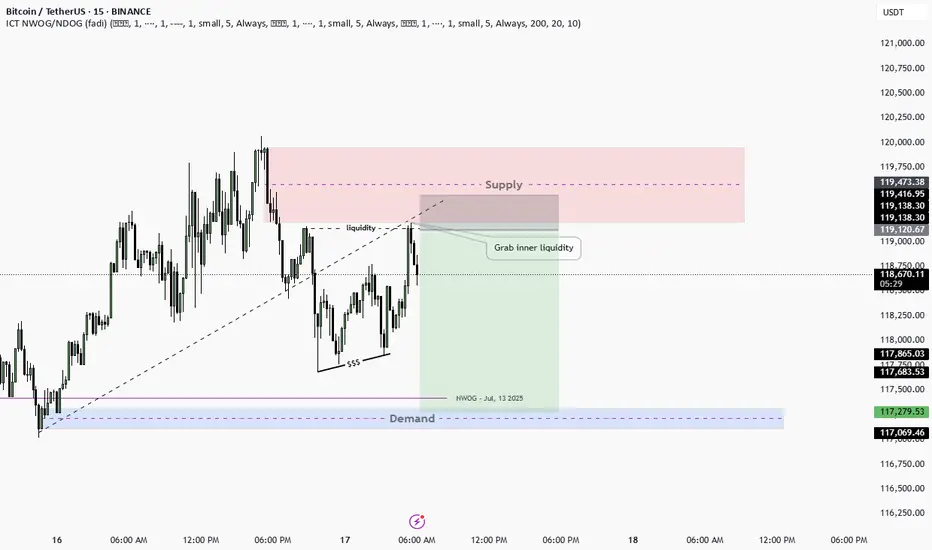
Daily Pan Trade NO.1SMC concept that actually work really nice after we take inner liquidity we going for demand zone
Bitcoin Full analysis: Buy the dip confirmed, 123240 key__________________________________________________________________________________
Technical Overview – Summary Points
__________________________________________________________________________________
Momentum: Very bullish across all timeframes; healthy compression above previous range.
Key Supports: 115731–110481 USDT (structural, 1D to 1H).
Major Resistances: 123240 USDT (multi-frame pivot).
Volume: Normal, no climax or distribution — flows support the dominant bias.
Risk On / Risk Off Indicator: Strong bullish HLTF signal; short-term neutral intraday.
ISPD DIV: Neutral on all timeframes.
Multi-TF Behavior: Bull rally, no excess, no euphoria or capitulation; market holds above key levels.
__________________________________________________________________________________
Strategic Summary
__________________________________________________________________________________
Global Bias: Strong bullish – MT/LT “buy on dips” confirmed.
Opportunities: Progressive buying (117800, 115731 USDT), continuation on breakout >123240.
Risk Zones: Possible pullback if clear rejection below 123240, swing invalidation if close <115731-111949.
Macro Catalysts: Awaiting FOMC late July, short-term volatility limited. Watch geopolitics, extreme compression.
Action Plan: Swing entry: 118300–119000. Stop: 115500. Target: 123200 then 126000+. R/R ≥2.5. Adjust risk management before FOMC.
__________________________________________________________________________________
Multi-Timeframe Analysis
__________________________________________________________________________________
1D: Bullish momentum, supports at 105054/107939–110483. Risk On / Risk Off Indicator strong buy, healthy volume, ISPD neutral.
12H: Consolidation below 123240, aligned supports 110481/115731, healthy structure.
6H: Confirmed momentum, continuous compression, no major sell signals.
4H: Rally structure robust, corrections limited and on support.
2H: Key support band 115731–110481, volume supports rebound, possible rotation below 123240.
1H: Rally confirmed, no panic selling detected.
30min/15min: Intraday consolidation, micro-range below resistance, stable volume, Risk On / Risk Off Indicator short-term neutral.
Cross-TF summary: CLEAR momentum across all frames, no significant divergence, high-quality HTF supports. Next >123240 breakout likely fast and dynamic.
__________________________________________________________________________________
Technical & Fundamental Synthesis
__________________________________________________________________________________
Technical Synthesis: Broad bullish confirmation; buy-the-dip valid on 117800/115731, no aggressive downside signal. Swing positions above 118200 to be favored, expect acceleration after clear break of 123240.
Stops & Invalidation: Swing stops below 115731/111949. Closing below = increased risk, “off” bias.
Fundamentals: Optimal pre-FOMC swing window, US market in wait-and-see mode short term. Neutral/volatile geopolitics, no immediate shocks.
On-chain: Heavy accumulation, historic compression, ETF flows strong (but on short pause). Imminent volatility squeeze possible either way.
Recommendation: Actively monitor 123240 (breakout above), 115731 (below = increased caution). Adjust stops and sizing, remain highly responsive, especially as FOMC approaches.
__________________________________________________________________________________

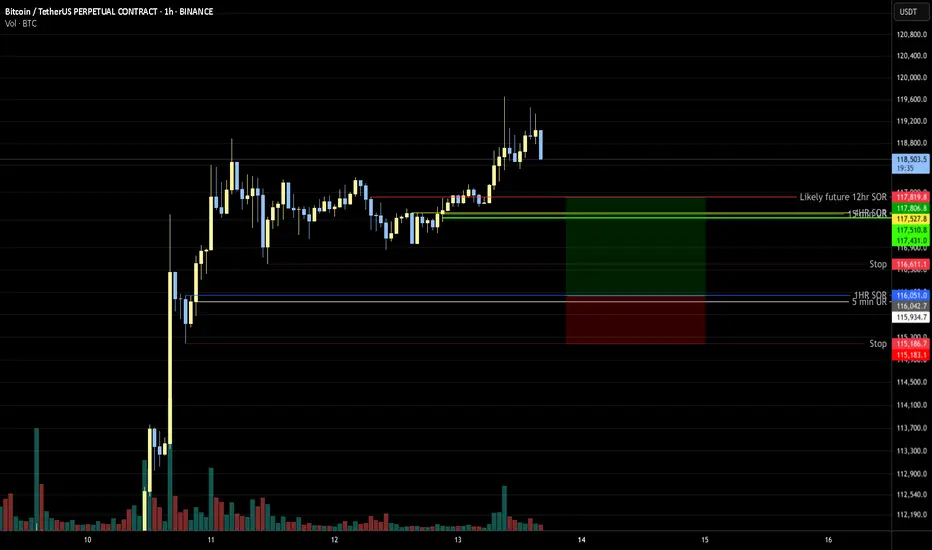
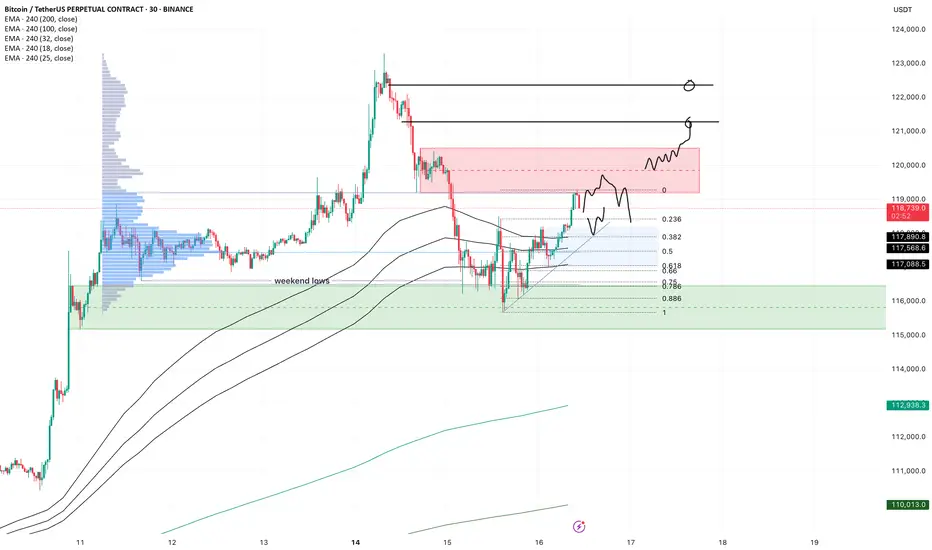
BTC - intradayA lot of volatility, which is nice for trading either way.
The high we set on Monday morning gave a very strong rejection, but in the end we simply took out the weekend lows, then reclaimed and are now grinding higher into the imbalance we left.
Price is now coming into the first resistance, so we watch for either a reversal or see if price keeps grinding through this orderblock, in which case we expect the higher imbalance also to get taken out.
If that happens, I expect a lower high which creates bad highs, then into some ranging price action before we sweep the highs again. (a range trader can dream, rigth?)
For today, look for pullbacks into the blue zone. If the slow grind trend is strong, somewhere between the 0.618 and 0.382 is where I'd expect a reaction if we flush a bit at nyo. We have confluence with H4 trend, trendline, fibs and range poc here.
For now all the m1 lows are holding on low timeframe, I wouldn't get overly bearish or even looking for hedges before that breaks.
If price rejects here and loses the poc, look for a sweep of the lows first. There is a lot of OI build up and I expect some longs to be flushed, but that's no excuse to get bearish at the lows before they break. Just like yesterday, price reclaimed the low immediately, that was your moment to long.
Bitcoin Analysis – 2W Timeframe
📌 As long as price holds above $113K, the trend remains bullish.
🎯 Next targets:
• T1: $151,635
• T2: $175,596
🔍 Any pullback toward $113K is a buying opportunity in a strong uptrend.

Bitcoin Rush: The Carnival and Concerns Behind $120,000Bitcoin Rush: The Carnival and Concerns Behind $120,000
The Bitcoin market is staging an epic rally - the price has broken through the $120,000 mark, setting a new record high. But behind this jubilation, the market has shown signs of overheating.
Market Status: Risks Hidden in the Frenzy
Price Performance: Hit a new high of $123,000 on July 15, up nearly 20% this year, with a total market value of $2.2 trillion (the fifth largest asset in the world)
Market Sentiment: Fear and Greed Index 72 (extreme greed), but more than 100,000 people were liquidated in 24 hours, with a loss of $510 million
Technical Signals: RSI reached 70.9 (overbought zone), and the 30-day unrealized profit and loss ratio reached the 80% percentile
Three major rising engines
Institutional entry
Spot Bitcoin ETF net inflow of $118 million in a single day (BlackRock holds more than 700,000 coins)
MicroStra Tegy's holdings value exceeds $50 billion
Trump Media Group and other listed companies join the "coin hoarding trend"
Regulatory support
The U.S. "Cryptocurrency Week" deliberates on three key bills
Hong Kong passes the "Stablecoin Ordinance" (effective on August 1)
The EU MiCA framework begins to be implemented
Macro support
The probability of the Fed's September rate cut is 72.3%
The weakening of the U.S. dollar + trade protection policies boost risk aversion demand
Bitcoin's positioning shifts from "speculative assets" to "digital gold"
Key technical signals
Breakthrough pattern: daily "three white soldiers" candle + ascending triangle breakthrough, target 128,000-132,000 U.S. dollars Yuan
Key position:
Support: $116,800 (near term), $112,000 (key)
Resistance: $121,500 (short term), $140,000 (long term)
Risk signal: H4 chart RSI reaches 77, MACD histogram shrinks
Future outlook
Short term: If the $112,000 support is maintained, it is expected to challenge $140,000
Risk: Falling below $108,500 may trigger a chain of liquidations
Cycle law: Referring to "peaking 550 days after halving", this round of bull market may peak in October
Breakout trading strategy (suitable for aggressive traders )
Entry conditions:
Price stabilizes above $123,000 with increased trading volume (at least 1.5 times the 20-day average volume)
4-hour chart closes above the previous high for three consecutive positive lines
Targets:
First target $128,000 (1.618 Fibonacci extension level)
Second target $135,000 (psychological barrier + upper channel track)
Stop loss setting:
Day trading: Falling below the $120,000 round mark
Swing trading: Falling below the $116,800 support platform
Conclusion: Bitcoin is writing a new chapter in history, but investors need to be wary of "extreme joy leads to sorrow". Remember: when others are fearful, I am greedy, and when others are greedy, I am fearful - this old saying always applies to the crypto market.

$BTC RISING WEDGE ~ {LONG TERM VIEW}I don't feel like writing, everything is clear. Bitcoin is bullish right now, but keep an eye on this pattern.

Weekly trading plan for BitcoinBINANCE:BTCUSDT has currently set a new ATH, trading in the 121k-122k range. While no clear reversal signals are present yet, we're seeing early signs of a 4h RSI divergence. Without solid confirmation, short positions remain risky - price could liquidate shorts multiple times before any meaningful reversal. Key local level to watch is 119k
Trade safe and stay adaptive

Are You Really Analyzing Or Just Defending your imagination? You might think you're analyzing every time you open a chart.
But what if you're just looking for reasons to justify a bad trade?
Real analysis is data-based. Justification is emotion-based.
Let’s figure out if you're really trading smart or just lying to yourself.
Hello✌
Spend 3 minutes ⏰ reading this educational material.
🎯 Analytical Insight on Bitcoin:
BINANCE:BTCUSDT is currently testing a strong resistance near the upper boundary of its parallel channel. A breakout to the upside looks likely soon. From this level, I expect at least a 5% gain, with a main target around $114,500. 📈🚀
Now , let's dive into the educational section,
🎯 Analysis or Mental Justification?
Many traders, once they’re in a position, stop looking for truth and start looking for confirmation.
Instead of reading what the chart actually says, they twist every line and indicator to make it look like their trade still makes sense even when it doesn’t.
🛠 TradingView Tools That Kill Self-Deception
TradingView is way more than just a place to slap on some EMAs and MACDs. If used right, it can literally stop you from fooling yourself:
Replay Tool – Use this to backtest without future data bias. It trains your brain to analyze based only on the present moment.
Multi-Timeframe Layouts – View your idea across multiple timeframes. Confirmation bias collapses fast when you see the same chart from different angles.
Volume Profile – This shows where real trading happens, not where you wish it would happen.
Community Scripts & Public Indicators – Looking at someone else's logic helps you catch your own blind spots.
Idea Journal & Posts – Publish your analysis and compare it with what actually happened. You’ll quickly see how often emotion was driving your trade.
😵💫 What Does Justification Even Look Like?
It’s when you’re deep in the red but instead of managing your loss, you draw a new trendline… or add a reversed Fibonacci… or tell yourself, “It’s just a correction.”
That’s not analysis. That’s emotional defense.
💡 Know the Real Difference
Analysis = data-driven, emotion-free.
Justification = emotion-driven, data-twisted.
🔂 Why Do You Keep Making the Same Mistake?
Because your brain loves to feel right even when it's wrong.
Instead of accepting reality, it tries to bend it.
So you dig for signals to support your bad position, not question it.
🧠 The Psychology Behind the Trap
What you’re feeling is cognitive dissonance. Two thoughts fighting in your head:
“This position is failing.”
“I don’t want to be wrong.”
So your brain builds fake reasons to stay in it. Welcome to the mental loop that kills portfolios.
🎯 How To Break the Cycle
Write down why you’re entering any trade before you open it.
Only trade what you can explain, not what you hope.
Decide your stop-loss level before you enter.
If you’re “hoping” for something to turn around, it probably won’t.
🪞Be Brutally Honest With Yourself
The real question isn’t “Can you analyze?”
It’s “Can you admit you were wrong when it matters?”
Every losing trade you hold onto out of ego is a reminder that you chose comfort over skill.
⚠️ What Makes a Pro Trader?
A pro doesn’t just win trades. They cut losses fast.
They don’t “marry” a position just because they drew a trendline.
They survive by respecting truth, not bending it.
🧪 Train Your Brain To See Reality
To break the habit of self-justification, you need to rewire your analysis process. Here's how:
Before analyzing a chart, review your previous trade honestly.
Ask: What made me enter? Strategy or emotion?
Replay the chart with TradingView’s tool. If you didn’t know the future, would you still take that trade?
Answer those questions and you'll start separating real analysis from self-defense.
👁 Look at the Chart Without Bias
If you’re holding a position while analyzing, you’re probably just looking for evidence to stay in.
Try this instead: Pick a timeframe where you have no position, and do a clean analysis.
No hope. No fear. No money on the line.
That’s when real analysis happens.
🔚 Final Note
Real analysis hurts because it forces you to face mistakes. But it's also the path to real consistency.
Next time you open a chart, ask yourself:
“Am I seeking the truth or just a reason to hold on?”
One moment of honesty can change your entire trading journey.
✨ Need a little love!
We put so much love and time into bringing you useful content & your support truly keeps us going. don’t be shy—drop a comment below. We’d love to hear from you! 💛
Big thanks , Mad Whale 🐋
📜Please remember to do your own research before making any investment decisions. Also, don’t forget to check the disclaimer at the bottom of each post for more details.

Bitcoin Monthly · New ATH vs 2021, Indicators & MoreLast month Bitcoin produced its highest close ever, $107,146. The last three months all closed green, the close was higher than the open, and this is the fourth green month so far.
Bitcoin tends to produce a period of bullish consolidation before a major move, and this is exactly what we are seeing now. Bitcoin tends to produce a correction before a major bullish move, and this is exactly what happened between January and April. Bitcoin is set to grow.
Past action · consolidation
We already looked at the consolidation period that happens between each major price advance. Since 2022, Bitcoin has been moving sideways for some 200-220 days before each advance. This happened in 2022, 2023, 2024 and also now in 2025.
Looking at it from the monthly timeframe, the consolidation period was capped each time at 7 bars, 214 days. Current consolidation has already been going for more than 215 days. Bitcoin is set to continue growing.
Indicators · MAs, RSI & MACD
Bitcoin is trading above all moving averages. The monthly RSI is very strong, beyond 70.6.
The monthly MACD is moving at all-time high levels, trending up with room available for additional growth.
Chart patterns · candlestick reading
The chart patterns now has no similarities to 2021. Many people were saying that Bitcoin produced a double-top similar to 2021 and was set to move down. I completely disagree with this analysis.
In 2021 both instances when Bitcoin peaked the month ended up closing red. In 2025 the months when Bitcoin peaked the months ended closing green.
The same month the peak was hit in 2021 was followed by bearish action, twice. And of course, the bear market. In 2025 the market has been consolidating for months and trading near its all-time high.
Finally, in 2021 each peak was 7 months apart, 214. In 2025, the last two peaks are 4 months apart, only 120 days.
This difference is good to point out because market conditions are not the same. Not the same market conditions means that Bitcoin is not likely to go into a bear market now, instead, it can produce something difference. The market has only three directions: Down, sideways and up.
Down has been eliminated based on past action.
Sideways is happening now.
Something different only leaves the upside open; Bitcoin is going up.
Namaste.

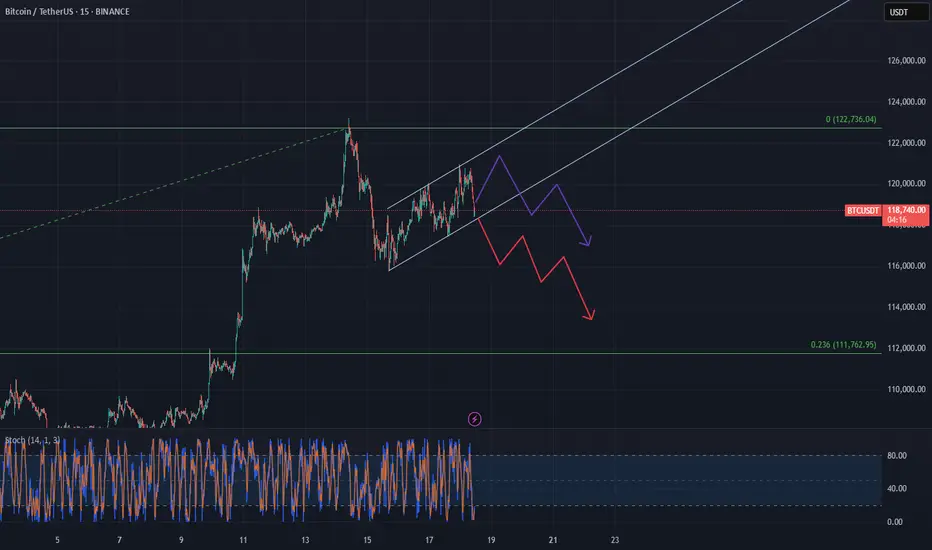
BTC consolidating a short term bearish channelBTC is moving inside a short-term bearish channel right now, even though the bigger trend is still upward. It looks like it's just consolidating for the time being, bouncing between the top and bottom of the channel.
But if it breaks below that lower trendline, we could see a pretty sharp move down—possibly all the way to around $112K , which lines up with the Fibonacci retracement from the last rally. That zone could act as a support.
It might hang out in this range a little longer, but once it breaks down, it’s probably heading toward that level.
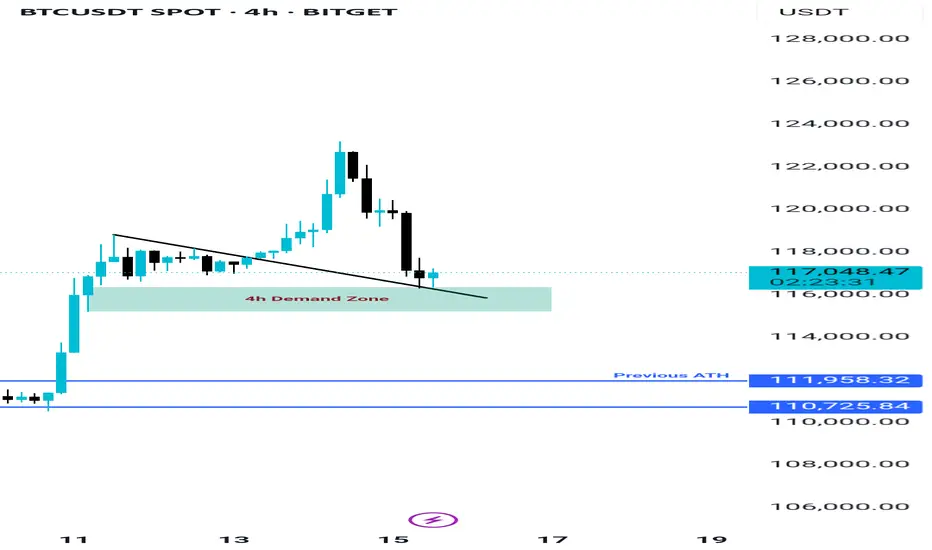
BTC still Holding the Demand Zone, Bitcoin is currently holding the demand zone between $116K and $117K, which also aligns with the retest area of a previously broken trendline—making this zone quite strong. If BTC manages to close above $117.8K on lower timeframes, we could see the beginning of a new uptrend targeting around $130K. However, if this zone fails due to any unexpected news or events, the next key support lies between $111K and $113K.