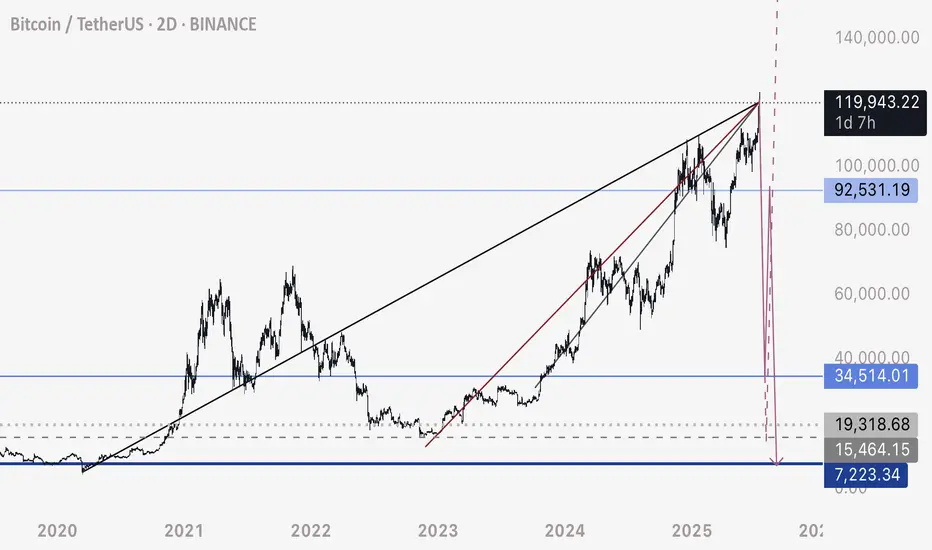
BTC - Last Attempt at Predicting TopThis is my last attempt at predicting the top of this upwards move on the HTF.
Adjusting these trendlines to where BTC pumped to, which was a lot higher than initially anticipated, it does look to me that these trendlines are still respected.
There are 3 bearish ascending lines that price has been interacting with - I assume we are looking at a crossing intersection of them, per the chart here.
If BTC continues higher without a very fast, drastic free fall - I will be looking at other possibilities. If price moves above 122,000 again, I would consider this invalid - as I suspect the resistance level sits around 120,000 to 120,500 area.
I will be looking for a very fast drop to consider this possibility as valid and likely from here on.
BTCUSDT.P trade ideas
BTC updateHere is the next upside Target. But - we're overbought, so better (for longs) wait for pullback. Also, better for safety.
Good Luck!
Bitcoin's Next Move: Planning the Counter-Trend ShortThis 30-minute BTC/USDT chart provides an excellent case study. After successfully identifying and trading the breakout from the consolidation range (highlighted in the brown box), the focus now shifts to a new, potential trade setup.
Asset: Bitcoin / TetherUS (BTC/USDT)
Timeframe: 30-Minute
Recap: The price has powerfully broken out of its previous range, a move that was anticipated and resulted in a successful long trade.
Current Situation: Following the strong, nearly vertical rally, the price is approaching the psychological $120,000 level. Runs like this are often followed by a period of profit-taking or a short-term pullback.
The New Trade Plan: A Bearish Setup
The chart now displays a new short position setup. This is a bearish, counter-trend trade designed to profit from a potential price rejection.
Strategy: To sell or "short" Bitcoin at a higher price, anticipating a pullback. This is a riskier strategy than trading with the trend, but it's based on the idea that the sharp rally is due for a correction.
The Setup is as follows:
Entry (Sell): $120,222.31
Take Profit (Target): $119,323.25
Stop-Loss (Invalidation): $120,579.09
In summary, after the breakout rally, the plan is to watch for signs of exhaustion. If the price pushes up to the $120,222 level and gets rejected, this trade aims to capture the resulting downward move towards the $119,300 area. The stop-loss is placed tightly above to manage risk in case the powerful uptrend continues without pausing

BTCUSDT Forming Strong BreakoutBTCUSDT is looking increasingly bullish as the pair continues to hold above its key support level, building a solid foundation for the next major leg up. The chart clearly shows a strong breakout pattern forming with higher highs and higher lows, signaling that the momentum is shifting in favor of the bulls. The well-defined support zone highlighted on the chart has repeatedly acted as a launchpad for buyers, making this area crucial for traders to watch closely. A breakout above the recent consolidation could open doors for a significant rally toward the 140% to 150% gain levels projected.
Volume for BTCUSDT remains robust, confirming the strong interest from both retail and institutional investors. This is a good sign because healthy volume typically precedes strong price action and follow-through. As Bitcoin continues to dominate the crypto market, it often sets the tone for the entire altcoin space, so a strong BTC rally could spark renewed optimism across the board. Traders are now keeping a close eye on whether BTC can maintain its position above the key psychological levels shown on the chart, as this could trigger another wave of buying momentum.
Investors are increasingly looking at BTCUSDT as a safe bet in an otherwise volatile market. Bitcoin’s fundamentals remain strong, with growing adoption, continued development, and macroeconomic conditions that could favor a hedge like BTC. Combined with the current technical setup, the outlook is promising for a big move to the upside. As we approach the next few weeks, the market sentiment suggests that any dips towards the key support level might be seen as attractive buying opportunities.
✅ Show your support by hitting the like button and
✅ Leaving a comment below! (What is You opinion about this Coin)
Your feedback and engagement keep me inspired to share more insightful market analysis with you!

Flawless ExecutionA picture-perfect trade on CRYPTOCAP:BTC from start to finish. 🎯
The Plan: Wait for the breakout above resistance.
The Result: A powerful move straight through our target zone.
Clean analysis, clean execution, clean profits. On to the next one.
#Bitcoin #Trading #Crypto #TechnicalAnalysis #BTC

Bitcoin hits a new high! Is this time really different?Bitcoin hits a new high! Is this time really different?
Bitcoin hits a new high! On July 11, BTC broke through $117,000 in one fell swoop, completely igniting market sentiment. Shorts were completely defeated, and 230,000 investors were liquidated within 24 hours, losing $541 million, of which 89% were short orders-this market is simply rubbing shorts on the ground!
But this rise is different from the past.
🔥 Why is Bitcoin so strong this time?
Institutions buy frantically: Bitcoin spot ETFs such as BlackRock and Fidelity continue to attract money, with net inflows exceeding $1.44 billion in 2025. What's even more exaggerated is that listed companies buy directly-143 companies around the world have hoarded 850,000 BTC, worth $95.3 billion! MicroStrategy alone holds 576,000 bitcoins and makes a fortune!
Expectations of Fed rate cuts: The market is betting that the Fed will cut interest rates this year, the dollar is weakening, and funds are pouring into Bitcoin for risk aversion.
Regulatory relaxation: Hong Kong, the EU and the United States are all promoting cryptocurrency compliance. The Trump administration even plans to establish a "national cryptocurrency reserve" to make institutions feel more at ease entering the market.
📈 Technical side: Can it rise again?
Breaking through key resistance: Bitcoin has stabilized at $112,000, the daily level "ascending triangle" breakthrough has been confirmed, MACD golden cross, RSI healthy (not overbought).
Next target: $120,000! But if it falls below $107,000, it may face a correction.
Be careful of high leverage: The current market is dominated by futures, and the spot/derivatives trading volume ratio is only 0.07. Once it pulls back, it may trigger a chain of liquidations!
⚠️ Risk: Don't be blinded by FOMO (fear of missing out)!
Short-term overbought: H4 level RSI has reached 72 and may pull back at any time.
Policy variables: If the Fed postpones the rate cut or the situation in the Middle East worsens, BTC may fall to $55,000!
Regulatory uncertainty: Global policies have not yet been unified, China still bans cryptocurrencies, and the problem of stablecoin reserves has not been completely resolved.
🚀 Operational suggestions: How to operate?
Radicals: Buy when it falls back to around $110,500, with a target of $120,000 and a stop loss below $107,000.
Conservatives: Wait until it stabilizes at $117,500 before chasing the rise, or wait until it falls back to the support level before entering the market.
Long-term holding (HODL): Institutions are hoarding coins, why are you panicking? But don't bet all in, keep some bullets to deal with black swans!
🎯 Conclusion: The bull market continues!
This wave of Bitcoin's rise is driven by institutions + policies + liquidity. Unlike the retail carnival in 2017 and 2021, this rise is more sustainable. But the market will not only rise but not fall, and it may fall back in the short term. Don't use high leverage!
Remember: make money in a bull market and make money in a bear market. Don’t be afraid of missing out (FOMO), and don’t be greedy. Only by surviving can you get the next wave of dividends! 🚀
(PS: If you haven’t bought it yet, don’t worry, wait for a pullback before buying it. There are always opportunities in the market, but if the principal is gone, it’s really gone!)
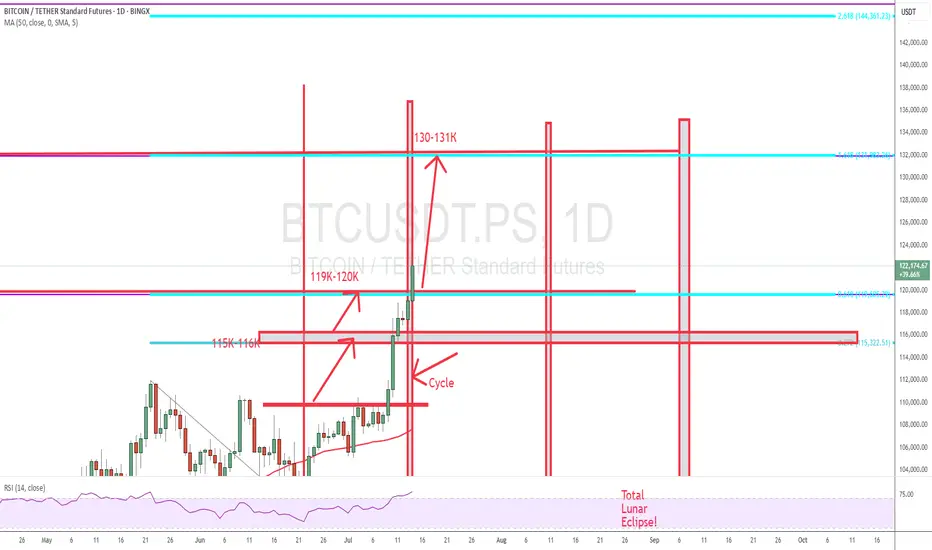
BITCOINAs of July 11, 2025, Bitcoin (BTC) is experiencing a strong bullish surge, reaching new all-time highs:
Current Price: Around $117,786 per BTC, up about 1.55% on the day, with an intraday high near $118,780.
Market Cap: Approximately $2.33 trillion, reflecting significant institutional and retail interest.
Trading Volume: High, with 24-hour volume exceeding $124 billion, indicating robust market activity.
Key Drivers Behind Today’s Bitcoin Rally:
New All-Time High: Bitcoin recently surpassed its previous record, hitting nearly $118,800, fueling bullish momentum.
Massive Short Squeeze: Over $1 billion in short positions were liquidated within 24 hours, including around $570 million in Bitcoin shorts, accelerating the price rally.
ETF Inflows: US spot Bitcoin ETFs have seen substantial inflows (around $50 billion this week), signaling strong institutional demand.
Technical Breakout: Technical indicators show a strong bullish trend, with Bitcoin targeting levels above $126-130K,
Macro Environment: The US dollar is weakening sharply (its worst performance since 1973), boosting risk assets like Bitcoin.
Growing Adoption: Corporate treasury purchases and positive regulatory developments in the US are enhancing investor confidence.
Market Sentiment and Outlook:
The Relative Strength Index (RSI) is above 70, indicating strong bullish momentum but also suggesting caution for a possible short-term pullback.
The number of Bitcoin wallets holding BTC has increased significantly, showing renewed accumulation by investors.
Technical Outlook Bullish, target $120K+
Bitcoin’s rally today is driven by a powerful combination of technical breakout, institutional buying, short squeeze dynamics, and supportive macroeconomic factors, making it one of the strongest moves in crypto markets this year.
#BTC #BITCOIN

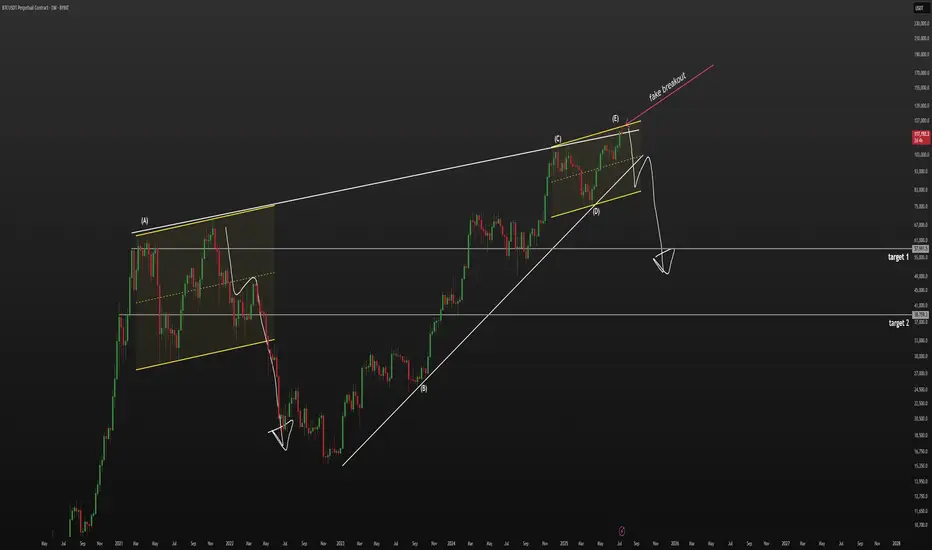
BTC - bearish wedge, 60k$ not a joke🔻 Globally, we are in a bearish wedge.
The price made a fake breakout and currently looks weak. On the 1D timeframe, we’re in an ascending channel similar to what we saw in 2021. Back then, after making a second higher high, the price sharply reversed downward.
📉 I believe the relevant downside targets are $60,000 and $40,000.
🔺 I’m currently in a short position, with a stop at $125,333.
Bears Getting Ready On #BTC#BTC is approaching a key resistance zone after a strong rally. Bearish signals are forming on the chart, suggesting a potential reversal. A short position could be favorable if the price fails to break above this level. Watch for confirmation before entering the trade
BTC BIG SHORT!We did a mirror retest, and many other signals also point to a sharp decline, indicating numerological codes 69/96.

#BTC/USDT Bitcoin Recovers Above 108,000 $#BTC
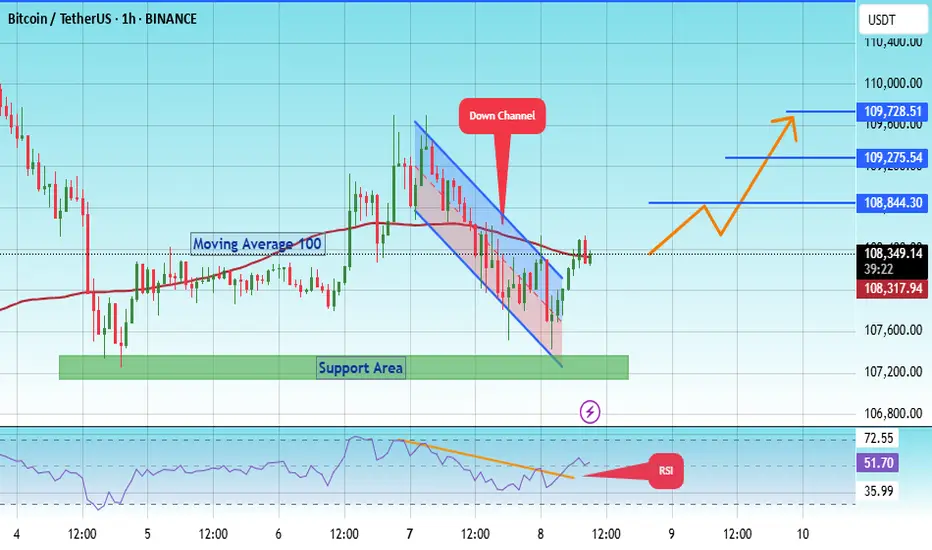
The price is moving within a descending channel on the 1-hour frame, adhering well to it, and is on its way to breaking it strongly upwards and retesting it.
We are seeing a bounce from the lower boundary of the descending channel. This support is at 107600.
We have a downtrend on the RSI indicator that is about to break and retest, supporting the upside.
There is a major support area in green at 107217, which represents a strong basis for the upside.
Don't forget a simple thing: ease and capital.
When you reach the first target, save some money and then change your stop-loss order to an entry order.
For inquiries, please leave a comment.
We are looking to hold above the Moving Average 100.
Entry price: 108337.
First target: 108844.
Second target: 109275.
Third target: 109728.
Don't forget a simple thing: ease and capital.
When you reach the first target, save some money and then change your stop-loss order to an entry order.
For inquiries, please leave a comment.
Thank you.
BTC - Can it reach 100k?FOR SUREEEEE it can! Just let it close above 120k for it to form in a formed manner or way

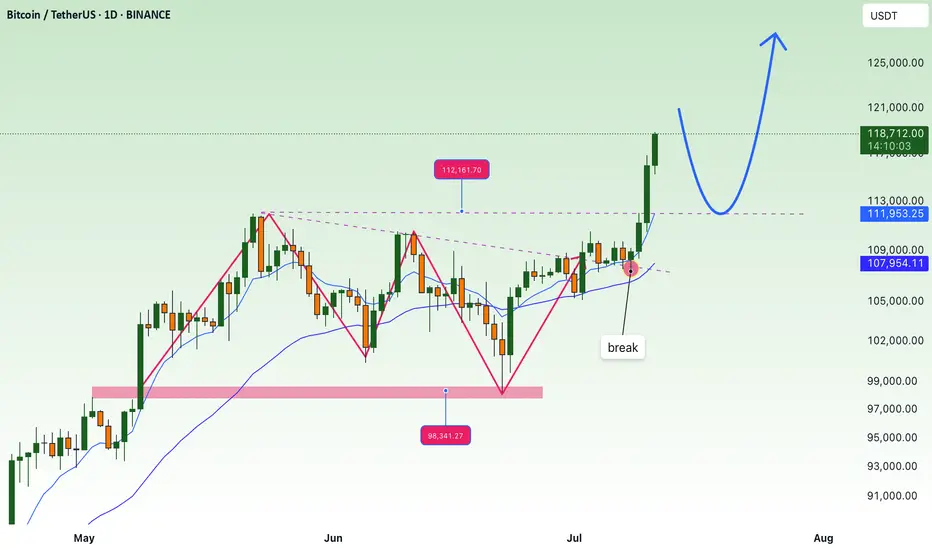
FOMO price increase, create new ATH💎 Update Plan BTC weekend (July 11)
Continuously creating a new ATH, preparing to have a short sale?
The reinforcement of Bitcoin price around the upper boundary of the previous consolidation area was broken at $ 108,355, which ended on Wednesday. The price has soared to the highest level of the new time of $ 116,868 on Thursday. At the time of writing on Friday, the price is fluctuating above $ 116,600.
When BTC entered the price exploration regime and if the trend of increasing continues, the price can expand the momentum to an important psychological level of $ 120,000.
Technical analysis angle
Our community has continuously chose the trend of increasing as the mainstream for all previous transactions and currently preparing to welcome 120k as forecast.
The relative power index (RSI) on the daily chart reaches 71, higher than the excess buying 70, showing a sharp increase. However, traders should be cautious because the ability to adjust the decrease is very high due to over -purchase. Meanwhile, the average divergence dynamic indicator (MACD) has shown a price intersection at the end of June. The indicator also shows that green histograms are increasing on neutral zero, showing that the rising momentum is being strengthened and continues to increase.
However, if BTC must be adjusted, the price may extend the decline to search and support around the upper boundary of the unified area that has been broken earlier at $ 108,355.
Plan has been constantly accurate in the past 2 months, which is the positive signal of the channel that brings value to the community.
Please follow the channel to receive accurate scenarios about gold and BTC
==> Comments for trend reference. Wishing investors successfully trading
BTCUSDT - going to 113866.19$My analysis is based on numerology, all the numbers you see on the chart are from the same place. There is a certain numerological symbolism, which tells me that the price has already put the bottom 49(13) and will make a reversal from the zone 52260+- and then will fly strongly upwards with the target first 89k bucks, and after 113k. It's time to look for a good entry point.

BTC — Harmonic Parabolic Scenario 1. Rise to 110–111k by July 4–5
2. Drop into July 9–10
3. Parabolic move after July 10
4. TP: ATH+
5. Stop: scenario invalid if no breakout

July 10th Market Outlook –Charted Waters & Uncertain Momentum🗓️📊 July 10th Market Outlook – Charted Waters & Uncertain Momentum 🌊⚠️
Today’s breakdown is a reality check for traders navigating a market full of setups but short on clarity. Resistance is stacking across the board, but that doesn’t mean we can’t break through — it just means we need to stay sharp and keep our charts close.
🔎 Highlights from the 19-minute video:
Bitcoin is approaching a third and crucial resistance test. A breakout could trigger ultra-FOMO, but failure here could send us lower.
Ethereum is in a pressure zone — the "Symplegades" setup from Greek mythology reflects today’s narrow trading path.
Bitcoin Dominance is clinging to support — if it breaks, altseason could be on. If it holds, alts may stay sidelined.
NASDAQ & Nvidia have delivered massive runs, but signs of exhaustion and reversal risk are showing.
Dollar Index (DXY) showing a Golden Cross, but unresolved rate expectations could catch markets off guard.
💬 I also speak candidly about market manipulation, being someone else’s exit liquidity, and why we might be heading toward a formative trap before any true breakout.
🎥 Watch the full video to catch all the details — from long-term setups to real-time chart reactions.
📌 Stay tuned for detailed updates today on Bitcoin, Ethereum, Bitcoin Dominance, NASDAQ and more.
One Love,
The FXPROFESSOR 💙
Disclosure: I am happy to be part of the Trade Nation's Influencer program and receive a monthly fee for using their TradingView charts in my analysis. Awesome broker, where the trader really comes first! 🌟🤝📈

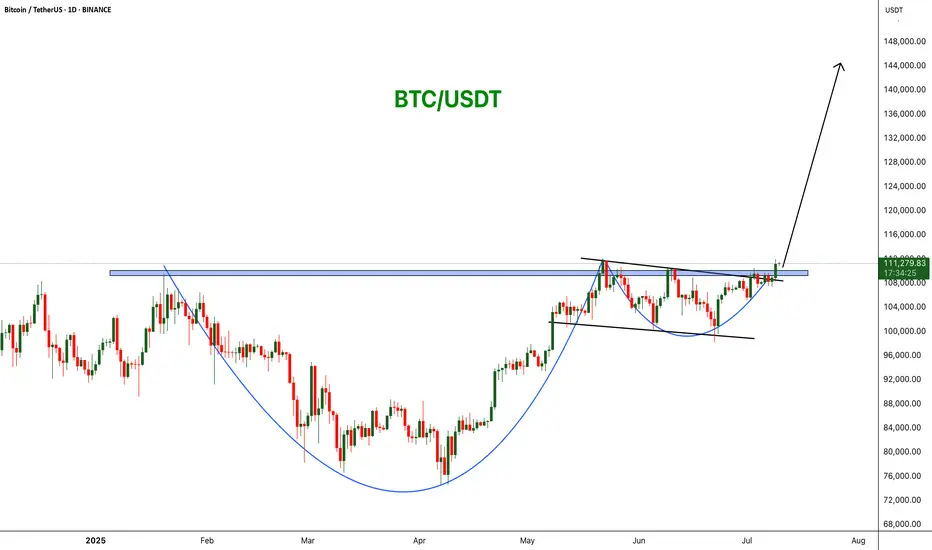
BTCUSDT: Cup and Handle Breakout! BINANCE:BTCUSDT is forming a powerful bullish breakout from a cup and handle pattern on the daily chart. Price has cleared key horizontal resistance around $110,000, signaling strength and the potential for a continuation move toward $144,444.
Stop Loss: $98K
Target : $144k
CRYPTOCAP:BTC
BTC ALL SET FOR MAJOR HIGHS The price has tested the resistance line multiple times showing strong supply/resistance. Buyers are gradually pushing price higher (higher lows), but momentum is weakening near resistance.
This is a sign of consolidation under resistance pattern before breakout .Rising wedge typically breaks down signaling a potential drop, it confirms weakening momentum.
Area to Watch for Entry
103000-104000 (recent demand zone) for Bullish
After daily candle closes above 113000 instant bullish Entry.

Bitcoin's New All-Time High = Altcoins Market Bull MarketThe shy new all-time high is in and it is good to be Bitcoin today. It is good to be Bitcoin, to be in Bitcoin and profit while trading Bitcoin but the bears got rekt and that's oookkkk. We accept their loss and it is their loss they earned it by being short when the market is good, bullish and strong. Who would short Bitcoin right before a new all-time high? I don't know.
A new all-time high was hit today, the price $112,000 but this is not the end. Not even close. This is the beginning of the next bullish wave.
I know what you are thinking, or might be thinking; Wait, but what about a drop? What about the correction? Will it go lower? Can I buy Bitcoin at 90K? I told you to buy when prices were low... "You would look like a genius for buying below 80K," 100K is already gone. No, no correction! Bitcoin is going up.
When resistance breaks it means higher. When prices move higher it means higher. When a new all-time high hits it means the bulls win. Now that the bulls won, the battle for the rise or the drop, we can expect higher prices. If you have any doubts, look at the altcoins. The altcoins market says we are entering a period of long-term growth.
Bitcoin will continue to hold strong. It will continue to rise surely, slowly, or fast, but long-term. It doesn't matter the speed; Bitcoin for the whales, altcoins for retail.
A small capital will grow faster with the altcoins because they have higher room for growth. The projects being smaller, more volatile makes for a good trading experience. Higher risk but also a higher opportunity to grow in the short- and mid-term. Bitcoin is good to retire now. Bitcoin is great to hold value, to support the market as it continues to grow.
For me and for you, welcome to the altcoins market bull market.
Thanks a lot for your continued support.
Namaste.

BTC makes new all time highs!Crypto has been soaring today.
Ethereum and BTC pumping liquidity!
Fed minutes came out today around 2pm, indicating rate cuts at next meeting and throughout the rest of the year and crypto absolutely loved that.
Crypto thrives in a cheap liquidity environment, rallying in potential rate cuts.
We took profits on IBIT calls - still holding longs in the BTC market expecting higher price.


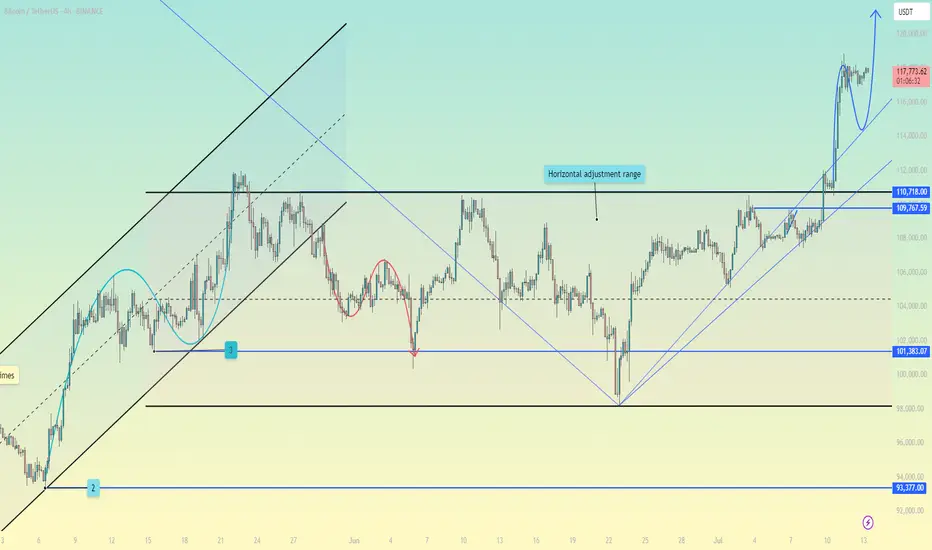
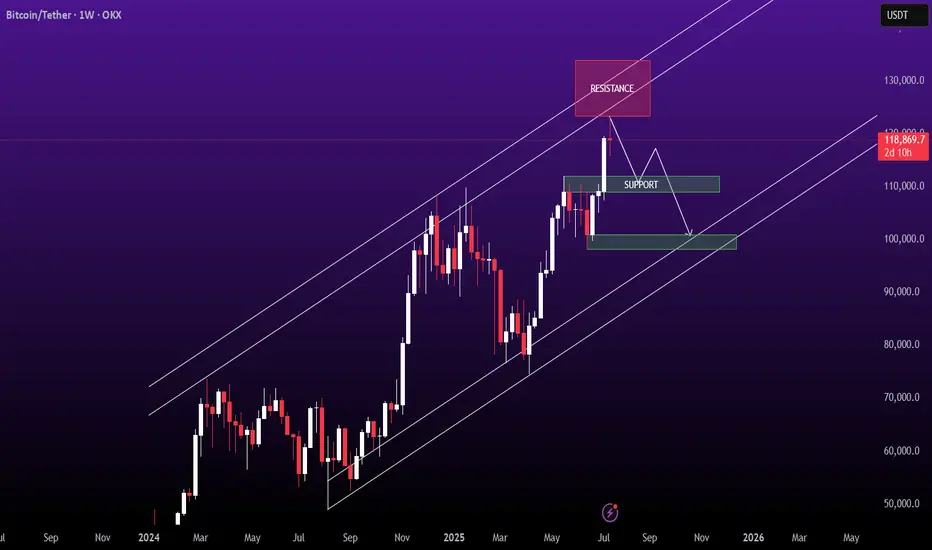
BTC/USDT Chart Analysis (4H)Patterns and Structure:
Bitcoin remains inside a larger converging structure (symmetrical triangle/wedge) visible from the diagonal trendline.
The price has recently broken above the descending resistance trendline but is hovering near the red resistance area (~$109,000–$110,000).
Ichimoku Cloud:
The price is currently above the Ichimoku Cloud, which acts as support (~$107,000–$108,000 area).
The cloud below the price is green, indicating bullish momentum.
Key Areas:
Resistance Area: $109,000–$110,000 (red box). Multiple previous rejections from this area.
Support Zone: $106,000–$107,000 (cloud and trendline support).
Key Lower Support: The green box near $98,000–$100,000, in case of a deeper retracement.
Possible Scenario:
As your blue arrow suggests, if Bitcoin consolidates above the breakout level (~$108,000), a rally towards the next major resistance between $112,000–$114,000 is likely.
Conversely, losing the breakout zone could see BTC return to retest lower support levels around $106,000 or $100,000.
Short-term Outlook:
The trend bias remains bullish as long as BTC stays above ~$107,000.
Monitor price reaction to the red resistance zone for breakout confirmation or potential rejection.
Conclusion:
BTC is showing signs of strength, but the $109,000-$110,000 resistance zone is crucial. A confirmed breakout above this zone could accelerate the move towards the $112,000-$114,000 targets.
Stay tuned for updates and key levels to watch!
Thanks for your support!
DYOR. NFA

$BTC/USDT Eyes $121KCRYPTOCAP:BTC has broken out of the descending wedge and is holding above key support around $106K.
The structure looks bullish with a potential move toward $121K (+11.24%).
As long as the price stays above the breakout zone, momentum favors the bulls.
DYOR, NFA
