Is Bitcoin Getting Ready to dump?
In this analysis, I looked at the weekly, daily, and 4-hour timeframes and found some key signals that suggest a major shift might be coming in Bitcoin’s movement over the next few days and weeks.
If you don’t want to get caught off guard by the next big move, make sure to watch the video all the way through!
BTCUSDT.P trade ideas

BTCUSDT 4H Analysis
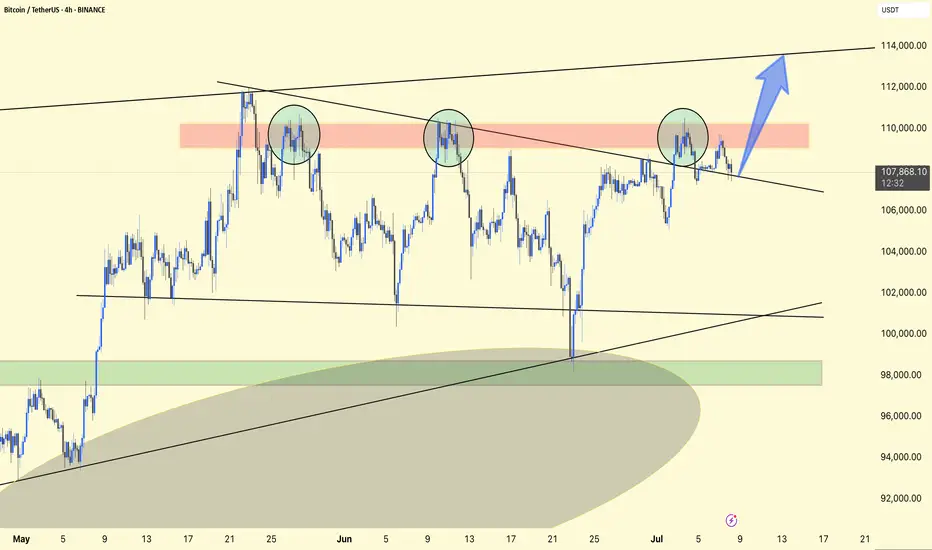
BTC is consolidating below the key resistance zone highlighted in red (~$109,000–$110,000).
The price continues to form higher lows, showing bullish pressure despite rejection in the red zone.
The structure resembles an ascending triangle, indicating a potential breakout.
Upside Target: ~$113,500–$114,000 if the price moves above ~$110,000 with strong volumes.
Support Zone: ~$106,000–$106,300 must hold to keep the bullish scenario intact.
If the support breaks, the price could retest ~$102,000–$103,000.
Small Insights: Repeated retests of resistance suggest that bulls are absorbing supply. A strong push above the red zone could trigger a short squeeze.
Stay alert!
Candlestick Patterns - How to read them like a ProOverview
Candlestick charts serve as a cornerstone in technical analysis, presenting price activity in a visually digestible format. By examining how prices move over a given timeframe, traders gain key insights into potential market direction, sentiment shifts, and trend strength.
Mastering candlestick interpretation is essential for identifying bullish or bearish sentiment, as well as for spotting possible trend reversals or continuations. Still, candlesticks alone don’t paint the full picture—using them without broader context increases the risk of false signals.
---
What You'll Learn
What are candlestick charts?
Common bearish candlestick patterns
Common bullish candlestick patterns
How to apply candlestick analysis in trading
---
What is a Candlestick Chart?
A candlestick provides a snapshot of an asset’s price behavior during a specific time interval, whether it's one minute, one hour, or one day. This format allows traders to quickly assess how the price has moved within that period.
Each candle reveals four price points:
* Open – the price at the beginning of the interval
* Close – the price at the end of the interval
* High – the highest price reached
* Low – the lowest price during that time
Anatomy of a Candlestick:
* Body: The thick section between the open and close. A green (or white) body means the close was higher than the open (bullish), while red (or black) means the opposite (bearish).
* Wicks (or Shadows): Thin lines extending from the body to indicate the high and low.
* Upper wick: Marks the highest traded price
* Lower wick: Marks the lowest traded price
---
Bearish Candlestick Patterns
Understanding bearish candlestick patterns helps traders identify moments when buying momentum might be running out—setting the stage for a potential downward shift.
Evening Star
A three-candle formation that signals a shift from buying pressure to selling dominance. It starts with a strong bullish candle, followed by a small-bodied candle of indecision, and concludes with a large bearish candle that cuts deep into the first. This pattern often appears at the end of an uptrend.
Bearish Engulfing
This setup includes a small bullish candle followed by a large bearish candle that completely swallows the previous one. It indicates that sellers have seized control, potentially marking the beginning of a downward trend.
Shooting Star
With a small real body near the low and a long upper wick, this pattern reflects strong early buying that is ultimately rejected by the close—suggesting fading bullish momentum.
Gravestone Doji
This candle opens, closes, and hits its low all around the same price, leaving a long upper wick. It suggests that bulls pushed higher during the session but were overpowered by bears by the close.
Three Crows
Three consecutive bearish candles, all approximately the same size. These indicate that a sell off is coming soon.
---
Bullish Candlestick Patterns
Bullish patterns can alert traders to possible reversals after a downtrend or strengthen conviction during an uptrend.
Morning Star
This three-candle formation marks a potential turning point from bearish to bullish. It begins with a strong bearish candle, followed by a smaller candle showing indecision, and ends with a large bullish candle breaking upward—signaling buying strength is returning.
Bullish Engulfing
This two-candle pattern begins with a bearish candle, then a larger bullish candle that completely envelops the previous body. It reflects a sharp transition in sentiment, suggesting renewed buying pressure.
Dragonfly Doji
A single candle where the open, close, and high are all very close, with a long lower wick. It shows sellers pushed prices lower but buyers stepped in and brought them back up—an early sign of possible reversal.
Hammer
A classic bullish reversal signal that features a small real body near the top and a long lower shadow. It indicates a battle where sellers initially dominated, but buyers managed to close near the open price.
Three soldiers
Three consecutive bullish candles, all approximately the same size. These indicate that a big buy is coming soon.
---
Trading with Candlestick Patterns
Candlestick patterns become more meaningful when they align with major chart areas—such as previous support or resistance, trendlines, or retracement zones. A bullish signal at a support level can hint that the downward pressure is fading, while a bearish pattern at resistance may warn of an upcoming decline.
To increase the reliability of your trades, combine candlestick patterns with other forms of technical analysis:
* Support & Resistance Zones: These are price levels where the market has historically reacted. Candlestick patterns forming near these zones have stronger potential implications.
* Fibonacci Levels : These help identify likely retracement areas. When a candlestick pattern forms near a key Fibonacci level like 61.8%, it adds strength to a potential reversal setup.
* Liquidity Areas: Clusters of orders (buy or sell) tend to create strong reactions. When patterns appear in these zones, they often precede more decisive moves.
* Technical Indicators : RSI, MACD, Moving Averages, and Stochastic RSI can provide confirmation. For instance, a bullish reversal pattern that appears when RSI is oversold strengthens the signal.
💡 Tip: Don’t rush into trades based on one candlestick alone. Always wait for the next candle or price confirmation (e.g., a break of a previous high/low) to validate your signal.
---
Thanks for Reading!
✨ If you found this helpful, show some love by liking or commenting!
🔔 Don’t forget to follow for more technical breakdowns and trading insights coming soon!

How to Trade Smart Money Concepts (SMC)\ How to Trade Smart Money Concepts (SMC)\
\ This article explores the foundation, key tools, and practical insights of Smart Money Concepts — and why it’s worth your attention.\
In today's fast-changing financial landscape, Smart Money Concepts (SMC) has become a popular strategy among modern traders. But what is SMC exactly, and how can it improve your trading decisions? This article breaks it down in a simple, professional way for traders at all levels.
---
\ What Are Smart Money Concepts?\
SMC is a trading approach based on the belief that large institutions ("smart money") like banks and hedge funds control most of the market's movements. These institutions often move the market in ways that confuse or trap retail traders. The goal of SMC is to understand and follow the footsteps of these big players.
Instead of relying on simple patterns or indicators, SMC focuses on:
\ - Market structure\
\ - Supply and demand zones\
\ - Liquidity pools\
By aligning your trades with the behavior of smart money, you can position yourself more strategically in the market.
---
\ Key SMC Concepts Explained\
\ Order Blocks\
Order blocks are zones on the chart where large institutions have placed significant buy or sell orders. These zones often lead to strong price reactions and act as hidden support or resistance levels. Order blocks are considered more precise than traditional supply and demand areas.
Example: ()
\ Fair Value Gap (FVG)\
A Fair Value Gap occurs when price moves sharply in one direction, leaving a gap or imbalance in the price action. These areas often get filled later and can act as magnets for price.
In a bearish move, the FVG is the gap between the low of the previous candle and the high of the next one. In a bullish move, it's the reverse.
Example: ()
\ Timeframe Consideration\
If you can’t monitor charts during the day, avoid relying on 5–30 minute setups. Consider 4H or daily timeframes for clearer signals and more manageable trading decisions.
\ Liquidity\
Liquidity refers to price zones where lots of pending orders exist. These are usually at obvious highs, lows, or trendlines. Smart money often targets these areas to trigger stop-losses and generate movement.
One common tool to identify liquidity is a "pivot point," which is a candle with a lower low or higher high than its neighbors.
Example: ()
\ Break of Structure (BOS)\
BOS occurs when price breaks above or below a previous high or low, signaling a possible trend continuation.
Example: ()
\ Change of Character (ChoCH)\
ChoCH happens when the market changes direction. For example, if price breaks a higher low in an uptrend, it may signal a reversal.
Example: ()
Combined with BOS: ()
---
\ How SMC Compares to Wyckoff\
The idea of "smart money" isn't new. Richard D. Wyckoff, a pioneer in technical analysis, laid the foundation for understanding market cycles driven by institutions. His price cycle theory includes four phases:
\ 1. Accumulation\
Smart money buys while the public is unaware.
\ 2. Markup\
Price rises as smart money pushes the market.
\ 3. Distribution\
Smart money sells into public buying.
\ 4. Markdown\
Price falls as the cycle completes.
SMC borrows from this logic but focuses more on structure and liquidity zones. Still, the core idea is the same: understand what big players are doing, and follow them.
\ For deeper insights into Wyckoff, explore additional resources focused on accumulation/distribution cycles.\
---
\ Summary\
Smart Money Concepts give traders a deeper look into market mechanics. By focusing on order blocks, fair value gaps, liquidity, and structure breaks, SMC helps identify high-probability trade setups based on institutional behavior.
It may seem complex at first, but once you understand the basics, SMC can become a powerful tool in your trading strategy. Whether you’re new or experienced, aligning with smart money can improve your edge in the market.

All Binance Coins Watchlist 2025 JULY If you want to create a full list of all coins from the exchange you use, you can:
1. Go to Screeners
2. Set these filters:
a. Exchange (eg. Binance)
b. Quote currency - USDT
c. Symbol type - Perpetual
3. Keep Scrolling till the end of the list so that all coins are populated. There should be about 400+ coins.
4. Select one of the coins, then click Ctrl A to select all.
5. Right click > Add to an existing Watchlist or Create a new watchlist.
Here's my list i created on 4th July 2025. You can import it if you want.
www.tradingview.com

BITCOIN ABOUT TO CRASH HARD!!!!? (Be careful with your longs)I am sharing with you in this video the next CRYPTOCAP:BTC important resistances and support levels.
Together with the confirmations, it is said that if triggered, Bitcoin will start crashing hard, so be careful if you have overleveraged long positions opened right now!
Remember to always trade only with professional trading strategies and tactics, and make sure that your money management is tight!

Golden Bitcoin Signal: A Great Investment Opportunity🔔 Our Bitcoin Investment Bot has issued an exclusive signal! This signal, backed by 15 years of historical data analysis, marks the perfect time to enter the market. 🎯 Take Profit Target: $120,975 (equivalent to a potential 50.5% profit)
⚖️ Professional Risk Management: This signal comes with a Stop Loss at $66,835 (16.8% risk), offering an ideal balance of profit and risk. Our bot, with its advanced and data-driven strategies, identifies the most valuable investment opportunities.
⏳ Opportunities don’t last forever! This signal could be the start of a significant move. Now is the best time to act and take advantage of this precise analysis. With our bot, you’re one step closer to sustainable profitability. 🌟

BTC - Channel is Broken, Now What?
We are currently retesting the upper trend line of the channel I gave in this analysis, the most bullish scenario is that it breaks upwards and BTC stages a determined rally. If you cannot catch an entry during this rally, do not worry, we can retest the upper part of the trend again or go to manipulation areas such as green bubbles.

Bitcoin breakout is very closeBitcoin looks like it wants to break above its resistance and push upwards. My prediction still stands of 150-165k as cycle top.
Resistance levels (based on fib extension)
121.5k (0.618)
136k (1.00)

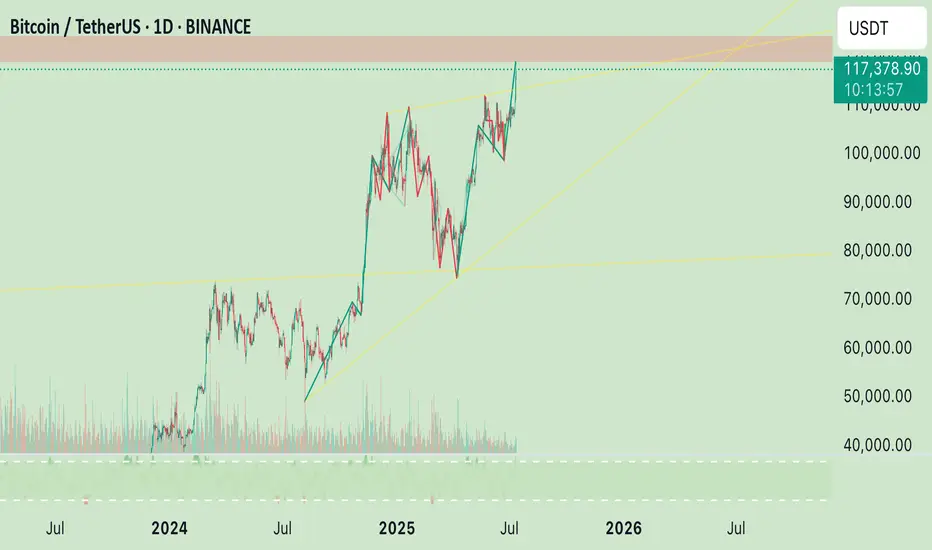
Bitcoin : Missed $100K? Don’t Miss What’s Coming Next!!MARKETSCOM:BITCOIN BINANCE:BTCUSDT continues to show exceptional strength and strong bullish momentum. When we look back at the charts from 2023 and 2024, a clear and reliable pattern stands out. Each time Bitcoin touched the 50 EMA on the weekly chart, it triggered a significant rally that led to new all-time highs. That same setup appears to be forming once again.
MARKETSCOM:BITCOIN tested the 50-week EMA around the $75,000 level and has since bounced with conviction. The price has reclaimed the $100,000 mark and is now challenging previous all-time high resistance. Historically, a successful bounce from this key moving average has not only signaled recovery but also sparked explosive upside moves.
Following this repeating pattern, the current cycle target is positioned at $150,000. A clean breakout above the current resistance zone could act as the trigger that launches Bitcoin into uncharted territory. The technical structure remains bullish, momentum is clearly accelerating, and the overall trend continues to favor the upside.
This moment represents a textbook Buy and HODL opportunity. Technical indicators are aligning, market sentiment is turning increasingly optimistic, and all signs suggest that Bitcoin could be preparing for another historic rally. Stay ready for what could be the next big move.
Follow Our Tradingview Account for More Technical Analysis Updates, | Like, Share and Comment Your thoughts

Skeptic | Why did Bitcoin grow? What’s the next move?Unemployment rate’s up...
lemme explain short and sweet. When unemployment —a key factor for setting interest rates —rises, the Federal Reserve’s got no choice but to lower rates so companies can hire. Lower rates = more liquidity = Bitcoin and stocks go up.
What’s the next move?
Around $ 120,000 , there’s about 1 billion in short liquidity positions. also it overlaps with the weekly pivot point level 4 . I see a high chance of correction or ranging here. Personally, I opened a position before the $ 110,513 breakout ( i shared in this analysis ) and only took profits. If you’re still holding, I suggest not closing yet—once the $ 110,000 resistance broke, Bitcoin’s major weekly trend woke up, so we could see more growth.
If this analysis helped you, hit that boost—it fuels my mission! 😊 Stay disciplined, fam! ✌️

#BTCUSDT: Major Bearish Correction?Bitcoin is currently undergoing a correction following its recent peak. While the initial price decline appeared insignificant, it has since experienced a substantial drop, suggesting a substantial volume of selling activity in the market.
We anticipate two potential areas where the price could reverse and resume its upward trajectory. These areas could lead to a price of 110,000, followed by 120,000, and ultimately reaching 150,000.
We strongly recommend that you implement rigorous risk management measures and conduct your own analysis before making any investment decisions.
Best regards,
Team Setupsfx_

BTC Leg2 115KBINANCE:BTCUSDT major movement from base 98K S to 106K $.BTC want to next movement to 115K $ but in middle of way 110K $ level there are sellers.
Support: 106.000 - 102.000
Resistance: 110.400 - 115.000
⚠️Control Risk Management

Historical Top?It wasn't triangle. Just one of the bull trap.
But how about this ath?
I think this is trap, too.
2021 April~December movement.
Do you remember at that time?
If you do, you won't open a short postion.
Finale makes incredible Alt BullRun, always.
This month is the most important for checking annual trend.
Skeptic | Bitcoin Deep Dive: Rate Hikes, War Tensions & TriggersInterest Rates: The Big Picture
Let’s start with the Federal Reserve’s move—interest rates jumped from 4.25% to 4.5% . What’s the deal? Higher rates mean costlier borrowing , so businesses and folks pull back on loans. This drains liquidity from risk assets like Bitcoin and SPX 500, slowing their uptrend momentum or pushing them into ranges or dips. Now, mix in the Israel-Iran conflict escalating ? Straight talk: risks are sky-high , so don’t bank on wild rallies anytime soon. My take? BTC’s likely to range between 97,000 and 111,000 for a few months until geopolitical risks cool (like Russia-Ukraine became “normal” for markets) and the Fed starts cutting rates. Those two could ignite new highs and a robust uptrend. Let’s hit the charts for the technicals! 📊
Technical Analysis
Daily Timeframe: Setting the Stage
You might ask, “If 100,000 support breaks, does that mean we’ve formed a lower high and lower low, flipping the trend bearish per Dow Theory?” Absolutely not! Here’s why: our primary uptrend lives on the weekly timeframe, not daily. The daily is just a secondary trend. If 100K cracks, it only turns the secondary trend bearish, leading to a deeper correction, but the major weekly uptrend stays intact.
Spot Strategy: No spot buys for now. Economic and geopolitical risks are too intense. I’ll jump in once things stabilize. 😎
Key Insight: A 100K break isn’t a death sentence for the bull run—it’s just a shakeout. Stay calm!
4-Hour Timeframe: Long & Short Triggers
Zooming into the 4-hour chart, here’s where we hunt for long and short triggers:
Long Trigger: Break above 110,513.92. We need a strong reaction at this level—price could hit it early or late, so stay patient for confirmation.
Short Trigger: Break below 101,421.65. Same vibe—watch for a clean reaction to tweak the trigger for optimal entry.
Pro Tip: These levels are based on past key zones, but time outweighs price. Wait for a reaction to nail the best entry. Patience is your edge! 🙌
Bitcoin Dominance (BTC.D): Altcoin Watch
As BTC dips, BTC.D (Bitcoin’s market share) is climbing, meaning altcoins are taking a bigger beating. Don’t touch altcoin buys until the BTC.D upward trendline breaks. They haven’t moved yet—you might miss the first 10-100%, but with confirmation, we’ll catch the 1,000-5,000% waves together. 😏
Shorting? If you’re shorting, altcoins are juicier than BTC—sharper, cleaner drops with more confidence. Patience, patience, patience—it’s the name of the game.
Final Thoughts
My quieter updates lately? Blame the geopolitical chaos, not me slacking . I’m hustling to keep you in the loop with clear, actionable insights. here, we live by No FOMO, no hype, just reason. Protect your capital—max 1% risk per trade, no exceptions. Want a risk management guide to level up? Drop a comment! If this analysis lit a spark, hit that boost—it keeps me going! 😊 Got a pair or setup you want next? Let me know in the comments. Stay sharp, fam! ✌️

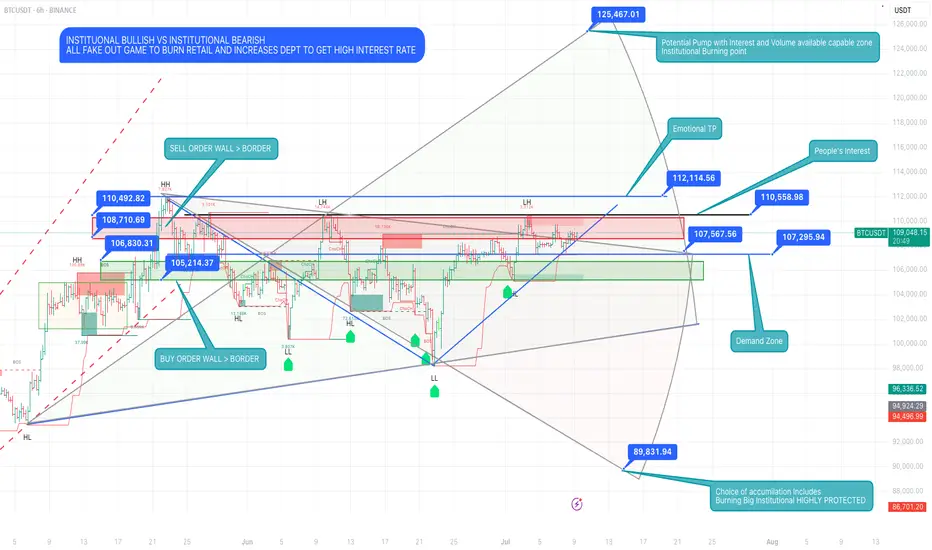
The Whale’s Blueprint: Read It Before It Happens🧠 The Real Game
Institutional Bullish vs Institutional Bearish — It Was Never About Direction.
This chart isn’t about setups.
It’s a blueprint of manipulation, a battlefield map where:
• Retail gets trapped at emotional highs
• Liquidity gets swept in layers
• Institutions reload in silence
• And the price becomes the puppet, not the player
🔺 Top Red Zones (106K–112K):
These aren’t resistance. They’re execution zones for sell walls, fake breakouts, and late long liquidations.
🔻 Green Demand Zones (105K & Below):
Not support. They’re reaction chambers — where whales absorb panic and retail exits in fear.
💥 125K is not a fantasy. It’s a controlled explosion waiting to happen —
But only if the trap is set right and the fuel (volume + interest) loads in.
🧱 Real accumulation doesn’t happen in comfort.
It happens in the shadows, at the edges of fear.
This isn’t price action.
This is power action.
⸻
“Most trade the surface.
Snipers wait beneath it…
and strike before the story reveals itself.”
#BTCUSDT #LiquidityGame #WhaleTrap #InstitutionalZones #SniperMindset #KaizenMethod #TheRealGame
BTC bullish sentiment and All time highs?BTC is printing a good structure and characteristics resembling the highs of 2021. 2025 is the only bullish year left before BTC crashes again.
Usually BTC is bullish in the end of the year. This OCT/NOV could print 130K-136k for btc before a fatal crash

Where Can Bitcoin Go? Part 8 –(Major Chart Update')First of all guys – I made the video! 🎥🔥 Watch the full breakdown before diving into the details below.
It explains everything visually, level by level. Don't miss it.
Now let’s get into the core of the analysis...
🚀📊 Where Can Bitcoin Go? Part 8 – The Final Test is Near! 🔥🔍
Welcome to Part 8 of “Where Can Bitcoin Go?” – the update of this long-running series. Since mid-2023, not much has changed in the structure. That’s the power of solid technical analysis – levels don’t lie.
🟨 The Setup
Bitcoin is now approaching a third test of a major structural resistance. If you’ve followed my 1-2-3 strategy, you know this is where decisions are made:
✅ Test 1: Rejection
✅ Test 2: Rejection
⏳ Test 3: Now pending… the TERMINAL and DECISIVE 'Breakout or Rejection', and this will change everything.
But here’s the deeper layer:
We’re not just testing one sequence. We now have two separate sets of 1-2 rejections —
🔹 One set from 2021 (the Red 1 and 2)
🔹 And a recent one in 2025 (the white 1 and 2)
This upcoming test is the third rejection attempt on both timeframes, making it a rare and extremely significant technical moment.
📐 Price is now near a critical ascending trendline around $115K–$116K, which has been the gatekeeper to parabolic moves in previous cycles.
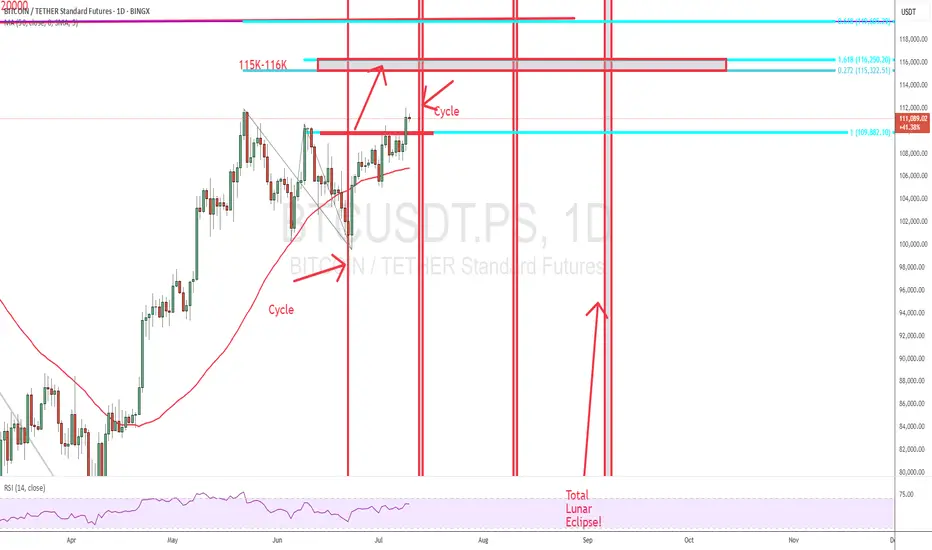
🔄 Based on historical halving cycles:
548 days post-halving in 2016 → ATH 2017
565 days post-halving in 2020 → ATH 2021
Halving #4 was in April 2024 → 👀 Could this point to a new ATH by end of 2025?
📊 Probabilities
🔹 83% chance we see the third test before year-end
🔹 57% chance of breakout
🔻 43% chance of rejection
⚠️ And here’s the reality check:
If we see that breakout — the market unleashes itself. We’re talking major pumps, potential follow-through moves, and price discovery into untouched zones like $188K, $197K, and beyond.
But... if we get rejected, it won’t be pretty. We could retest major levels like $66K or worse, and lose momentum that took years to build.
And unfortunately — this isn’t like 18K, or 40K, or even the 79K retest.
Things are much more complicated now.
The sentiment, the structure, the risk profile — they’ve all evolved. We cannot afford to have the same blind bullishness we had in those earlier phases. This is a mature part of the cycle, and it demands discipline over emotion.
💬 What’s your take?
Will Bitcoin finally break through?
Is this just another fakeout in disguise?
Are you feeling this same tension in the market?
Let’s talk structure. Let’s talk price. Let’s talk reality.
One Love,
The FXPROFESSOR 💙
Disclosure: I am happy to be part of the Trade Nation's Influencer program and receive a monthly fee for using their TradingView charts in my analysis. Awesome broker, where the trader really comes first! 🌟🤝📈

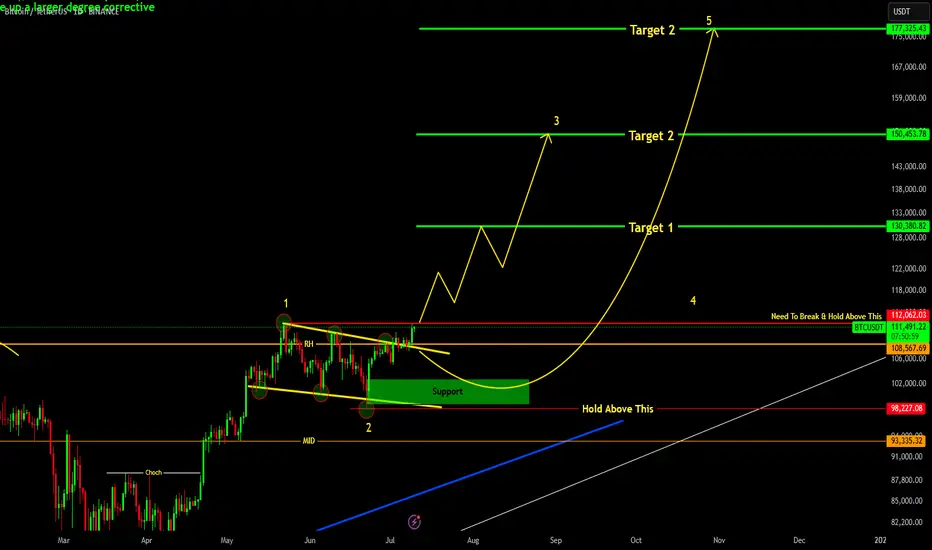
ARE YOU READY FOR 150K+ BTC RALLY !!!BTC has successfully broken out it's bull flag resistance and currently testing above it.
Major resistance resides above is 112K level , if we successfully break and hold above it then easy targets would be 130-150k levels.
Elliott Wave Count final targets 180k level.
If we goes below 106k level then we may see BTC getting into support region of 102-100K region.
For all of this, BTC should remain above 98K level.
The Critical Blue Line – Will Bitcoin Soar or Sink
🔹 Bitcoin Technical Analysis – Key Blue Line, Bear Trap Possibility & Long-Term Scenario
On the Bitcoin chart, the blue horizontal level has acted multiple times as both support and resistance. The price has broken it several times but failed to sustain above, indicating high-volume decision-making zones by institutions and large players.
📉 Why this pattern keeps repeating:
Strong supply and demand concentration at this level.
Inability to break and hold shows market indecision.
Repeated fakeouts are likely used to shake out weak hands.
🔍 Important hidden scenario: Bear Trap Potential
If the price dips below the blue line but quickly reclaims it, it may form a bear trap, tricking short sellers into entering prematurely. This move could ignite strong bullish momentum from trapped sellers and renewed buyers.
🔮 If price holds above the blue line:
Signals market strength and potential bullish structure shift.
Targets:
109,800
117,200
120,000+ (Long-term)
📛 If support fails again:
Retracement toward the lower channel near 101,000 or lower is possible.
📊 Conclusion:
This zone is one of the most critical decision points in the current market. Traders should combine volume, candlestick behavior, and confirmation signals to avoid getting trapped by fake breaks

BEst long on Btc is at $104 600CRYPTOCAP:BTC
Our plan is still bullish
But price reached VAH
That's why some pullback is possible
$104 600 is key zone for me. POC + VWAP. I`ll take a long trade in a case of local confirmation.

#BTC Update #6 – July 11, 2025🟠 #BTC Update #6 – July 11, 2025
Bitcoin has surged nearly 9% from the supply zone and is currently trading around the $119,000 level. However, looking at the current volume, the momentum seems to be fading.
If a correction takes place, the potential support zones are:
✨First stop: $114,000
✨Second stop: $113,000
✨Third stop: $111,500
After a pullback, the next target may be around $122,000. However, macroeconomic risks are rising. The U.S. is considering a 500% tariff on Russia imports, and in the past, even a 100% tariff triggered a sharp drop in Bitcoin.
Since BTC has already made a significant move up, I don’t think opening a Long or Short position is wise at the moment. Just observing for now.
