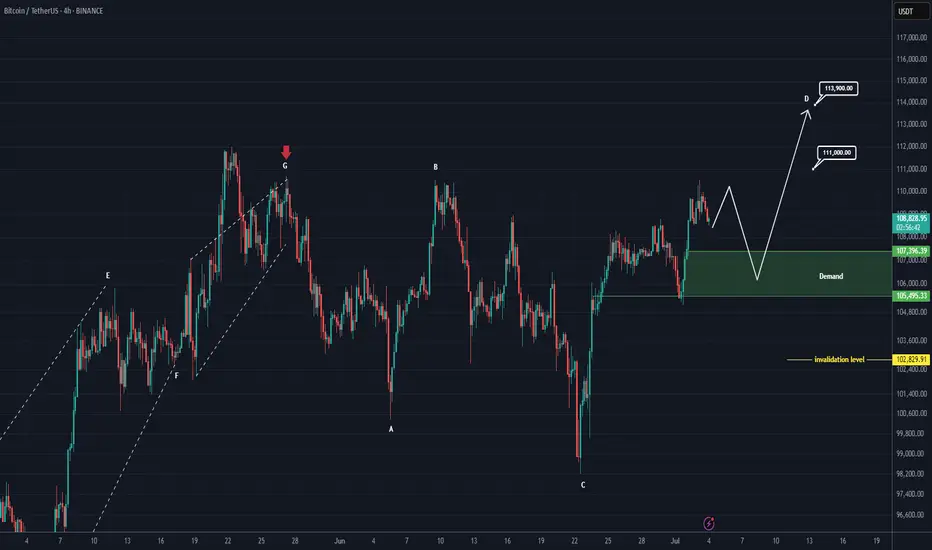
Bitcoin New Update (4H)This analysis is an update of the analysis you see in the "Related publications" section
If we were to publish an update for Bitcoin, wave D could move toward higher levels.
After hitting the green zone and gaining momentum, it could once again move upward to liquidate short positions.
In this update, we've naturally raised and revised the invalidation level.
The new targets have been marked on the chart.
A daily candle closing below the invalidation level would invalidate this analysis.
For risk management, please don't forget stop loss and capital management
Comment if you have any questions
Thank You
BTCUSDT.P trade ideas
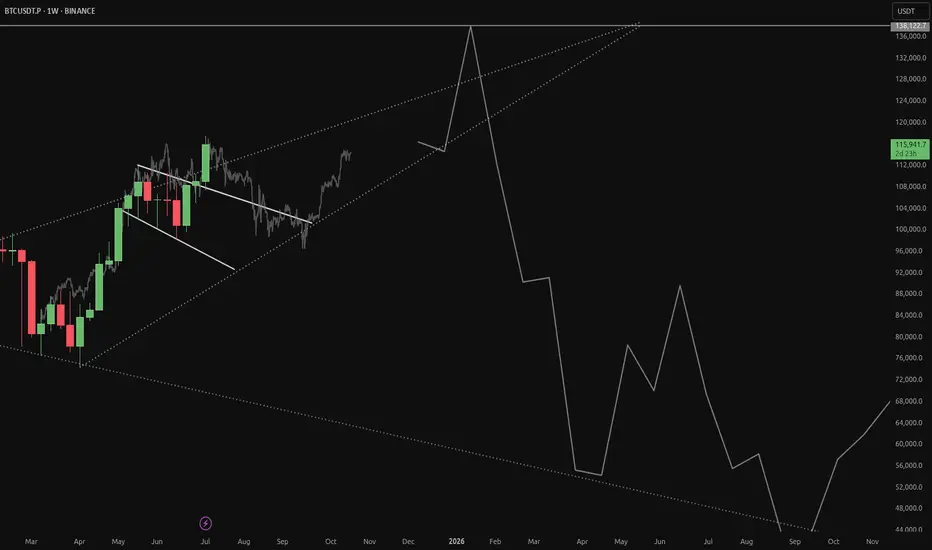
A bearish 12 Month candle could be in the cardsBitcoin made an yearly high of 20% after 6 months in on the yearly candle
This does not make me feel great about the rest of the year
a clear sell signal would be an higher timeframe close under 100k after an upthrust to new ath around 110k - 120k
around 50k-54k for me is an good buy level to build an longterm position:
0.382 fib retracement for an primary 1-2 wave
0.500 fib retracement from the 25k low
0.886 fib retracement from 49k low
50% pullback from current high to projected low
where will bitcoin go ? i don't know, but i do know where i want to buy and when i want to sell

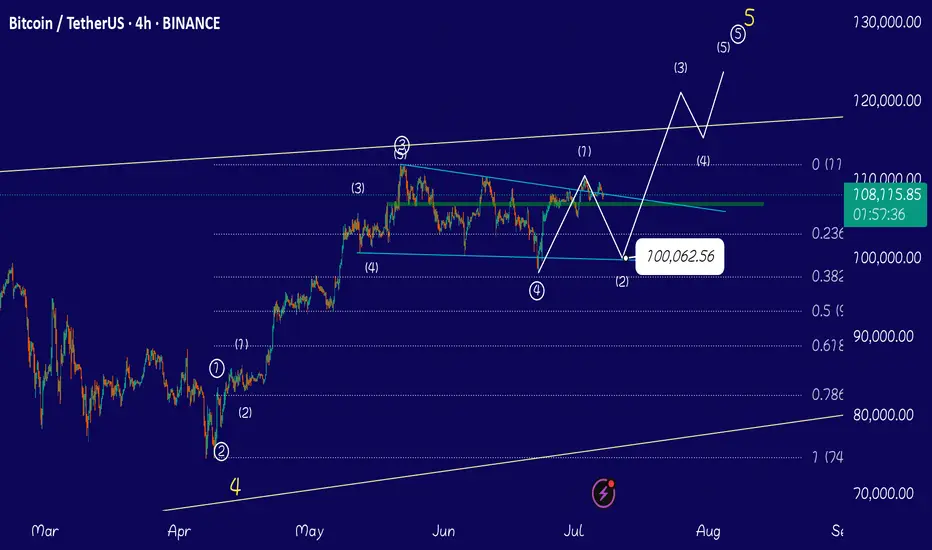
Wait for 100k ( read reasons)If you look at my chart you can see the truth, Elliott waves are well marked on the chart, we are now completing the micro wave 2 of the main wave 5, I expect the corrective micro wave 2 to correct the price to Fibonacci 0.78, which is exactly touching the lower descending line of the channel and includes the 100k price range. Wait for the micro wave 1 correction to complete and buy again in the 100k range. I will not open a short position and I advise you to wait for the price correction to 100k.
BITCOIN CRASH INCOMING!!! (Brace Yourself Now???) I am breaking down MARKETSCOM:BITCOIN and the potential completion of the 4th wave on an leading diagonal which might work as an early warning of a crash towards $93k!
Wait for the confirmations, and play the market with a proper trading strategy that you have backtested enough to be able to say that you will be long-term profitable. That means make sure your trading system is good enough that you always have an edge and a great enough money management system to make sure that you are giving your edge enough space to play out in the long run and be robust against losing streaks!

BTC , 4hr , BearishBTC is Forming a Pattern and it is at the top of the Another Pattern and It is facing rejection 3 Times from Above and now it is forming another pattern inside and Ready for Break Down of the Pattern , if it breaks the Pattern Down then it will be bearish almost 90% it will move to down side , if it has not given Breakdown and moving inside the small pattern then wait patiently and observe carefully .
Then it may also give Breakout for up side .
Follow Risk Management Properly
Follow for More Swing Ideas Like this .

BitcoinHello everyone, I have a opinion about bitcoin chart I analyzed bitcoin chart at monthly timeframe and it obviously related to Elliot waves and I combined it with price action and I extract some good information about Price Road of bitcoin so in my opinion bitcoin going to decrease and I show that on chart how bitcoin price will be behave.
Have a good trade

BTC up following H1 trend linePlan BTC today: 07 July 2025
Related Information:!!!
Bitcoin (BTC) trades slightly below $109,000 at the time of writing on Monday, following its highest weekly close on record. Institutional and corporate demand continues to serve as a key catalyst, with Metaplanet acquiring an additional 2,205 BTC on Monday, while US-listed spot Bitcoin Exchange Traded Funds (ETFs) saw over $769 million in net inflows last week.
As market participants assess the latest bullish indicators, focus now shifts to broader macroeconomic developments, including new trade-related headlines and reports suggesting that the administration of US President Donald Trump may extend the current tariff pause until August 1.
personal opinion:!!!
BTC moves sideways in the trend line, trend line support 108,300
Important price zone to consider :!!!
support zone : 108.300
Sustainable trading to beat the market

Bitcoin (BTC): Targeting $120K | Buyers Showing DominanceBitcoin is hovering still in between the old ATH area and the new, entering into a consolidation zone, which might be our breaking point.
Last week we saw the buyside dominance, which was backed by big institutions buy orders and short-term traders selling assets, giving us a sign of a potential bullish breakout—that's what we are looking for, a proper breakout from local resistance, which would then send the price towards our first target of $120K.
Swallow Academy

BTCUSDTThe Bitcoin market is overbought. I expect a change in trend. A diamond with traders' stop points will be great as a reversal pattern. Let's see

BTC LETS RETRY AGAINBINANCE:BTCUSDT.P Is gathering Bullish momentum again to try going war against that resistance. On this short video, i explained the reason why im looking to buy btc, Both entry and exist are on the video. Good luck to us all.

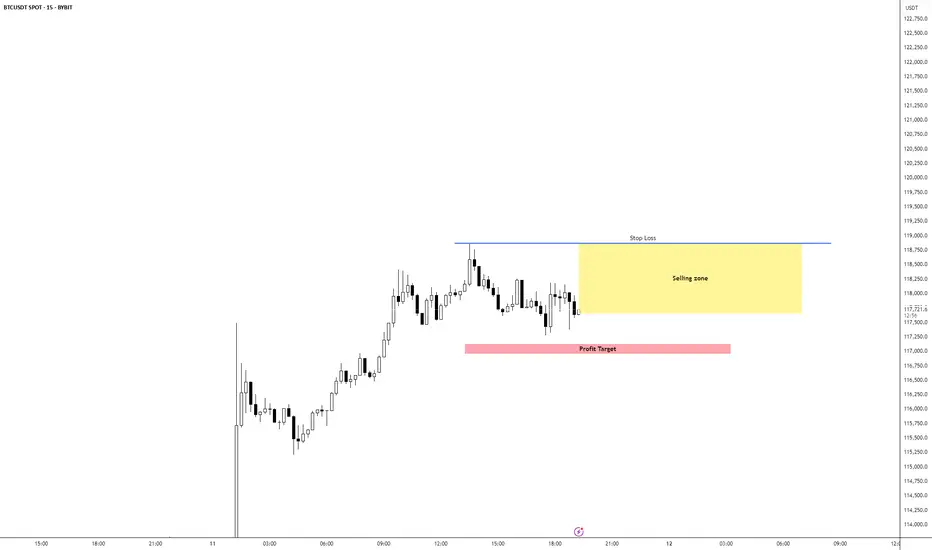
BTC/USD Short IdeaBTC/USD is currently bullish overall but seems overextended, Expecting a pullback to the 5m Equilibrium levels which would be our TP area. 1M has switched bearish adding confluence to our setup.
I would be layering short positions inside the yellow selling zone
Bitcoin Eyes $112K, Liquidity Magnet AheadCRYPTOCAP:BTC Eyeing Breakout?
Bitcoin is consolidating tightly between 107.7K and 108.3K after a strong bounce from local support.
Short-term support has formed near 107.7K, but there's still liquidity below ~106.5K that may get swept before the next move.
If BTC holds above 107.5K and breaks 108.3K cleanly, we could see a quick move toward the $110.6k – $112K liquidation zone, with ATH in sight.
According to HTF, we need a daily close above 110k to confirm it in the HTF.
The market remains bullish unless 106K fails.
Will the magnet zone pull us higher?
Like & follow for more sharp updates.
DYOR. NFA
CRYPTOCAP:BTC BITSTAMP:BTCUSD BINANCE:BTCUSDT

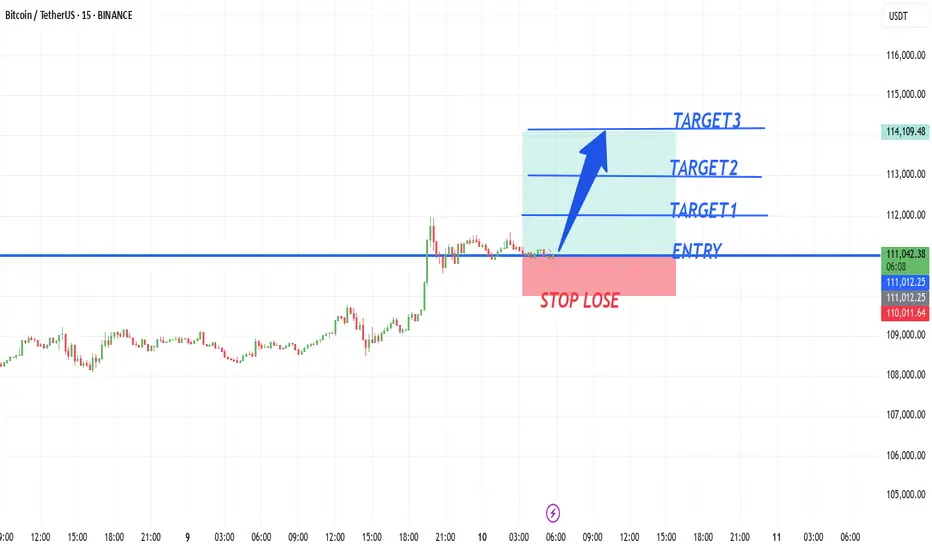
BTCUSD NEW LOOKBtcusd buy from 111,000,
target1 112,000
target2 113,000
target3 114,000
Stope lose 110,000
TRADE AT YOUR OWN RISK
DeGRAM | BTCUSD got out from the triangle📊 Technical Analysis
● Price reclaimed the purple 2-month trend cap and has “fixed” above the 107 k former supply, turning it into support; this validates the grey ascending triangle whose base lies on the channel mid-line.
● Triangle height and prior swing grid point to 112 k first, then the 114.9 k May high just beneath the channel ceiling. Invalid if candles sink back below 107 k.
💡 Fundamental Analysis
● Spot-ETF desks added >9 800 BTC since Friday while on-chain miner reserves stabilised, suggesting dwindling sell pressure just as U.S. CPI relief is lifting real-yield headwinds.
✨ Summary
Long 107–108 k; breakout >112 k opens 114.9 k. Bull view void on 4 h close <107 k.
-------------------
Share your opinion in the comments and support the idea with a like. Thanks for your support!

Bitcoin & new rallyBitcoin surpassed its previous all-time high of $112,000 and is now approaching $124,700, the third resistance level for July's pivot.

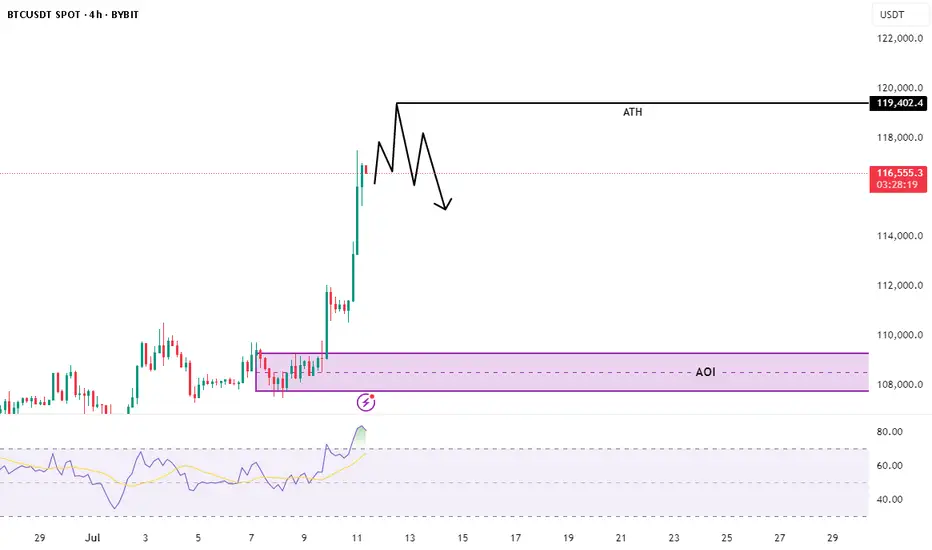
Chart Explanation: BTC/USDT (4H, Bybit)📊 Chart Explanation: BTC/USDT (4H, Bybit)
🟢 Current Situation:
BTC is pushing toward its All-Time High (ATH) level at $119,402.
We've seen a strong vertical rally with minimal pullbacks — classic "euphoria phase" behavior.
Price is currently around $116,500, getting close to major resistance.
⚠️ Key Observation – Bearish Divergence:
The Relative Strength Index (RSI) is showing bearish divergence:
Price is making higher highs
RSI is making lower highs
This signals momentum weakening, despite price moving up — a possible reversal warning.
🚫 Why No Trade (Yet):
You're not entering a position now because:
Price is near ATH — a major liquidity area where fakeouts are common
You expect a potential rejection or liquidity sweep near ATH
No confirmed reversal or entry trigger yet
🟣 What You're Watching:
The AOI (Area of Interest) marked around $108,000–$110,000
This is likely a previous consolidation or demand zone
If price retraces and gives a clean setup (e.g., bullish structure, volume, RSI reset), then you may consider a long entry
🔍 Summary:
You're being patient and strategic, observing potential weakness in momentum . now 119.4k will be next ATH. In my point of view .
No trade now — waiting for confirmation or a pullback into your AOI zone.
👉 Follow me on X for real-time market updates & trade ideas! 👇
#BTC #Bitcoin #Crypto #Trading #TA #RSI #Divergence
The Pattern That Could Launch Bitcoin, pt. 2There appears to be an IH&S pattern forming inside of the larger IH&S's right shoulder (see my previous post for the larger one). I've seen this happen a few times and then a break out upwards! Results may vary of course lol.
If it drops from here support could be at around $102k and then $100,500.

"Bitcoin, after breaking the resistance at $110,000"Bitcoin, after breaking the resistance at $110,000, could target $115,000 and $120,000 in the next steps."

07/07/25 Weekly OutlookLast weeks high: $110,529.95
Last weeks low: $105,108.81
Midpoint: $107,819.38
The "Big Beautiful Bill" was signed into law last week on the 4th July, a huge event in the financial world and undoubtedly the world of crypto. The debt ceiling is now instantly raised by $5T making risk-on assets even more appealing than ever, incoming demand shock will likely help BTC but also the struggling altcoin market as well.
Last week the BTC ETFs saw a net inflow of $294m. This takes the total 30-day inflows to nearly 50K BTC and this is before the big beautiful bill was passed. PA wise, BTC is still struggling to break the $110k level and flip ATH, however the consolidation just under ATH with increasingly shallow pullbacks suggests a run at the highs is in the near future IMO.
For this week US CPI & PPI data are the important release for the week. It's hard to tell if the data releases will actually provide any volatility this time around, they usually do but the FEDs refusal to act has made the last few CPIs very flat in terms of volatility for BTC.
Key battleground for me this week would be the midpoint, clearly last week provided good support, however a larger area of inefficiency rest just under that it so there is a natural pull for price to revisit those areas. Could be a choppy week once again...
Good luck this week everybody!

BITCOIN Bitcoin (BTC) has reached a new all-time high, trading around $111,000 to $112,000 per coin.
Key Highlights:
Bitcoin hit an intraday record high surpassing its previous peak of about $111,970 set in May 2025.
market capitalization exceeding $2 trillion.
The rally is attributed to a combination of factors including:
A weakening US dollar, which reduces opportunity cost for holding Bitcoin.
Increased demand from institutional investors, with nearly $1 billion net inflows into Bitcoin and Ethereum ETFs in early July.
Positive market sentiment following statements on monetary policy and expectations of potential Fed rate cuts.
Recent significant moves include the transfer of 20,000 BTC from wallets inactive for 14 years, highlighting long-term holder activity.
Price Data Snapshot:
Current Price: Around $111,000
Day’s High: Approximately $112,152
Market Cap: About $2.02 trillion
Volume (24h): Over $57 billion
Year High: $112,021 (intraday)
Summary:
Bitcoin continues its strong upward momentum in mid-2025, breaking new records amid supportive macroeconomic conditions such as a softer dollar and growing institutional adoption. The cryptocurrency remains volatile but shows robust demand as a digital asset and inflation hedge.
#BTC

Bitcoin Breaks All-Time High: What’s Next?Bitcoin (BTC) has once again captured the world’s attention by smashing through its previous all-time high (ATH). This milestone has sparked excitement and speculation across the crypto community and beyond. But the key question remains: Will BTC continue its upward trajectory, or is a correction on the horizon?
Long-Term Outlook: The Bullish Case
In the long run, the fundamentals for Bitcoin remain strong. Several factors support a positive outlook:
Institutional Adoption: More institutional investors are entering the market, providing greater liquidity and legitimacy.
Scarcity and Halving Cycles: Bitcoin’s fixed supply and periodic halving events historically drive long-term price appreciation.
Macro Trends: Ongoing concerns about inflation and fiat currency devaluation continue to make BTC an attractive hedge.
Given these dynamics, we believe Bitcoin’s long-term trajectory remains upward.
Short-Term Caution: A Correction May Be Coming
While the long-term view is optimistic, the short-term picture may be less rosy:
Overheated Market Indicators: Rapid price surges often lead to overbought conditions, increasing the likelihood of a pullback.
Profit-Taking: After breaking ATH, some investors may lock in gains, adding selling pressure.
Technical Resistance: Historical patterns suggest that corrections often follow major breakouts.
We anticipate a potential correction, possibly pulling BTC back to the $90,000 range. This adjustment could unfold in the coming week or weeks as the market digests recent gains.
What Should Investors Do?
Stay Calm: Volatility is part of the crypto landscape. Corrections are healthy for sustainable growth.
Focus on Fundamentals: Remember why you invested in BTC in the first place.
Consider Dollar-Cost Averaging: Spreading out purchases can help mitigate the impact of short-term swings.
Conclusion
Bitcoin’s break above its all-time high is a testament to its enduring appeal and the growing confidence of investors. While a short-term correction may be likely, the long-term case for BTC remains compelling. As always, prudent risk management and a focus on fundamentals are key to navigating the exciting—and sometimes turbulent—world of crypto.
Do not consider it as investment advice.
#crypto #bitcoin #analysis

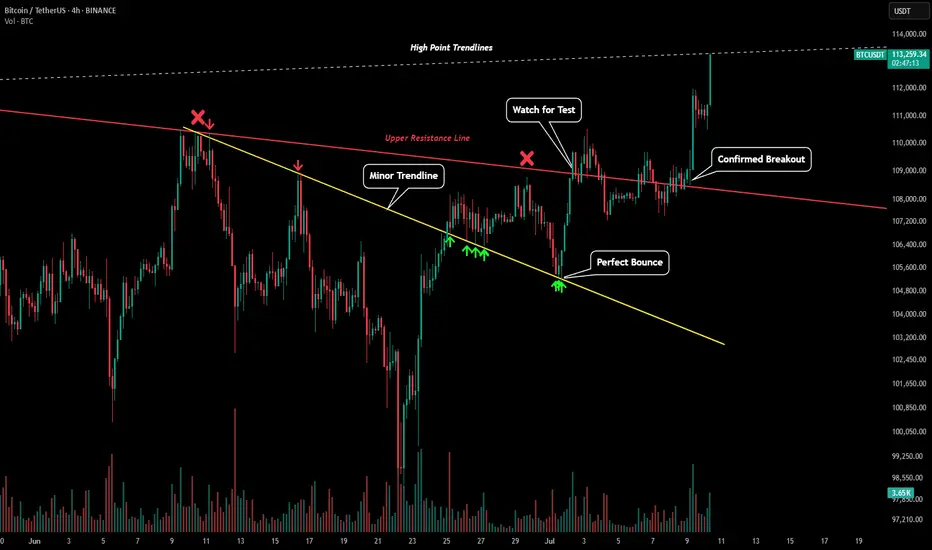
BTC - ATH After Perfect PredictionPlease refer to our previous post:
After a picture perfect test of our lower trendline of support price rallied back to our red trendline.
Price chopped back and forth around this trendline for a few days before finally confirming the breakout. Now BTC has hit a new all time high and is currently at our white upper high point trendline. Looking for confirmation closes above to continue the rally.