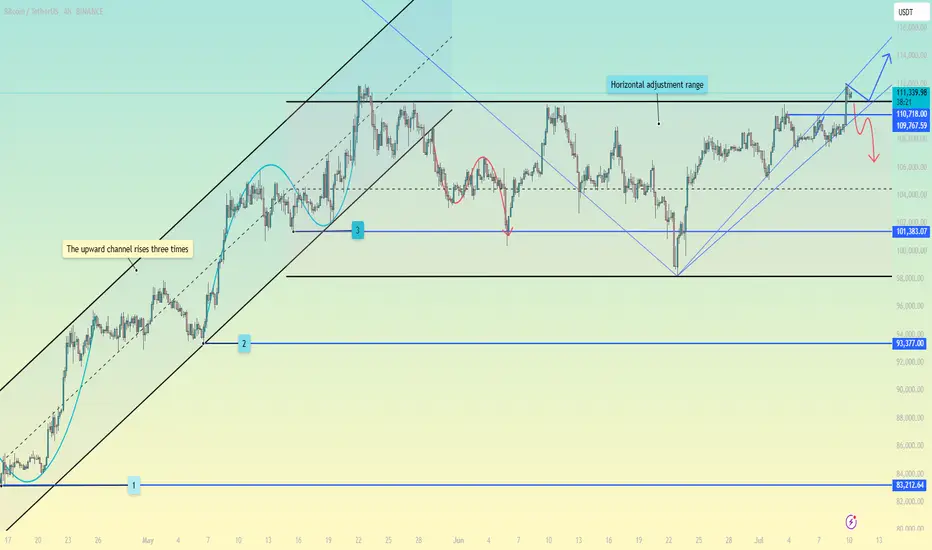
BTC USDT ANALYSESBitcoin (BTC) is currently forming an ascending triangle, which is typically a bullish continuation pattern. If BTC breaks out of the triangle to the upside, my target would be around $130,000.
However, we also have a long-term ascending trendline that BTC has been respecting for a significant period. If BTC fails to break out of the ascending triangle, we may see a pullback toward this trendline. Notably, there is also a strong demand zone in that area, which could act as support.
On the weekly timeframe, there is a visible regular bearish divergence—a bearish signal that suggests a potential slowdown or correction. If the divergence plays out, a realistic downside target could be around $100,000 to $98,000.
BTCUSDT.P trade ideas

HolderStat┆BTCUSD fixed above the triangleBINANCE:BTCUSDT is rebounding from a consolidation base at $106,000 with strong bullish structure. The triangle breakout and recent higher lows point toward a move to $115,000–$120,000 if momentum continues.

Bitcoin: New highs are ready to break
In-depth analysis of the Bitcoin market: Breakthrough opportunities under the resonance of fundamentals and technical aspects
I. Overview of the current market situation
As of July 10, 2025, the price of Bitcoin is currently in a high consolidation stage after breaking through $112,000 to set a record high. The highest increase in 24 hours was 3%, and the cumulative increase this year was about 19%, showing a strong upward momentum2. However, market volatility is still significant. The latest data shows that the amount of liquidation in a single day is as high as $510 million, involving more than 100,000 traders2, reminding investors to maintain risk awareness in optimism.
II. Key drivers of fundamentals
1. Improved policy environment
US cryptocurrency regulation is turning to a loose direction. The regulatory roundtable promoted by the new SEC Chairman Paul Atkins is expected to implement new policies in July-August, aiming to define clear regulatory boundaries, reduce law enforcement actions, and promote the United States to become a global crypto asset center2. This policy shift has significantly boosted market confidence and removed some obstacles for institutional funds to enter the market.
2. Institutional funds continue to pour in
The net inflow of spot Bitcoin ETFs in 2025 has reached US$14.4 billion2, indicating that the traditional financial market's acceptance of Bitcoin continues to increase. 135 listed companies such as MicroStrategy have included Bitcoin in their balance sheets2, and corporate-level allocation demand has formed a stable buying support. The recent weaker-than-expected US employment data has strengthened the Fed's expectations of a rate cut in September, further prompting funds to accelerate the inflow of risky assets such as Bitcoin2.
3. Market narrative upgrade
The role of Bitcoin has shifted from "alternative currency" to "reserve asset", and CICC pointed out that its positioning as "digital gold" is widely accepted2. National-level allocation cases are also increasing, such as Pakistan's announcement of the establishment of a strategic Bitcoin reserve2. This narrative shift is reshaping the value assessment framework of Bitcoin.
4. Macroeconomic linkage
The Federal Reserve's monetary policy remains a key variable. Trump's chief adviser recently publicly accused Powell of being the "worst Federal Reserve chairman in history", saying that if interest rates are not cut on July 29, "catastrophic consequences"3 may occur3. At the same time, the US trade policy of imposing a 50% tariff on copper (to be implemented as early as August 1) has exacerbated market uncertainty3. Historical data shows that Bitcoin often performs well in liquidity easing cycles, and the current market's expectations for interest rate cuts are forming potential positives.
III. In-depth analysis of technical aspects
1. Key price structure
After breaking through the horizontal consolidation range, Bitcoin is currently in a high-level accumulation state:
Upper target: The historical high of $112,000 is the recent key psychological resistance, and a new upside space may be opened after breaking through2
Recent support: $110,700 (top and bottom conversion position) constitutes the first line of defense
Trend support: $109,700 (upward trend line) is an important line of defense for bulls
Key defense: There is significant liquidity support in the $108,500 area, and a break below may drop to the $106,000-107,200 support area26
2. Technical indicator signals
Trend indicators: Moving averages of all major time frames (5-day to 200-day) remain in a bullish arrangement, confirming that the overall upward trend remains unchanged4
Momentum indicators: RSI is in the neutral area near 53, not showing overbought; MACD remains positive despite slightly weakened momentum6
Volatility analysis: Bollinger Bands continue to narrow, and EMA on the 4-hour chart converges, which usually indicates that major fluctuations are coming5
Derivatives data: Binance CVD (cumulative volume increment) continues to be negative, indicating that selling pressure exists, but spot buyers successfully defend key support5
3. Main capital movement
The disk shows that $23 million of unfulfilled sell orders are piled up at the $110,000 mark, forming a significant resistance9. At the same time, there is a $17.27 million buy support in the $108,388-108,500 range9, indicating that the long and short sides are fiercely competing in the current area. This large order distribution pattern suggests that the market may test the upper resistance first and then fall back to consolidate.
IV. Operational strategy recommendations
1. Trend trading strategy
Long position layout: Establish long orders in batches in the support area of 110,700-109,700 US dollars, and set the stop loss below 108,500 US dollars
Breakthrough chasing long: If the price stands above 112,000 US dollars, you can add positions, and the target is 114,500 US dollars (potential area for short squeeze)2 and higher
Target setting: Short-term target is 112,000 US dollars, and the medium-term target can be seen to 116,000 US dollars2 or 137,000 US dollars4 according to the volume
2. Reversal trading strategy
Short opportunity: If it falls below $108,500 and then rebounds to $109,700 without breaking, you can try shorting with a light position, and set the stop loss above $110,700
Deep correction: If it falls below the $108,500 support, it may test the $106,000-107,200 area6, and then you can observe the stabilization signal
3. Risk management points
Position control: The risk of a single transaction should be controlled within 2% of the total funds
Leverage use: It is recommended not to exceed 3-5 times leverage in the current high volatility environment
Event sensitive period: Focus on key points such as the Federal Reserve’s interest rate decision on July 29 and the implementation of the tariff policy on August 137
V. Outlook and conclusion
1. Short-term (1-3 months) outlook
Bitcoin is currently in a favorable environment where technical and fundamental resonances occur. If ETF fund inflows continue or the Federal Reserve releases a clear signal of interest rate cuts, the price is expected to test $116,0002. However, we need to be alert that regulatory policies that fail to meet expectations or macroeconomic deterioration may lead to a pullback to the $102,000-105,000 support zone27.
2. Long-term (until 2030) value prospects
Cycle model: According to the peak rule of 550 days after halving, this round of bull market may have a 2-3 month peak window2
Technical target: Long-term rising channel points to $168,500 (Fibonacci extension level)2
Scarcity drive: After the halving in 2030, the supply will further shrink, coupled with the global inflation hedging demand, and the highest is expected to reach $660,4712
3. Summary of investment advice
Bitcoin's breakthrough of $112,000 is the comprehensive result of policy, liquidity and narrative upgrades2. The current technical structure remains bullish, and it is recommended to focus on low-multiple ideas, focusing on the $110,700-109,700 support area. Investors should pay attention to low-friction investment channels such as spot ETFs, avoid high leverage operations, and prepare for potential fluctuations. As the institutionalization process accelerates, Bitcoin is completing the transformation from a marginal asset to a mainstream configuration option. Long-term investors can seize the layout opportunities brought about by every major pullback.
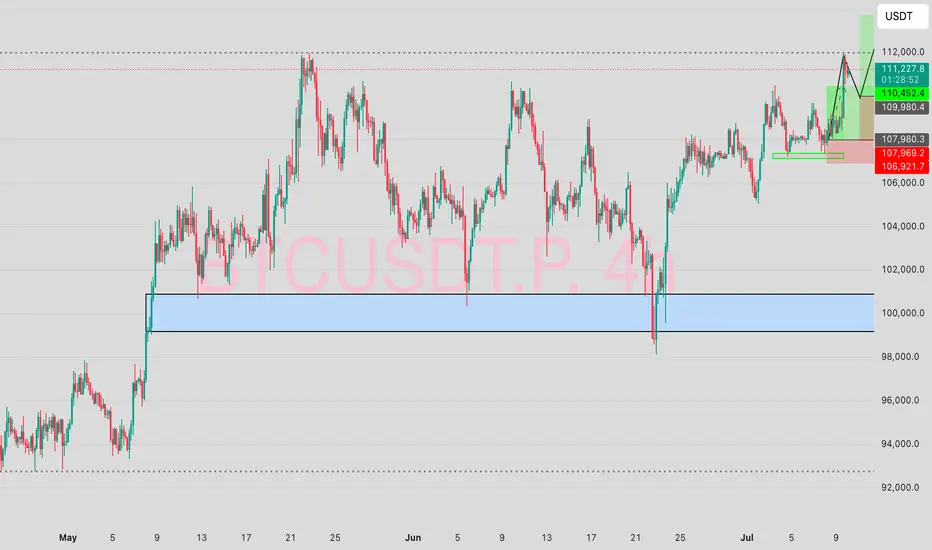
BTCUSDT Forming Bullish WaveBTCUSDT is currently setting up a promising bullish wave pattern, showing signs of steady upward momentum that could deliver a healthy 10% to 20% gain in the near term. After a period of consolidation and healthy correction, Bitcoin’s price is starting to push above key resistance levels, indicating strong buying interest and renewed confidence among long-term investors and institutional traders alike. This setup has caught the attention of market participants looking to capitalize on Bitcoin’s next potential leg up.
Recent on-chain data and technical indicators show a robust foundation for this bullish wave pattern, with increasing trading volume supporting the upward move. Bitcoin continues to hold above crucial support zones, which adds further confidence for buyers aiming to ride the trend towards its next major psychological levels. The overall sentiment remains positive as Bitcoin’s dominance in the crypto market signals strength, helping to drive capital inflow from altcoins back into the king of crypto.
As we know, Bitcoin’s market behavior often sets the tone for the entire crypto ecosystem, so this bullish scenario could spill over into other major altcoins as well. Traders and investors should keep an eye on key resistance zones, potential breakout levels, and any sudden surges in volume that confirm the wave pattern is playing out as expected. Patience and disciplined risk management will be essential to maximizing profits during this phase.
✅ Show your support by hitting the like button and
✅ Leaving a comment below! (What is You opinion about this Coin)
Your feedback and engagement keep me inspired to share more insightful market analysis with you!

BTC in a Bearish 60 min movementBTC in a 60-minute bearish move
It appears that BTC has already completed the C leg of a 60-minute harmonic pattern near 109680
BTC is forming a larger corrective pattern rather than taking a true direction, thus increasing the chances of completing this pattern before moving up again.
Currently, the price is positioned to complete the D leg of the pattern near 105700
I am looking for short-term targets near 107240; 106275 and 105715
You may find more details in the chart!
Thank you and Good Luck!
PS: Please support with a like or comment if you find this analysis useful for your trading day

BITCOIN ATH? More to come!With BTC seeing a new ATH, speculations are there for whether it continues in upward projection or falls back.
My prediction is simple, CRYPTOCAP:BTC will do a temporary pullback around the 109,000$ region and goes back up to around 113,000$ within the shortest time.
This temporarily pullback will be a result of buyers who already took their profits. Of course, Institutional investors are even more poised to buying more.
News may impact this projection but investors are willing to see it fly.
Ultimately, you can never go wrong with Bitcoin buy.
#DYOR #NFA
DeGRAM | BTCUSD once again trading above $105k📊 Technical Analysis
● Fresh bounce off the confluence of the 8-month up-sloping purple trend-line and 102-103 k green demand box prints a higher-low inside the rising wedge, keeping bulls in control despite June’s pull-back.
● Price is reclaiming the minor down-trend line from the 12 Jun high; a daily close above 106 k confirms a bear-trap and unlocks the 111.8-112.5 k supply at the wedge cap.
💡 Fundamental Analysis
● Spot-ETF desks absorbed >5 400 BTC in the last three sessions while exchange reserves fell to a four-year low, signalling supply drain.
● Cooling US PCE expectations trimmed real yields, and Mt Gox repayment delays ease overhang fears—both supportive for risk assets.
✨ Summary
Long 102–104 k; hold above 106 k targets 111.8 k → 115 k. Bull thesis void on a 16 h close below 99 k.
-------------------
Share your opinion in the comments and support the idea with a like. Thanks for your support!

Bitcoin sell short bigBitcoin is ready to fill the big gap and the biggest liquidity, the range of 25,000 and 19,000 can be a good time to buy Bitcoin.

BTC Daily Chart Analysis
Trend: BTC is currently trading within a short-term descending channel.
Strong Resistance: Zone around $110k–112k, multiple failed retests observed.
Key Support: Around $105k (Ichimoku Cloud upper edge & recent local bottom).
RSI: Clear bearish divergence indicating weakening bullish momentum.
Elliott Wave: Completed 5-wave impulse from $75k up to $112k, now correcting (likely waves 4-5 within the descending channel).
Fibonacci: Breakout above $110k targets approximately $117k (1.414 Fib extension). Failure to break may lead price back down toward $102k.
Probability:
Bullish scenario (35%): Clear breakout above $112k, targeting $117k.
Bearish scenario (65%): Rejection at $112k, potential retest toward $105k → $102k.
⚠️ Recommendation: Closely watch the $110k zone. If BTC fails to clearly breakout, consider defensive actions (reducing position size, risk management).

BTCUSDT – Calm Before the BreakoutBitcoin is holding firmly above the ascending trendline, consolidating within the accumulation range of $98,000 to $117,000. The current structure suggests that buyers remain in control, especially after a strong rebound from the $98,450 support zone.
In terms of news, BTC has been slightly affected by market concerns over new U.S. tariffs. However, on-chain data still shows strong accumulation around the $108,000 level. If this base holds, BTCUSDT could break out toward the $117,424 target in the near term. Conversely, if the trendline fails, the $98,000 level will be the final stronghold for the bulls.

waiting for new ATH this week , btc💎 BTC PLAN UPDATE FOR THE BEGINNING OF THE WEEK (07/07)
NOTABLE BITCOIN NEWS: Focus on 4 key points today
1. Elon Musk – “America Party” to Support Bitcoin
Elon Musk has confirmed that his newly formed political party, the “America Party,” will support Bitcoin, stating that “fiat is hopeless.”
2. Cup-and-Handle Pattern Analysis: Targeting $230K
According to technical analysis by Cointelegraph, BTC is forming a “cup and handle” pattern on the monthly chart, which could lead to a target peak of $230,000 if a breakout continues.
3. BTC Price Holds Steady Around $109K Amid “Crypto Week” and Trade Tensions
Bitcoin is currently trading around $109,000, influenced by “Crypto Week” and concerns over U.S. tariffs.
4. Institutional Inflows Increase, But Market Demand Weakens
According to CoinDesk, institutional investors are still buying BTC, but not enough to offset declining demand in the spot market, negatively affecting short-term market sentiment.
⸻
TECHNICAL ANALYSIS PERSPECTIVE
The short-term trend remains bullish. However, the steep slope of the trend indicates buying pressure is still being contested and unstable.
BTC remains stuck at Fibonacci levels—pay close attention to the resistance zones at 112K and 115K. If these two resistance levels are broken, investors may get the answer to whether BTC can approach the 120K level.
In the short term, both gold and BTC are moving sideways, indicating that market liquidity and investor capital are unstable and being divided across multiple portfolios.
==> This analysis is for reference only. Wishing all investors successful trading!

Monday - Trade of the day Hello I took a week off from trading — life got a bit hectic 🌀. Looking back, I actually needed that break from the charts 🧠💆♂️.
But we’re back this week! Let’s see how many X’s we can cream off the market 💸🔥
Here are the immediate levels I’m watching 👀 — mainly some range deviations from both internal and external ranges.
If we break either side of the range, I’ll be looking to enter from the last supply or demand zone for a continuation 🚀📉📈
That said, I’ll stay mindful of any supply and demand zones that could get in the way ⚠️📊
Let’s get it 💪📅
Bitcoin scalp long back to $112,000 ATHTook a risky scalp long on bitcoin just now.
Aiming for $112000-$112720
1.44-2.78RR
Stop: $110670

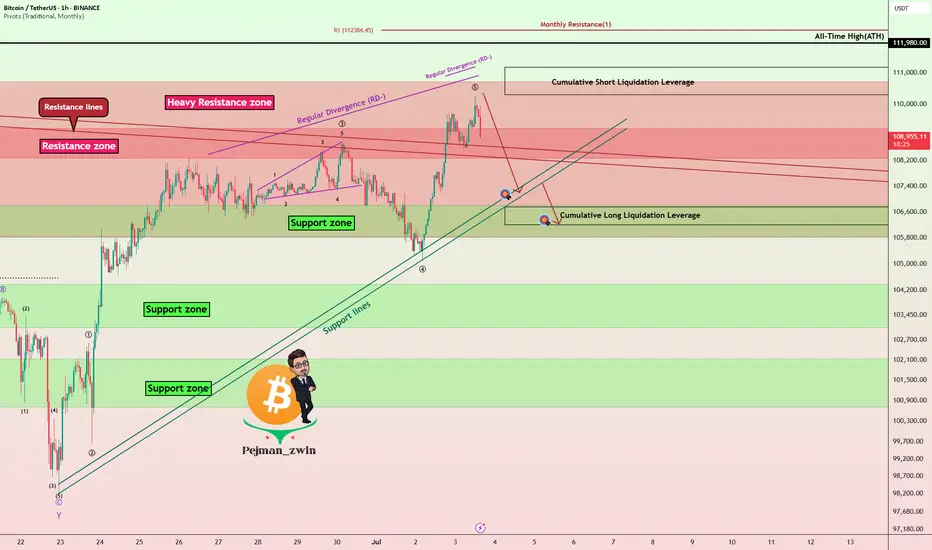
Bitcoin Roadmap => Short-termBitcoin ( BINANCE:BTCUSDT ) is moving above a Heavy Resistance zone($110,720-$105,820) , Cumulative Short Liquidation Leverage($110,300-$111,177) and is approaching All-Time High(ATH) .
Do you think Bitcoin will create a new All-Time High(ATH) in this rally?
In terms of Elliott Wave theory , Bitcoin's rise over the last two days appears to have been in the form of wave 5 .
Also, we can see the Regular Divergence(RD-) between Consecutive Peaks.
I expect Bitcoin to start declining in the coming hours. Targets are marked on the chart.
Cumulative Long Liquidation Leverage: $106,750-$106,202
Note: Stop Loss(SL)= $111,223
Please respect each other's ideas and express them politely if you agree or disagree.
Bitcoin Analyze (BTCUSDT), 1-hour time frame.
Be sure to follow the updated ideas.
Do not forget to put a Stop loss for your positions (For every position you want to open).
Please follow your strategy and updates; this is just my Idea, and I will gladly see your ideas in this post.
Please do not forget the ✅' like '✅ button 🙏😊 & Share it with your friends; thanks, and Trade safe.
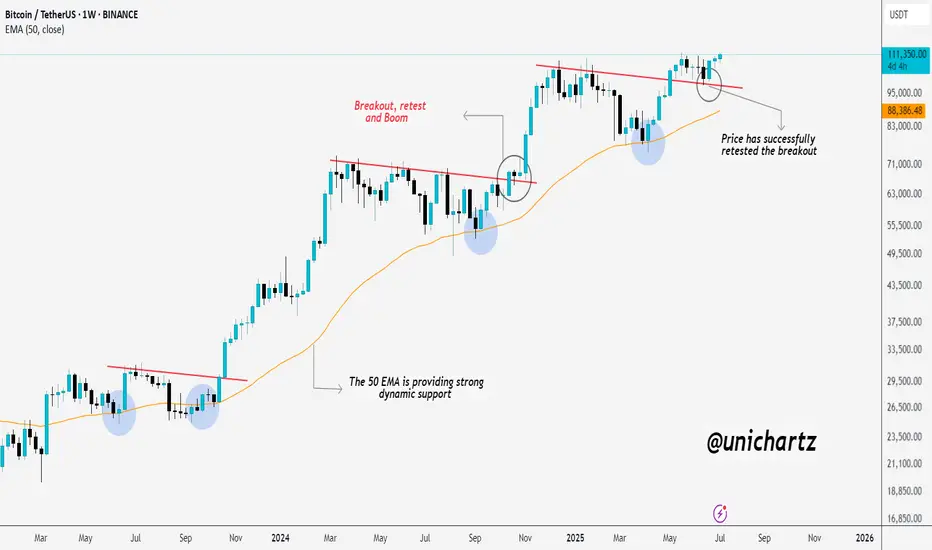
50 EMA Magic: Bitcoin Explodes After Perfect Retest!CRYPTOCAP:BTC just made a new All-Time High (ATH) — exactly as mentioned!
It broke out, retested perfectly, and blasted off.
The 50 EMA is acting like a rocket launchpad, giving price solid support every time.
SPXBank of America expects SPX to close 2025 near 6,300, with a 12‑month projection of 6,600. They note ongoing stagflation risks and do not expect rate cuts this year .

When will the media talk about BTC so I can SELL?!?!?!Waiting for the mainstream media to talk about BTC and the mass to buy bitcoin so I can sell my BTC LOL, I HAVE A WEDDING TO PAY!

Bitcoin will Return all-time high Interestingly Bitcoin (BTC) has not been particularly impressive over the weekend, which has been a somewhat consistent theme of the cryptocurrency market so far in the year 2025. The premier cryptocurrency continues to hover around the $108,000 mark, showing signs of indecision amongst the investors.
Resistance zone 111K
Support zone 107K
The conversation has been about when the Bitcoin price will return to its all-time high. Interestingly, the latest on-chain data shows that investors are becoming increasingly confident in the long-term promise of the flagship cryptocurrency.
Hope you can understand all our chart Pattern According the Bitcoin analysis.
Thanks for your Support.
if you found this analysis share you Opinion in comments I'm Tankful from you.

Bitcoin Elliott WaveI am currently short Bitcoin and I think the top is in
With this post, I am expressing my thoughts on where Elliott Wave stands per my perspective
In addition, I am also tracking Pitchfork of proposed wave 1 and 2. Getting out of that default pitchfork (if we drop this hard) will likely indicate that my bearishness is correct and we are in wave 3 potentially, which indicates bear market
My short position is open both on Ethereum and Bitcoin


[SeoVereign] BITCOIN Bearish Outlook – July 9, 2025We are the SeoVereign Trading Team.
With sharp insight and precise analysis, we regularly share trading ideas on Bitcoin and other major assets—always guided by structure, sentiment, and momentum.
🔔 Follow us to never miss a market update.
🚀 Boosts provide strong motivation and drive to the SeoVereign team.
--------------------------------------------------------------------------------------------------------
Hello.
This is SeoVereign.
As of July 9, 2025, I present a bullish outlook on Bitcoin.
This idea is an extension of the analysis posted on July 6.
Therefore, it will be easier to understand this analysis if you first read the July 6 idea.
The position reached the second target price and then showed a downward movement.
In this idea, harmonic 0.382 and 1.618 patterns have been additionally identified, and accordingly, I plan to continue holding the long position entered from the July 6 entry point.
The average target price has been set around 109,150 KRW.
I will continue to track the situation, clarify the rationale, and provide updates through this post.
Wishing you continued good fortune.
Sincerely,
SeoVereign

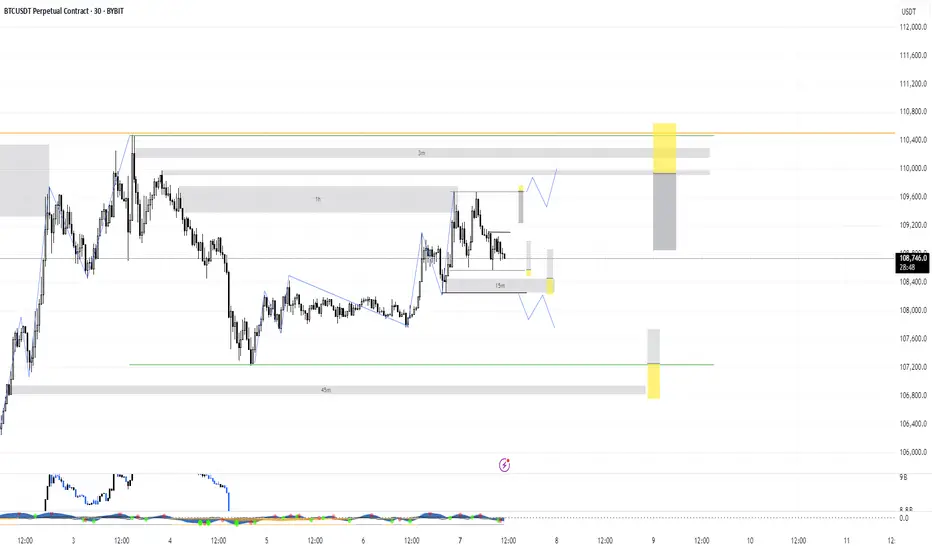
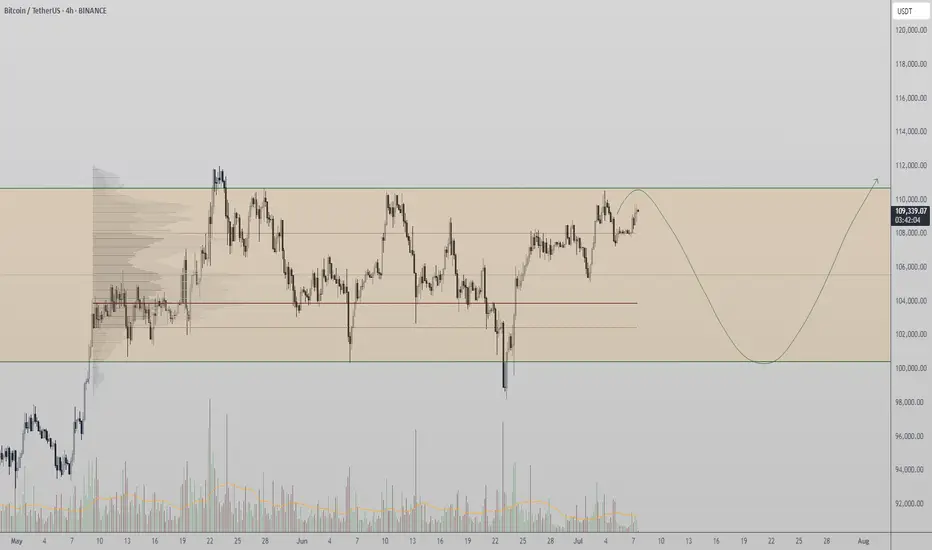
Bitcoin Tests Range High Again — Will This Time Be the Breakout?Bitcoin is once again at the top of its multi-week range, testing resistance near previous highs. A decisive breakout remains elusive as price struggles to sustain momentum without volume confirmation.
Bitcoin is back at a familiar technical level — the top of its long-standing trading range. After a weekend rally that pushed price toward range resistance, BTC now finds itself hovering near the weekly open, raising questions about whether this move will finally lead to a breakout or simply mark another deviation. With historical price action showing repeated failures at this level, all eyes are on volume and confirmation to validate the next directional leg.
Key Technical Points:
- Range High Resistance Reached Again: BTC testing resistance zone that has capped price for weeks
- Weekend Pump, Weekday Fade: Price surged over the weekend but is now settling near the weekly open
- Volume Still Lacking: No breakout confirmation without a strong influx in volume
The recent price surge in Bitcoin occurred over the weekend — a time when liquidity is typically thinner and institutional volume is reduced. While this move did push BTC back into the upper portion of its range, it’s important to recognize that the price is once again stalling near the range high. This level has historically acted as a firm resistance, and prior attempts to break above it have resulted in deviations followed by re-entries into the range.
This time is no different — so far. The current consolidation just below the high suggests the market is undecided, awaiting further confirmation through volume or macro developments. Without a high-time-frame close above the range resistance — and without meaningful volume behind it — the likelihood of this being another deviation remains high.
It’s also worth noting that BTC is back near the weekly open, which suggests the weekend rally may lack sustainability. In similar past instances, Monday retracements have confirmed that weekend pumps were driven by thinner liquidity and lacked conviction. Until proven otherwise, this appears to be more of the same.
From a structural standpoint, Bitcoin continues to trade within a well-defined horizontal range. This means oscillations between the range low and range high are still valid expectations until a breakout or breakdown occurs. These types of consolidations often persist until a major catalyst, and while the breakout is inevitable, it hasn’t happened yet.
Expect Bitcoin to continue ranging between its established high and low unless volume confirms a true breakout. A failure to hold above the current highs may trigger another rotation back toward range support.
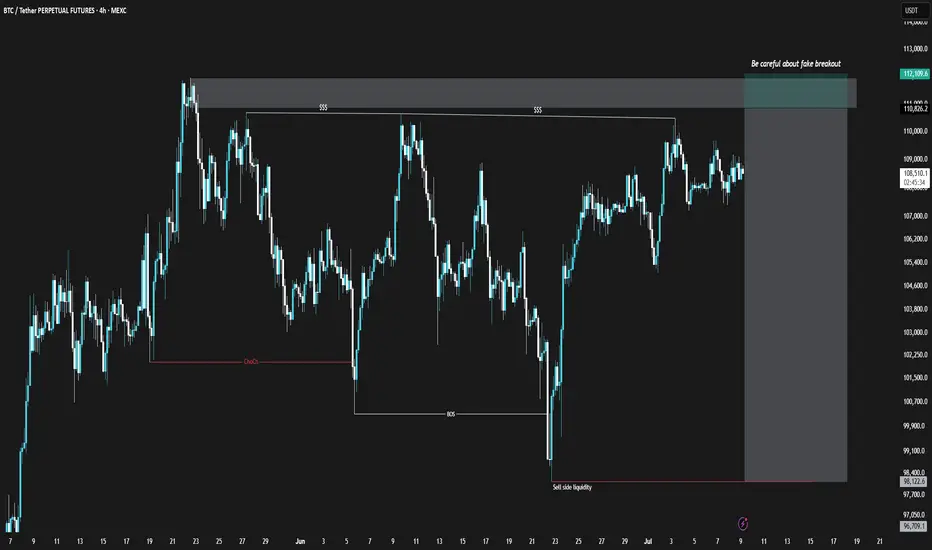
BTCUSDT Short Position (25/Jul/9)Bitcoin, similar to the TOTAL chart, is showing weakness in its bullish momentum. However, unlike TOTAL, the divergence in Bitcoin is clearly noticeable. Additionally, within the marked zone on the Bitcoin chart, there is a possibility of a fake breakout and liquidity grab. I suggest entering only with proper confirmation.
⚠️ This Analysis will be updated ...
👤 Sadegh Ahmadi: GPTradersHub
📅 2025.Jul.9
⚠️(DYOR)
❤️ If you apperciate my work , Please like and comment , It Keeps me motivated to do better