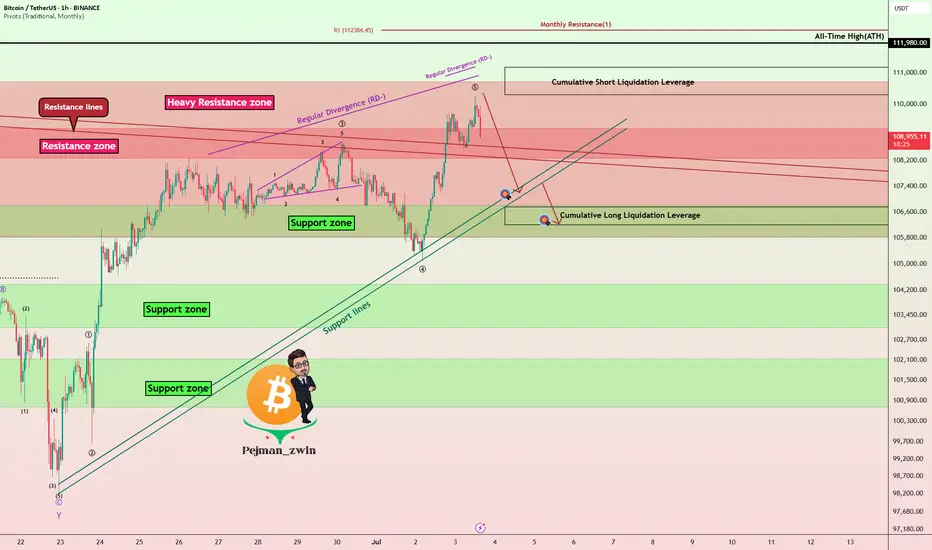
Bitcoin Roadmap => Short-termBitcoin ( BINANCE:BTCUSDT ) is moving above a Heavy Resistance zone($110,720-$105,820) , Cumulative Short Liquidation Leverage($110,300-$111,177) and is approaching All-Time High(ATH) .
Do you think Bitcoin will create a new All-Time High(ATH) in this rally?
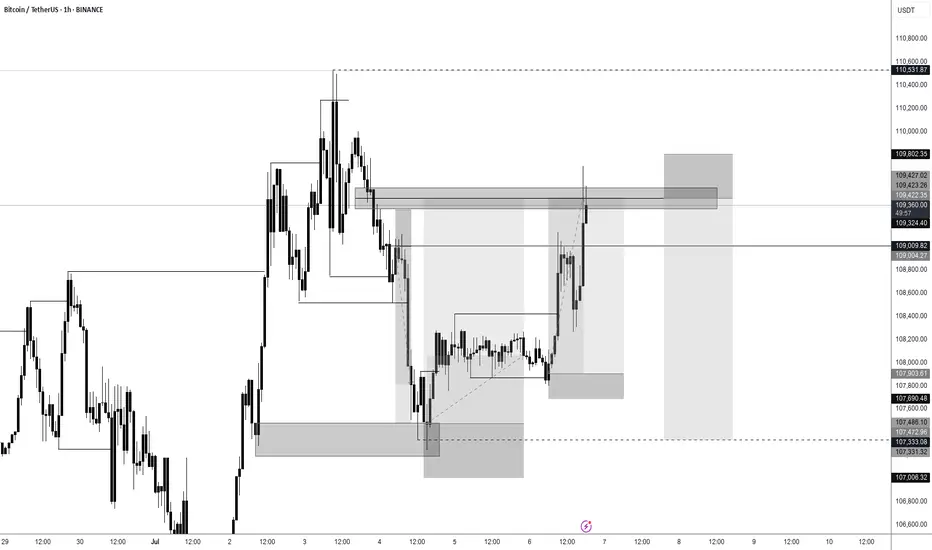
In terms of Elliott Wave theory , Bitcoin's rise over the last two days appears to have been in the form of wave 5 .
Also, we can see the Regular Divergence(RD-) between Consecutive Peaks.
I expect Bitcoin to start declining in the coming hours. Targets are marked on the chart.
Cumulative Long Liquidation Leverage: $106,750-$106,202
Note: Stop Loss(SL)= $111,223
Please respect each other's ideas and express them politely if you agree or disagree.
Bitcoin Analyze (BTCUSDT), 1-hour time frame.
Be sure to follow the updated ideas.
Do not forget to put a Stop loss for your positions (For every position you want to open).
Please follow your strategy and updates; this is just my Idea, and I will gladly see your ideas in this post.
Please do not forget the ✅' like '✅ button 🙏😊 & Share it with your friends; thanks, and Trade safe.
BTCUSDT.P trade ideas
Bullish on $BTC🧠 Wyckoff Overview
🔻 This chart follows Accumulation Schematic #1 in Wyckoff theory.
🔻 The Spring phase (Phase C) is confirmed.
🔻 BTC has broken out from the accumulation zone.
🔻 We are now in Phase D, expecting a move into Phase E (new ATH).
📊 Technical Details
🔻 Accumulation zone: Around $72,000 – $88,000.
🔻 Spring (Phase C): A fakeout happened near $68,000, matching Wyckoff structure.
🔻 Breakout is confirmed after price moved above the downtrend line and Ichimoku cloud.
🔻 Main resistance: $95,000 – currently testing the supply zone.
🔻 Target: If breakout continues, BTC could reach a new ATH above $110,000.
📈 RSI and Volume
🔻 RSI at 66.71: Not overbought yet, still has room to go up.
🔻 Volume is increasing along with the breakout → shows strong buying pressure.
🎯 Personal Prediction
🔻 If BTC holds above $92,000 – $95,000 and continues to consolidate:
→ Short-term goal: $100,000
→ Mid-term goal (Wyckoff Phase E): $110,000 – $112,000

Bitcoin BTC Trade Plan: Watching for Breakout or Pullback Entry📊 Currently watching BTC (Bitcoin) as price action remains bullish overall, but we're approaching a key decision point 🎯
💹 Price is pushing higher, but with some signs of exhaustion after the recent rally ⚠️ — and with the weekend approaching, we could either see a continuation higher or a healthy pullback
I’m keeping an eye on two potential trade scenarios:
1️⃣ A break and clean retest of the recent high, which could offer a continuation long if momentum follows through 🚀
2️⃣ A retracement into equilibrium — a deeper pullback toward fair value 📉 — which could also present a high-probability long setup if confirmed with structure and reaction 📈
Either way, I’m letting the market reveal its hand and waiting for one of these setups to play out before committing 💡
💬 Not financial advice — always assess your own risk and confirm with your own analysis.

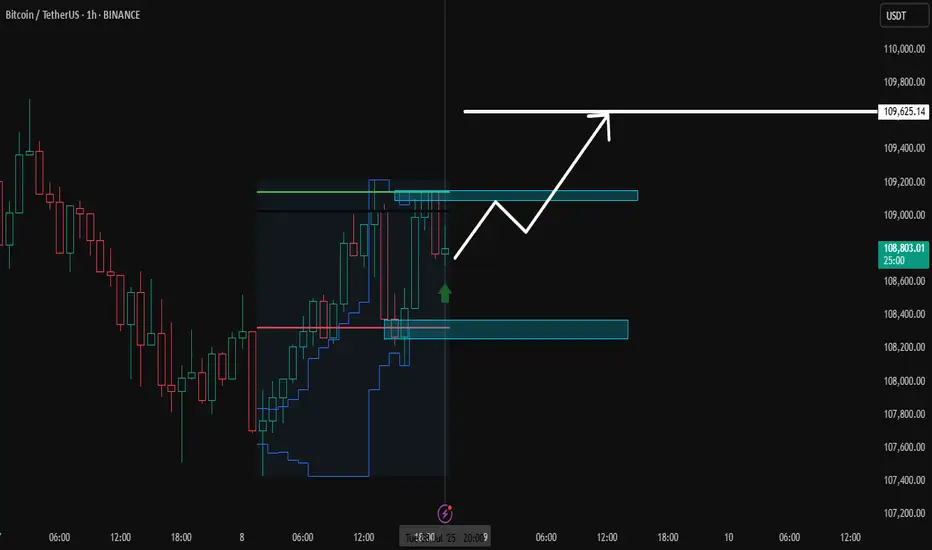
bitcoin in 1hour timeframeIn line with the previous analysis, the likely path for Bitcoin on the one-hour timeframe looks like this...follow for more...
Down for BitcoinHi traders,
Last week Bitcoin finished the correction down and went up again.
But this does not look like an impulse wave.
At the moment there's a small correction up so we could see another move down.
Let's see what the market does and react.
Trade idea: Wait for a change in orderflow to bearish and a correction up on a lower timeframe to trade shorts.
If you want to learn more about trading FVG's with wave analysis, please make sure to follow me.
This shared post is only my point of view on what could be the next move in this pair based on my analysis.
Don't be emotional, just trade your plan!
Eduwave

BTC Forming Second Diamond: New ATH Targeting $115K–$120KAfter topping out at the previous ATH, Bitcoin formed a classic diamond top pattern which triggered a drop to the $98,115 level. Now, Bitcoin appears to be forming a second diamond — but this time, the breakout structure suggests a bullish reversal rather than a top.
This second diamond formation indicates consolidation before a strong upward move, potentially driving BTC toward a new all-time high between $115K and $120K.
Watch for confirmation of the breakout. If price holds above key resistance levels post-pattern, the bullish scenario gains strength.

BTCUSDTPreferably suitable for scalping and accurate as long as you watch carefully the price action with the drawn areas.
With your likes and comments, you give me enough energy to provide the best analysis on an ongoing basis.
And if you needed any analysis that was not on the page, you can ask me with a comment or a personal message.
Enjoy Trading ;)
Bitcoin (BTC): Bullish as Long as Buyers Hold EMAs | $112K Next?Bitcoin buyers have taken full control since bouncing from EMAs on the 2nd of July (where also our entry point was sitting last week).
Since then we have seen decent buyside dominance and we are looking for further pressure from buyers, which would result in a retest of the current ATH area, but keep in mind—we are in a very dangerous zone (near a new ATH where buyers are still showing dominance which is giving us a sign that this is not yet the full potential of the coin).
We are bullish as long as we are above the EMAs!
Swallow Academy

btc/usdtI think it's time for Bitcoin to grow. It doesn't matter what the news is. This time, Bitcoin and Tether's dominance have reached their peak and are ready to make Bitcoin grow. This is my analysis. What do you think?

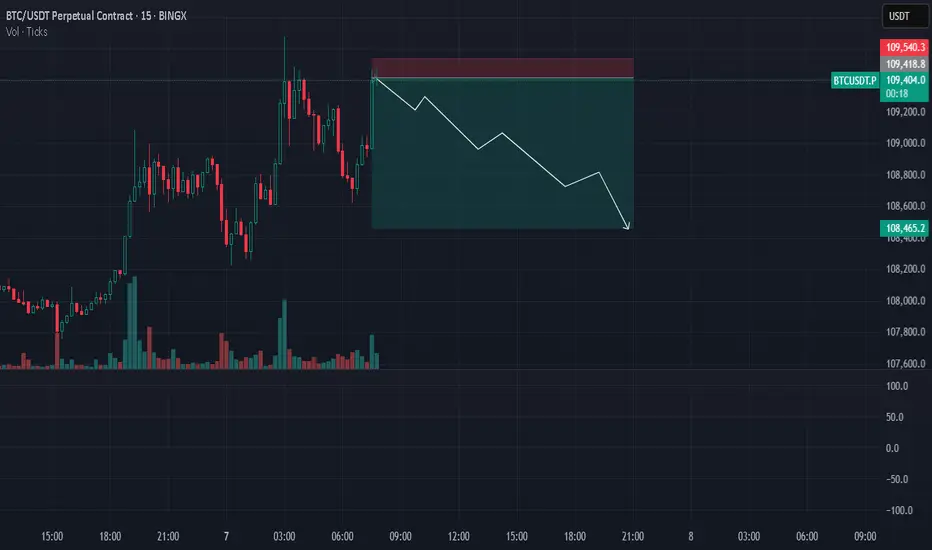
BTC there was a limit seller yesterday 109700 BTC there was a limit seller yesterday 109700 . Today I'm looking at sales locally

BTC - Bulls Getting Ready!!Hello TradingView Family / Fellow Traders. This is Richard, also known as theSignalyst.
📈BTC has been bullish trading within the flat rising wedge marked in blue and it is currently retesting the lower bound of the wedge.
Moreover, the orange zone is a strong demand.
🏹 Thus, the highlighted blue circle is a strong area to look for buy setups as it is the intersection of demand and lower blue trendline acting as a non-horizontal support.
📚 As per my trading style:
As #BTC approaches the blue circle zone, I will be looking for bullish reversal setups (like a double bottom pattern, trendline break , and so on...)
📚 Always follow your trading plan regarding entry, risk management, and trade management.
Good luck!
All Strategies Are Good; If Managed Properly!
~Rich

Bullish?This range looks like it wants to break to the upside. Maybe one more drop to 107.6K as a fakeout — but that remains to be seen.

Can #BTC reach a new high?📊Can #BTC reach a new high?
🧠We cannot be too optimistic before we break through ATH, because the daily adjustment expectation still exists.
➡️We are currently in a heavy resistance area near 110,000. This is our third test. Regardless of whether we can successfully break through, don’t chase the rise here, because the cost-effectiveness is not high. If you want to go long, you should also wait patiently for the callback to occur before considering it. Or wait for the callback after breaking through ATH before considering it.
➡️If you want to participate in short trading, you can only participate in a small amount with ATH as a defensive point. Or wait for the rebound after breaking through the upward trend support line before participating.
🤜If you like my analysis, please like 💖 and share 💬
BITGET:BTCUSDT.P

BTCUSDT Forming Bullish WaveBTCUSDT is currently setting up a promising bullish wave pattern, showing signs of steady upward momentum that could deliver a healthy 10% to 20% gain in the near term. After a period of consolidation and healthy correction, Bitcoin’s price is starting to push above key resistance levels, indicating strong buying interest and renewed confidence among long-term investors and institutional traders alike. This setup has caught the attention of market participants looking to capitalize on Bitcoin’s next potential leg up.
Recent on-chain data and technical indicators show a robust foundation for this bullish wave pattern, with increasing trading volume supporting the upward move. Bitcoin continues to hold above crucial support zones, which adds further confidence for buyers aiming to ride the trend towards its next major psychological levels. The overall sentiment remains positive as Bitcoin’s dominance in the crypto market signals strength, helping to drive capital inflow from altcoins back into the king of crypto.
As we know, Bitcoin’s market behavior often sets the tone for the entire crypto ecosystem, so this bullish scenario could spill over into other major altcoins as well. Traders and investors should keep an eye on key resistance zones, potential breakout levels, and any sudden surges in volume that confirm the wave pattern is playing out as expected. Patience and disciplined risk management will be essential to maximizing profits during this phase.
✅ Show your support by hitting the like button and
✅ Leaving a comment below! (What is You opinion about this Coin)
Your feedback and engagement keep me inspired to share more insightful market analysis with you!

BTCUSDT | 30-min & 4H Outlook🔍 Structure & Price Action
BTC is trading within a rising wedge (blue lines) nearing apex — typical bearish setup.
Price is repeatedly getting rejected near macro trendline (~108.8K–109K).
30-min shows clean breakdown from lower wedge support, retesting the zone now.
On 4H, BTC is still under key resistance zone between 109.6K–110.4K, previously rejected twice.
🔻 Bearish Signals
Multiple Sell signals on both timeframes.
Bearish divergence visible in RSI and MACD on 4H.
Volume spike on the breakdown → confirming sellers in control.
🔑 Key Levels
Support: 107.7K (current zone) → loss opens path to 106.6K, then 104.4K.
Resistance: 108.9K–109.4K = confluence of EMA cluster + macro TL + Fib zone.
📊 Indicators (4H)
RSI dropping from mid-zone (~48), no bullish momentum
DMI shows increasing ADX with -DI over +DI → trend strengthening bearish
TSI & Wave Trend both curling down
Stochastic in overbought, starting to reverse
🎯 Summary
Bias: Bearish below 108.6K
Invalidation: Bullish breakout above 109.6K + volume close
Setup: Watch for retest and rejection at ~108.4K–108.6K = clean short trigger
Next Targets: 107.2K → 106.6K → 104.5K

Bitcoin overall: likely still headed down for time beingI expect a short move up followed by a bigger retracement. While I’d try a long at the lower indicated range, a move further, below it, is certainly possible.

BTC - Fly High or Just Nuke down?As depicted earlier in the earlier drawing, 109,850 and now little bit more push to fall it down!

BTC BEARISH IDEAL HOT BTC bullish ideal, BTC buys where Sensational and i dont expect the sell to be les either me and my whole theam eat let get it with BTC
Bitcoin pump back to $110450 todayStop: $108326
50% Tp at $109,550
25% tp at $110,450
Exit at $111,950
DTT Strategy

$BTC/USDT daily chart $121K next.CRYPTOCAP:BTC just broke out of a descending wedge on the daily chart, a strong bullish signal.
It’s now holding well above key support and the 50-day moving average, showing buyers are in control.
If BTC stays above $106,400, we could see a move toward $121K next.
DYRO, NFA


BITCOINBITCOIN ,we are seeing some liquidity and a break of our 4hr supply roof ,if we return to retest in the same zone 108k-107.99k , we might take long position .first target 111k 113k and 116k.
take profit is key, trading is logical probability. If you dont take profit and secure it, the market will turn back and take both your capital and profit because its probability.
