BTC - Are you the one who is long?If yes! Book, Looks like a LIQ hump trap here! Wait for 105k smooth, or let it fall to retrace up to 109,860 to initiate!
BTCUSDT.P trade ideas

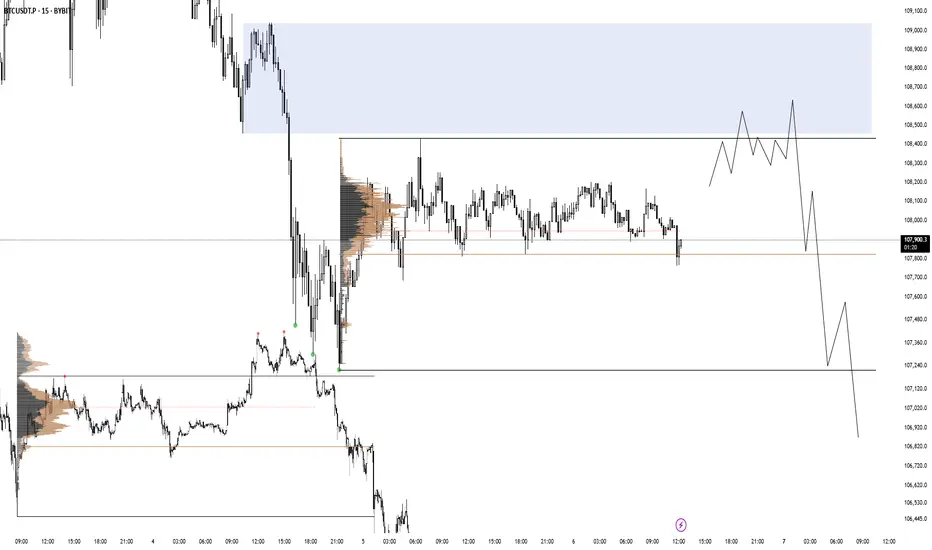
BTC 06.07.25There is a range imbalance with no price action in discount after BTC accumulated on friday afternoon. I am looking for a valid distribution like in the picture on the left.
bitcoin long trade setup ALL trading ideas have entry point + stop loss + take profit + Risk level.
hello Traders, here is the full analysis for this pair, let me know in the comment section below if you have any questions, the entry will be taken only if all rules of the strategies will be satisfied. I suggest you keep this pair on your watchlist and see if the rules of your strategy are satisfied. Please also refer to the Important Risk Notice linked below.
Disclaimer

BTCUSDTIt seems that the price of $110,000 is a strong resistance for Bitcoin, and as long as the price is below $110,000, its trend is bearish, and we can consider the targets of $107,000 and $105,000 for it.

TradeCityPro | Bitcoin Daily Analysis #119👋 Welcome to TradeCity Pro!
Let’s go over the analysis of Bitcoin and the key crypto indexes. As usual, in this analysis I’m going to review the futures triggers for the New York session.
⏳ 1-Hour Timeframe
Yesterday, the price broke out of the range box between 108619 and 110256 that I had marked for you, and with the heavy selling volume that entered the market, this bearish move took place.
✔️ This move continued to the 107448 zone, and as you can see, we are now in a consolidation and rest phase, and once again the volume has dropped significantly.
✨ As I mentioned in yesterday’s analysis, I believe this low volume will persist through the weekend, and for a solid move to happen, we’ll need to wait for the new week to begin.
💥 For now, the price has room to move up to 108619 and perform a retracement. A break above the 50 zone on the RSI greatly increases the likelihood of this move.
📊 If selling volume re-enters the market and the price moves downward, the short trigger we have is the 107448 level, and breaking it could start the next bearish leg.
📈 For a long position, the price must first stabilize above 108619, and then, if we see that buying volume continues and increases, we can enter a long position. The main trigger will be 110256.
⭐ I myself won’t be opening any positions for now and will wait until the market shows some proper volume and trend before entering. If you plan to open a position based on these triggers, I suggest you take on very little risk so that in case your stop-loss is hit, you don’t lose much money.
👑 BTC.D Analysis
Let’s look at Bitcoin dominance. Yesterday, dominance touched the trendline I had marked and is still dealing with this dynamic resistance.
💫 A bottom has formed at 65.38. If this bottom is broken, we’ll get confirmation of rejection from the trendline, and dominance could have a bearish move down to 65.04.
⚡️ If the trendline is broken instead, we’ll have a new trigger at 65.52, and breaking it would confirm a bullish reversal in dominance. The main trigger will still be a break of 65.64.
📅 Total2 Analysis
Now let’s move on to Total2. This index dropped to the 1.13 zone and has now pulled back to 1.14. It seems like it’s getting ready for another downward move.
☘️ If Bitcoin dominance gets rejected from the trendline and moves down, and if Bitcoin moves upward, Total2 could make a very sharp move.
🔑 Even if Bitcoin drops, Total2 might range or even move up. For now, our short trigger is 1.13, and aside from 1.14, we don’t have any specific long trigger.
📅 USDT.D Analysis
Finally, let’s look at Tether dominance. This index made a bullish move to 4.85 after breaking 4.78 and is now in a corrective phase.
📊 If 4.85 is broken, the next bullish leg could continue up to 4.93. If a correction happens, dominance might pull back to 4.78.
❌ Disclaimer ❌
Trading futures is highly risky and dangerous. If you're not an expert, these triggers may not be suitable for you. You should first learn risk and capital management. You can also use the educational content from this channel.
Finally, these triggers reflect my personal opinions on price action, and the market may move completely against this analysis. So, do your own research before opening any position.

BTCUSDT – Accumulation Confirmed? Wyckoff Blueprint Playing Out Bitcoin continues to compress inside a defined range, resting above both a rising trendline and a former resistance turned support zone. This structure fits cleanly within a Wyckoff-style Accumulation Phase (B-C).
We’re now at a critical moment where smart money may be absorbing supply, preparing for the next phase.
🔍 Key Observations:
Range-bound price action with higher lows and muted volume
Spring-like wick and recovery from the bottom of the range
Support holding at prior breakout zone and ascending trendline
Structure shows signs of stealth accumulation with a possible breakout ahead
Sideways movement with fading volatility
Gradual compression within the range
Strong support defended multiple times (might make the support weaker as well !)
A potential spring/retest event may already be in play
You’ll see fakeouts, wicks, and hesitation in this phase — designed to trap weak hands. But the underlying behavior points to preparation, not distribution.
The quiet before the markup. Let the market reveal its hand. 📈

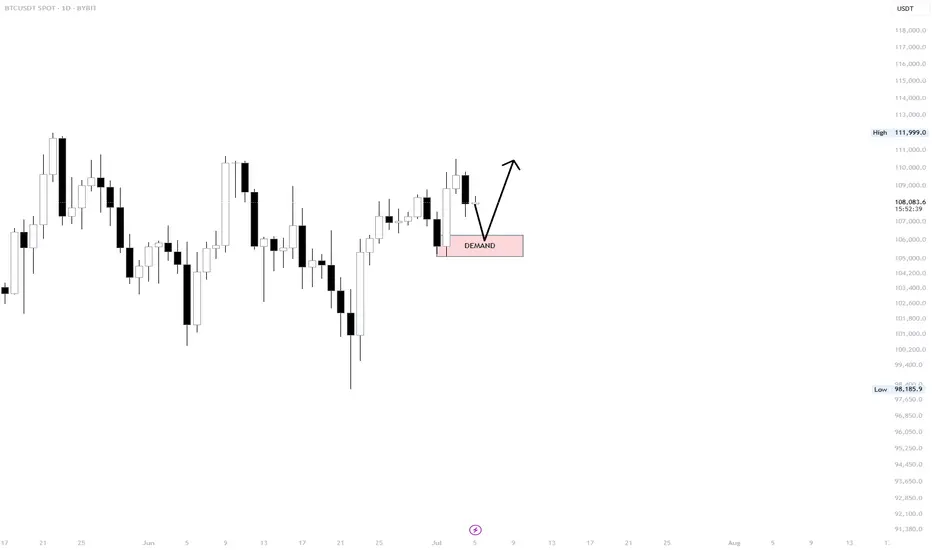
BTC/USDT BYBIT IDEA #1 – Daily Demand Zone Setup
We have an bullish OB with imbalance on Daily, 6 HOUR REFIMNET with some stoplosses underneath 107 200. If we do not hold local LTF -15M- 1H range I would be favoring this setup.
Otherwise I am already in position and already took two TPs.
Setup Thesis:
If price tags the demand zone (highlighted in pink) and holds, we could see a continuation toward recent highs. The setup favors a reactive long entry from this zone, as long as buyers defend the area with conviction.
Key Factors:
Demand zone: High probability support area
Clean structure: HL-HH continuation in play
Market strength remains intact above this zone
Plan:
Wait for reaction at demand
Long on confirmation (rejection candle, reclaim, or strong 4H close)
Invalidation below the zone lows
PULL BACKFriends as per my analysis btc is forming an inverse head and shoulder pattern. with in a couple of days we will see a pull back up 101k area.

BTC - Zoomed Out ScenarioAs predicted DXY has broken down a major monthly bearish trendline - currently finishing a bearish retest before further free fall.
If this plays out we have 2-3 years of a weakening / correcting dollar, and a strengthening investment in assets such as Bitcoin.
This means an extended bull market spanning 2-4 years on Bitcoin and equities.
However - there is a mass amount of liquidity to the uber lows towards 10,000 on BTC.
Market is showing manipulated intention to hit these lows by keeping the price below this bearish cross section - and that’s why bitcoin hasn’t been moving up yet.
This tells me this is more likely than we all think to play out.
I’m trading the following:
Short - 108,200 to 35,000
Long - 35,000 to 80,000
Short - 80,000 to 10,000
Will update accordingly if the plan changes.
Happy trading.

Bitcoin shortBitcoin has lost the daily level, has been rejected by weekly level
Not only, but also Bitcoin has lost weekly open, previous week's high and Monday high
I am currently short

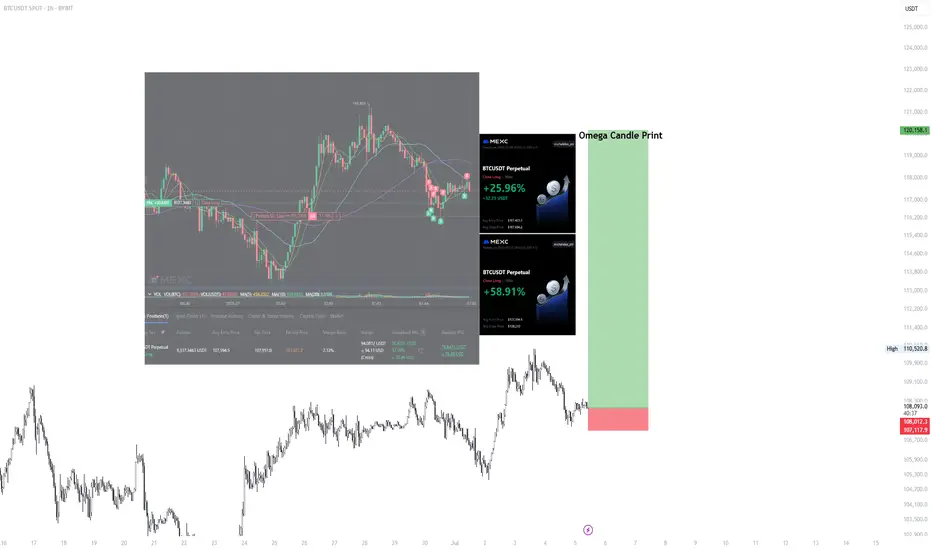
BTC/USDT BYBIT IDEA #2 – Local Range Hold and OMEGA CANDLE PRINTThis is my second Setup I am currently in - apart from going to 6h orderblock we will hold the LTF range and continue higher breaking new highs and starting price discovery.
Combined this with Bullish News could bring amazing BTC Run, followed by Altcoin Season in Mid August/September. If you look into Bitcoin Balance and the way this token is being bought and accumulated by institutions.
The way you know Bull Run is about to start is because no Grandmas and Taxi Drivers are talking about it.
I would not believe it myself but here we are.
The way I do this I keep my position running from lows (bought at 107 400) and I am buying LTF ranges for extra 30-40% of existing position and then closing around the same amount on highs of LTF like 15M-30M.
looking for longs, my SL is set for break even.
Good luck.
"BTC to $108,800 – How Likely Is It?"Bitcoin is showing strong bullish momentum as key technical indicators align in favor of a major breakout. With increasing institutional interest, rising ETF inflows, and a favorable macroeconomic environment, BTC appears to be setting up for a potential rally toward the $108,800 level. Historical price action also suggests that once Bitcoin breaks past major resistance zones, it often surges rapidly. If the current support levels hold and buying pressure continues, the $108,800 target may be closer than expected.

Bitcoin Recovers Above 105,000, Extremely Bullish +AltcoinsBitcoin produced only two days red, a bear-trap, and is now trading daily back above $107,000, an extremely bullish development.
Good morning my fellow Cryptocurrency trader, I hope you are having wonderful day.
The altcoins market bull market is confirmed and what Bitcoin is currently doing gives further strength to the bullish case and bias. It will be only a matter of days before the entire altcoins market turns strongly bullish with major momentum.
The range is still valid though, $100,000 - $110,000. But this time around the upper-boundary is likely to break and the last ATH tested, a new all-time high is even possible and also highly probable which is what will propelled the altcoins to hit multi-year highs and some even new all-time highs. Many pairs will move ahead.
With each passing day, the Cryptocurrency market will continue to heat up. We can expect growth long-term.
The 2025 bullish cycle started with the 7-April market low. The start of the third wave started 22-June and should go for 2-3 months. Then we will have a correction, the fourth wave followed by one final jump, the fifth wave.
We can expect growth now and all through late 2025. The entire period will be bullish. Only when the marketwide correction comes there will be a pause but many pairs will grow even at this point.
Choose wisely. Low risk vs high potential for reward.
Aim high. Focus on the long-term.
Thanks a lot for your continued support.
Namaste.

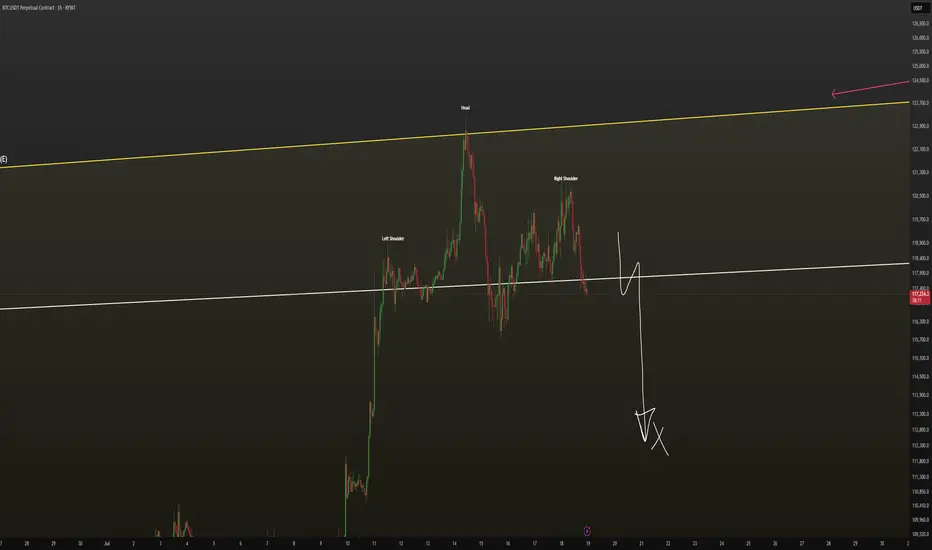
BTC - Isn't it obvious where it will go?BTC shorts not likely here - needs movement to top for further down momemntum!

Long IdeaI'm seeing a possible bullish cypher pattern forming for the mini blow off top for btc. This mimics the SPX500 and currently in lagging state. Ater that, it will go back around 50k - 60k area, probably to eliminate saylor out before going to the 240k - 280k region..

SHORTYou’re right to be cautious around the $107K–$108K zone—it’s a pivotal area. A slight dip could happen, but the broader trend and institutional backing suggest more upside if resistance yields. Watch $105K–$106K support and $108K–$110K resistance closely. To 103K

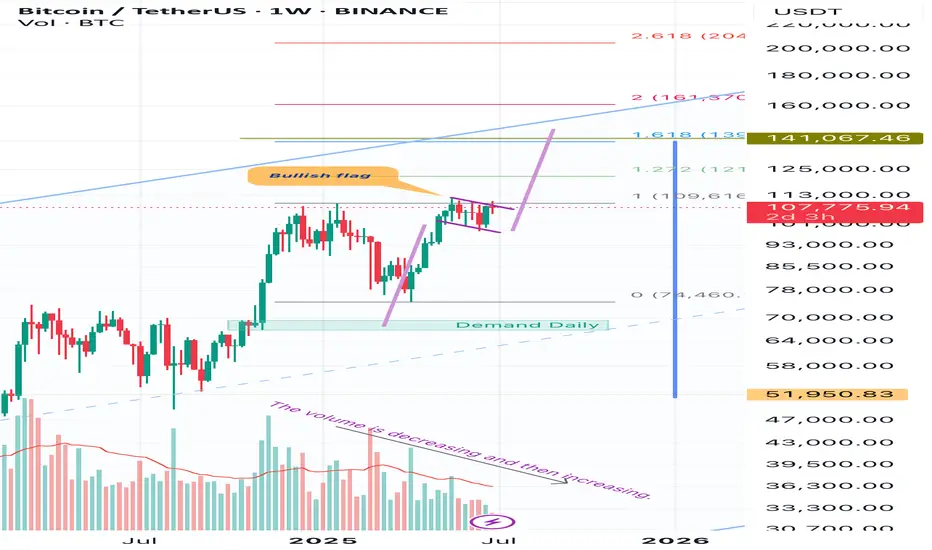
BtcusdtHello friends, in these important days of the markets, I wanted to share an analysis of Bitcoin with you. I think it is in a bullish flag and the target is 136,000 and within reach. It is 140,000. And I think that considering that the volume is decreasing, this indicates that with a sudden increase in volume, it will exit this bullish flag upwards with great intensity and speed.
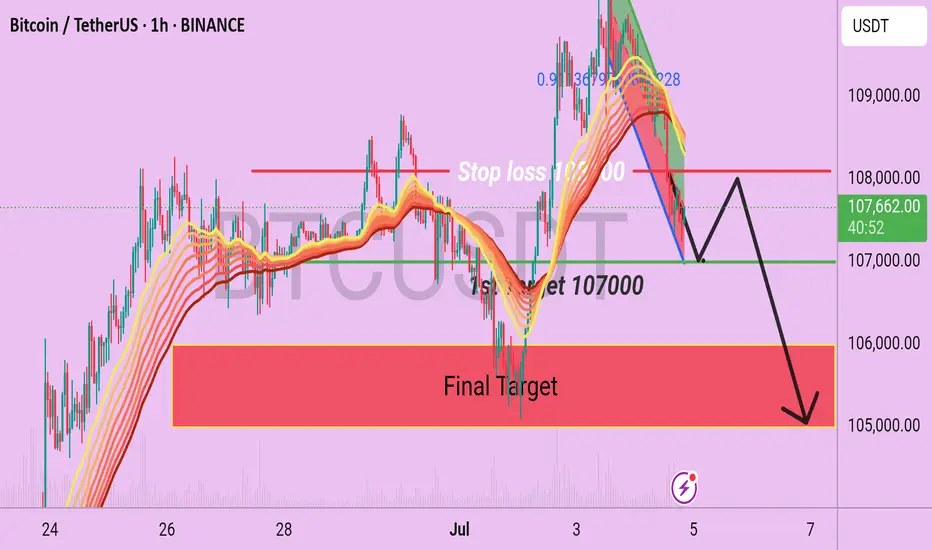
BTC/USDT H1 Chart Out look Bitcoin is Now running at near the 107500 and following a short term Bearish pattern on EMA 50 and 200 by using that we can consider on sell side with the given Targets like 107000 which is near the Bitcoin is consolidating and the Final target support is 106000/105000.
Bearish Scenario
1st Target is 107000 ( from here it may make some retest)
2nd Target is 106000( main target).
3rd Target is 105000.
Use stop loss at 108100.
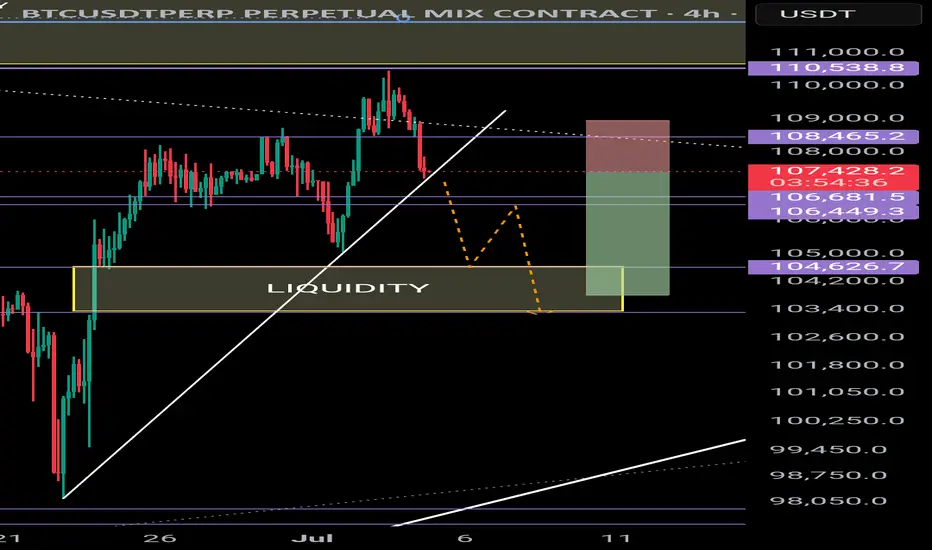
BTC correction - target4H
A break below the uptrend (white line) could result in a move down to 103,400 📉 which would fill a Fair-value-gap and grab liquidity.
Short position:
-3% vs +1%
2.3:1 Reward to Risk
Sell and wait because of the 100days growth rule 100 days for ETH BTC and most. Some more days for doge maybe and solana. Then i may buy back if it is a quick drop.

Bitcoin Technical Setup: Support Holds, Eyes on $118,600Bitcoin ( BINANCE:BTCUSDT ) moved as I expected in the previous ideas and finally completed the CME Gap($117,255-$116,675) in the last hours of the week. ( First Idea _ Second Idea )
Before starting today's analysis, it is important to note that trading volume is generally low on Saturday and Sunday , and we may not see a big move and Bitcoin will move in the range of $121,000 to $115,000 ( in the best case scenario and if no special news comes ).
Bitcoin is currently trading near the Support zone($116,900-$115,730) , Cumulative Long Liquidation Leverage($116,881-$115,468) , Potential Reversal Zone(PRZ) , and Support lines .
According to Elliott Wave theory , Bitcoin had a temporary pump after the " GENIUS stablecoin bill clears House and heads to Trump's desk " news, but then started to fall again, confirming the end of the Zigzag Correction(ABC/5-3-5) . Now we have to wait for the next 5 down waves or the corrective waves will be complicated .
I expect Bitcoin to rebound from the existing supports and rise to at least $118,600 . The second target could be the Resistance lines .
Do you think Bitcoin will fill the CME Gap($115,060-$114,947) in this price drop?
Cumulative Short Liquidation Leverage: $121,519-$119,941
Do you think Bitcoin can create a new ATH again?
Note: Stop Loss(SL)= $114,700
Please respect each other's ideas and express them politely if you agree or disagree.
Bitcoin Analyze (BTCUSDT), 15-minute time frame.
Be sure to follow the updated ideas.
Do not forget to put a Stop loss for your positions (For every position you want to open).
Please follow your strategy and updates; this is just my Idea, and I will gladly see your ideas in this post.
Please do not forget the ✅' like '✅ button 🙏😊 & Share it with your friends; thanks, and Trade safe.

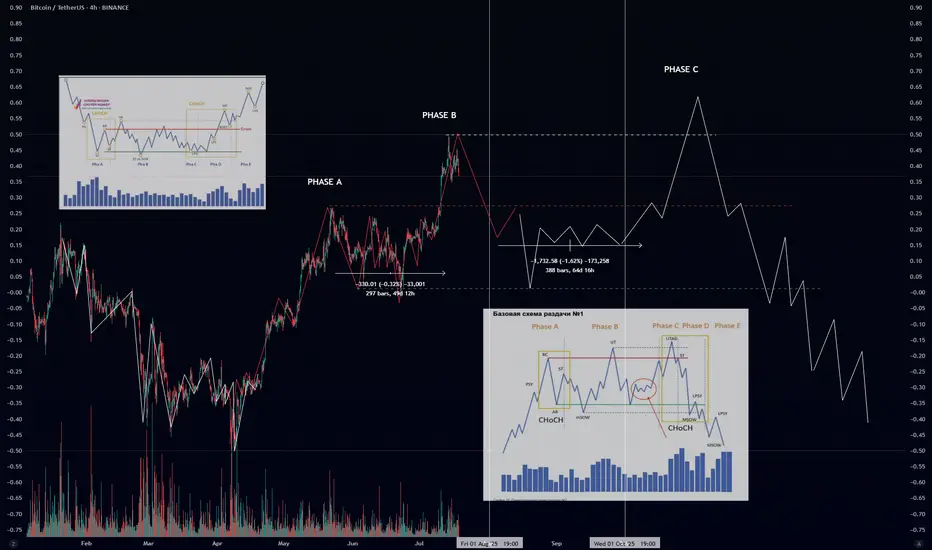
Wyckoff Distribution Schematic #1 – ExplainedIf you’ve ever wondered how smart money offloads their positions before a major downtrend — this is it. The Wyckoff Distribution Schematic #1 is the mirror opposite of accumulation. It reveals how institutions distribute (sell) to retail before the market collapses.
🔍 Phases Breakdown:
🟠 Phase A – Preliminary Supply & Buying Climax
PSY (Preliminary Supply): First signs of selling pressure.
BC (Buying Climax): Sudden surge in price with high volume – often traps late buyers.
AR (Automatic Reaction): Price drops as buyers lose momentum.
ST (Secondary Test): Retest of the top – often with lower volume.
🔄 CHoCH (Change of Character): Early warning sign that supply is increasing.
🟡 Phase B – Building the Cause
Sideways price action where large players distribute their holdings.
UT (Upthrust): Fake breakout above resistance.
mSOW (Minor Sign of Weakness): Slight breakdowns showing cracks in structure.
🔴 Phase C – The Trap
UTAD (Upthrust After Distribution): Final fakeout to trap bulls before the real drop.
Market often shows strength… right before the collapse.
Another CHoCH confirms the shift toward bearish control.
🔵 Phase D – Breakdown Begins
LPSY (Last Point of Supply): Final bounces with weak demand.
MSOW (Major Sign of Weakness): Strong breakdown on high volume — momentum shifts decisively.
⚫ Phase E – Downtrend
Distribution complete.
Price trends downward with weak rallies.
Retaiя is left holding the bag.
📊 Volume matters: look for volume spikes on upthrusts and breakdowns, and declining volume on bounces.
🔁 Compare with Accumulation:
Accumulation ends in Spring → Uptrend 📈
Distribution ends in UTAD → Downtrend 📉
BTC - local situation (1h) SHORT🔻 Breaking down from a bearish pattern.
I expect a local decline to $114,000 - $112,000 on the 1h timeframe.