Need to retest $91k before next big moveI think now Bitcoin can take healthy correction before to takeoff 🛫 for major upside move.
And if BTC break $124k than we can see $134.5k before take correction..
Let's see what will happen next..
BTCUSDT.P trade ideas
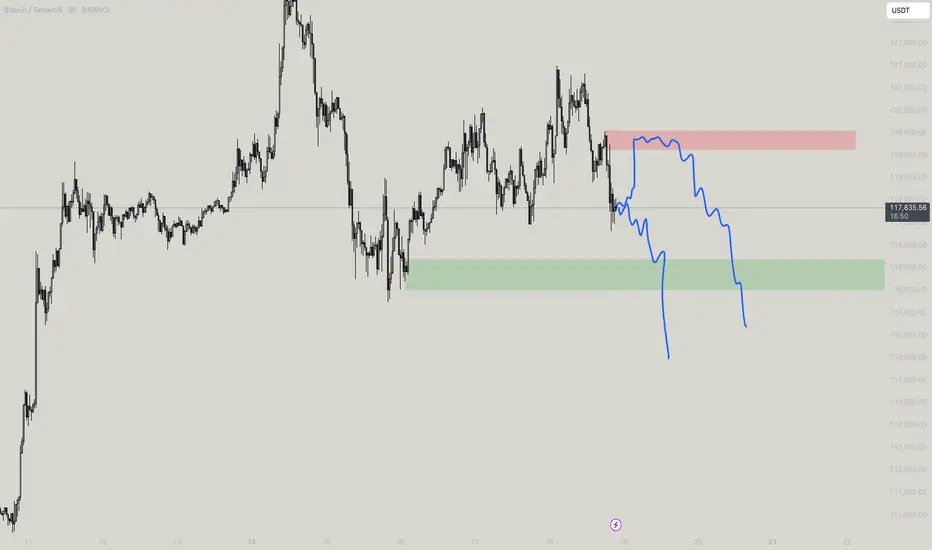
2RRI believe bitcoin is eventually making a new local lower low, however, that it will likely bounce off the indicated range first, moving up in a three wave move before continuing lower. Well, the target may need to be adjusted, the indicated trade is attempting to take advantage of this Analysis.
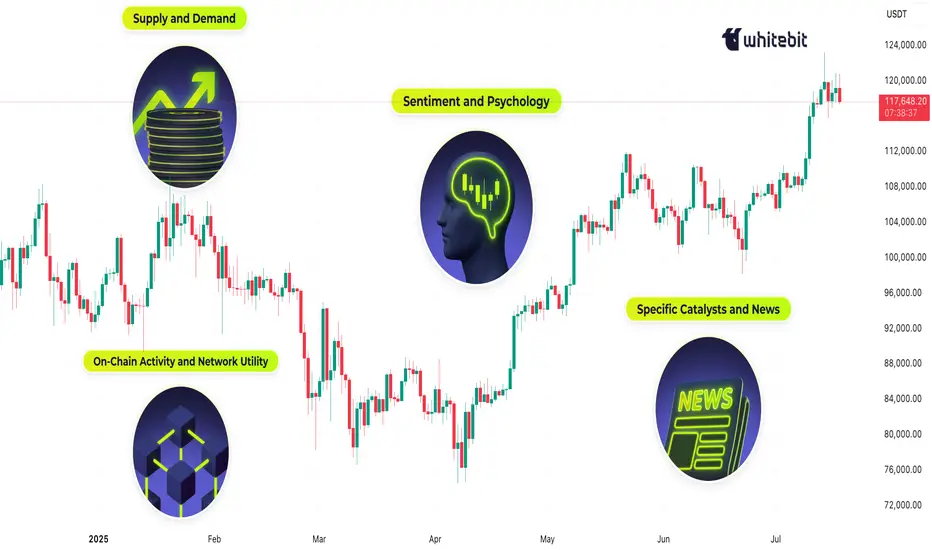
What Moves the Crypto Market?Hello, Traders!
If you’ve spent any time staring at crypto charts, you’ve probably asked: “Why is this happening?” And the truth is… there’s never one simple answer.
Crypto markets are complex, global, 24/7 systems. The forces behind a price move can be technical, fundamental, psychological or all at once. So let’s unpack what really moves this market.
1. Supply and Demand — The Fundamentals Behind the Volatility
At its core, crypto prices are governed by supply and demand. If more people want to buy than sell, the price goes up and vice versa. But it’s not that simple.
Take Bitcoin. It has a fixed max supply of 21 million, and most of those coins are already mined. But available liquidity on exchanges is much smaller and this is where things get interesting. During bull markets, demand surges while liquid supply dries up. That creates parabolic moves. Then you have supply unlocks, token vesting schedules, and inflationary emissions all of which affect how much of a coin is flowing into the market.
Example: When Lido enabled ETH withdrawals in 2023, it shifted the ETH supply dynamics, some saw it as bearish (more unlocked supply), others bullish (greater staking confidence).
2. Sentiment and Psychology: Fear & Greed Still Rule
If you want to understand the crypto market, start by studying people. Emotions drive decision-making, and crypto is still largely a retail-dominated space. Bull runs often start with doubt, accelerate with FOMO, and end in euphoria. Bear markets move from panic to despair to apathy. The crypto psychology chart rarely lies, but it always feels different in real time.
The classic “psychological numbers in trading”, like $10K, $20K, $100K BTC, often act as invisible walls of resistance or support. Why? Because traders anchor to these round levels.
👉 We’ve covered this phenomenon in detail in a dedicated post “The Power of Round Numbers in Trading.” Highly recommend checking it out if you want to understand how these zones shape market psychology and price action.
3. On-Chain Activity and Network Utility
Fundamentals matter. But in crypto, fundamentals are on-chain. The transparency of blockchain networks provides valuable insights into fundamental usage and investor behavior, which often foreshadow price trends. On-chain metrics such as active addresses, transaction volumes, and wallet holdings offer insight into the health and sentiment of the crypto ecosystem:
Network Usage (Active Addresses & Transactions): A growing number of active addresses or transactions might indicate rising network demand and adoption. Empirical studies have found that BTC’s price strongly correlates with its on-chain activity – increases in the number of wallets, active addresses, and transaction counts tend to accompany price appreciation.
Exchange Inflows/Outflows: Tracking the movement of Bitcoin or Ether in and out of exchanges provides clues to investor intent. Large outflows from exchanges are often bullish signals – coins withdrawn to private wallets imply holders are opting to HODL rather than trade or sell, tightening the available supply on the market. For example, in late March 2025, as Bitcoin neared $90,000, exchange outflows hit a 7-month high (~11,574 BTC withdrawn in one day) mainly by whale holders, indicating strong confidence.
Mining Activity and Miner Behavior: In Proof-of-Work coins like Bitcoin, miners are forced sellers (regularly selling block rewards to cover costs), so their behavior can impact price. Periods of miner capitulation, when mining becomes unprofitable and many miners shut off or sell holdings, have historically aligned with market bottoms.
For example, in August 2024, Bitcoin experienced a miner “capitulation event”: daily miner outflows spiked to ~19,000 BTC (the highest in months) as the price dipped to around $ 49,000, suggesting that miners had dumped inventory as profit margins evaporated. Shortly after, the network hash rate quickly recovered to new highs, indicating that miners’ confidence was returning, even as the price was low.
Final Thoughts
In conclusion, the crypto market’s price movements are driven by a complex interplay of factors… Market sentiment and psychology can override fundamentals in the short run, leading to euphoric rallies or panicked crashes. On-chain metrics provide the ground truth of user adoption and big-holder behavior, often signaling trend changes before they happen. Halvings and tokenomics remind us that the code underlying these assets directly affects their value by controlling supply. And finally, specific catalysts and news events encapsulate how all these forces can converge in real time.
For enthusiasts, understanding “what moves the crypto market” is crucial for navigating its volatility. Crypto will likely remain a fast-evolving space, but its price movements are not random. They are the sum of these identifiable factors, all of which savvy market participants weigh in their quest to predict the next move in Bitcoin, Ethereum, and beyond.
What do you think? 👇🏻
BTC - 115 - 113k when?Looks likely today or tomorrow, Just in case if it traps you know how it can and if not you know the fall!

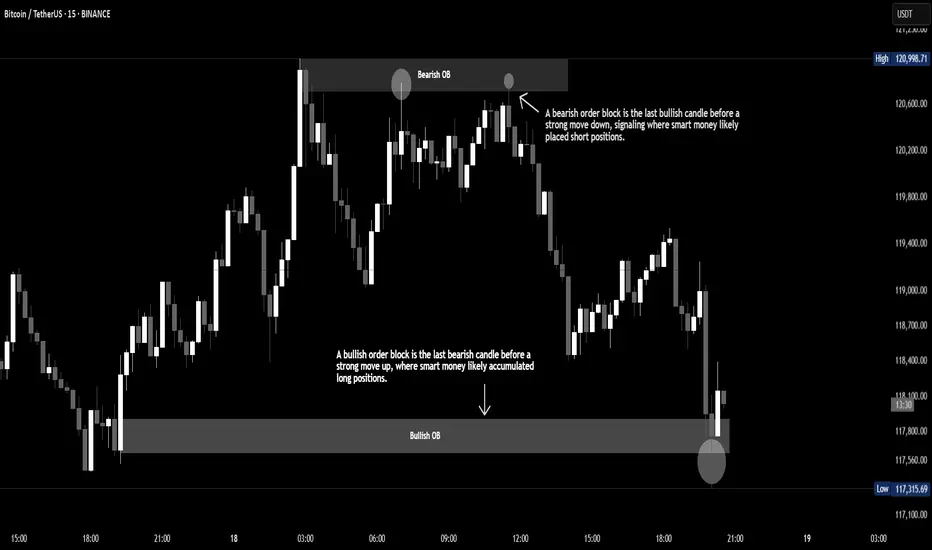
Order Block Explained Order blocks are zones where big players (like institutions) place large orders, often leading to strong moves in price. They act as key areas of interest—bullish order blocks signal potential upward moves, while bearish
BTC - Long the $115k LiquidationsHiya friends,
Hope the market has been treating y'all well.
Long Btc soon for another leg up! Then take profits! LOL
Trade thirsty, my friends!

BTC-----Buy around 118000, target 120000 areaTechnical analysis of BTC contract on July 18:
Today, the large-cycle daily level closed with a small positive line yesterday, the K-line pattern continued to rise, the price was above the moving average, and the attached indicator was golden cross and running with shrinking volume. The large-scale upward trend is still very obvious. After the previous strong performance, there was a short-term shock correction trend. According to the current trend rules, it is a correction and a trend of market demand. The trend has not changed; the short-term hourly chart yesterday's European session price support rebound, the current K-line pattern continued to rise and the attached indicator was golden cross, so we still have to look at the continuation of the break in the day and the European session. The moving average support position is 120,000 area; the high point is near 121,000 area.
Today's BTC short-term contract trading strategy:
Buy in the 118,000 area, stop loss in the 117,000 area, target the 121,000 area, break the position and look at the 121,500 area;

Bitcoin (BTC/USDT) Price Prediction -1D (Updated)Trend Prediction - BTC/USDT Forecasting -
End of Resistance and Support Lines Falling Wedge Pattern!!!
**** Yousef Sharafi ****
Follow me here for more analysis

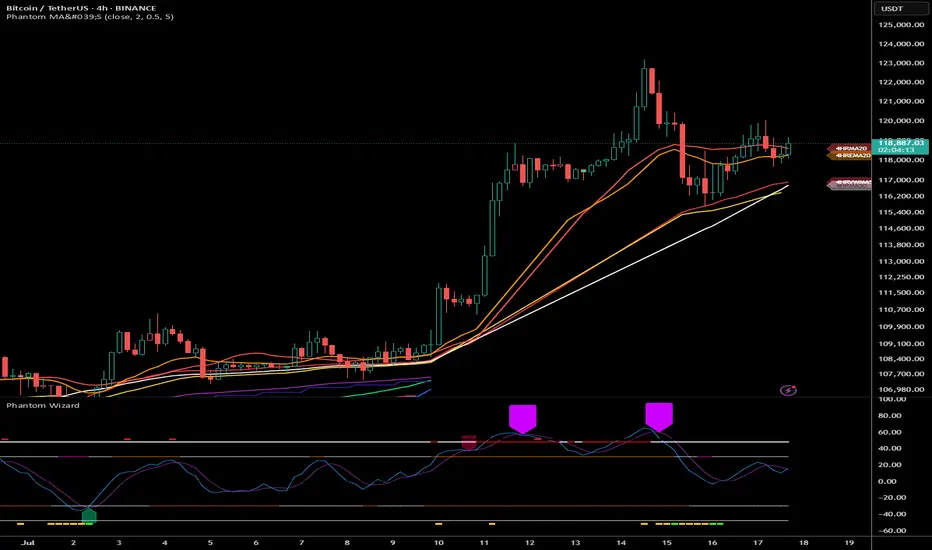
BTCUSDT Smart Zone Entry + Take Profit MapThe BTCUSDT chart on both the 1H and 4H timeframes shows a clear consolidation above a high-timeframe support zone with early signs of bullish continuation. This setup outlines a well-defined "Buy Zone," backed by recent demand re-tests, with Take Profit (TP) levels mapped out based on prior highs and price inefficiencies.
Buy Zone (Demand Zone):
The shaded area on the 1H/4H chart marks a critical support zone between ~$117,800 and $119,300. This range aligns with past consolidation, a 4H EMA cluster, and prior bullish reactions. Entries within this zone offer a high reward-to-risk setup.
Support Level:
$117,800, the base of the demand zone, is the final line of support. A clean break and close below this level would invalidate the current long bias.
Take Profit Levels (TPs):
TP1 (~$122,000): Previous local resistance and recent high.
TP2 (~$123,300): Upper wick high and liquidity zone.
TP3 (~$124,500): Untapped zone from early July, likely liquidity pool.
Supporting Indicators:
RSI: Recovering from mid-range, showing hidden bullish divergence on lower timeframes.
QQE MOD: Flipping from bearish to bullish momentum.
ATR: Declining volatility post-drop indicates possible accumulation before breakout.
After a sharp pullback, BTC is stabilizing above a demand zone and forming a potential base. As long as price remains above ~$117,800, there's confluence for a continuation higher, with the outlined TP levels offering natural exit points for partial or full profits.

Bitcoin : Stay heavy on positionsApril was the scale-in zone:
Back in April, the US stock market flashed a split-entry buy signal—a classic zone for gradual accumulation.
That same setup applied to Bitcoin. Buying the fear worked again.
We’ve moved out of the fear zone:
Both Bitcoin and equities have left the extreme fear territory behind. Sentiment has shifted.
Short-term overbought now:
Bitcoin is currently in a short-term overbought phase. Some consolidation or cooling off is natural here, but no major trend reversal signs yet.
Stay heavy on positions:
I’m maintaining an overweight position in Bitcoin as long as the US stock market stays intact. The Nasdaq is holding up, so Bitcoin likely stays in risk-on mode.
Warning:
If US equities take a hit, expect Bitcoin to follow.
Negative moves in the stock market will likely translate directly into crypto weakness.

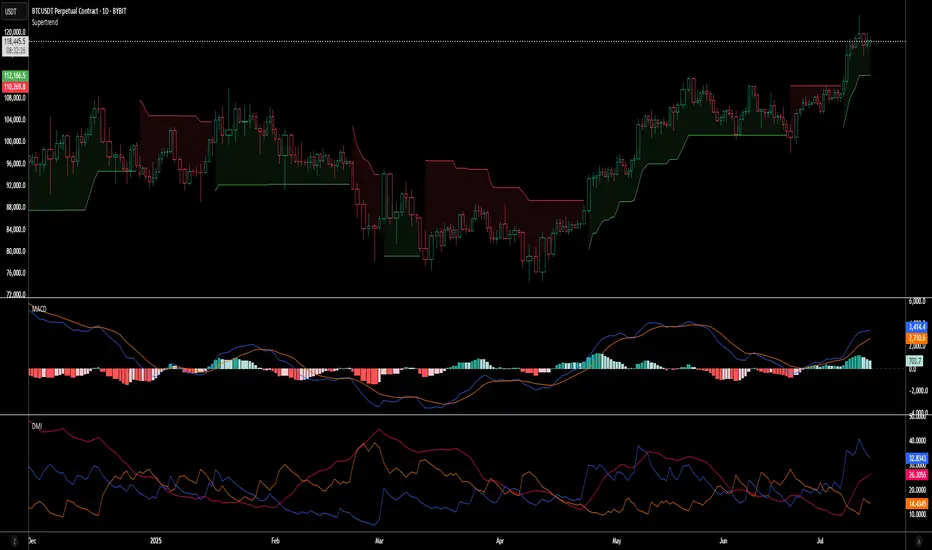
Coinbase Premium indicates High Risk on BTCThe Coinbase Premium Indictor shows the CBP risk is high. The previous times the CBP premium has reached these levels, CRYPTOCAP:BTC generally started a range or downtrend.

BTC Weekly Breakdown – Lord MedzKey Levels to Watch:
DR High: 109,205
DR Low: 58,996
Weekly Gap: 65,332, aligning with the 0.886 Fib Discount Level
Devil’s Mark: Sitting near the 0.618 Fib retracement
Analysis:
Liquidity rests below the Devil’s Mark, meaning price could still target this area before any significant reversal.
The weekly gap at 65,332 is a major area of confluence, lining up with 0.886 Fib—a strong support zone.
If the current level fails to hold, the market may seek deep liquidity around 65K–58K before any bounce.
Bearish Scenario:
Loss of 0.618 Fib (78K) could trigger further downside sweeps.
Worst case: Breakdown into the weekly gap & DR low area.
Bullish Scenario:
Holding above Devil’s Mark with a strong reaction could indicate a reversal.
Reclaiming 85K–90K range would shift bias back to bullish.
Game Plan: Stay vigilant for a liquidity grab before positioning. If price drops into 65K–58K with a reaction, that could be the buy zone.
Lord Medz

Why Your indicators Fail to Work For You and WHY.Many commonly used indicators—RSI, MACD, and others—show win rates around **30–40%** when used as direct trade signals and may make a slight profit overall, but loose in a ranging market.
Oddly enough, if you reverse them—buy when it says sell, sell when it says buy—you can often push the win rate up to **65–70%**.
But here’s the catch:
👉 Even with a high win rate, these “inverse strategies” still **tend to lose money** over time. Why? The few times the market trends it will wipe out any profits you might have made.
---
🧠 What's Really Going On?
* Indicators trigger **crowd behavior**, not institutional intent.
* Institutions use crowd-driven signals to identify **liquidity clusters**
* Standard signals become **traps**, not trade ideas.
I call this Hidden or Dynamic liquidity
So when indicators say "Buy!", the smart money sees that as an opportunity to sell *into* the crowd’s enthusiasm—then reverse the move once retail traders are trapped.
Institutions can see when, say the 20 SMA is about to cross the 50 SMA. This gives them a heads up that and opportunity may be coming to use the liquidity it generates from the ensuing retail trades to enter their opposing trades.
---
⚠️ Takeaway:
Indicators may be more useful as **tools to locate liquidity**, not predict direction.
Use them to observe where *others* are getting in, then ask:
🔍 *If I were a large player needing liquidity, where would I execute my order?*
See Indicators triggering not as entry positions but as potential pivot points.
BTC - Last Resistance Before New HighsPrice is back at the same zone that rejected it months ago — but this time with momentum and a clean trendline behind it. Stoch RSI is stretched, signaling a possible short-term cooldown… or a breakout into uncharted territory.
Keep your eye on that 126K liquidity magnet 👀
#Bitcoin #BTCUSD #CryptoTrading #ChartAnalysis #TechnicalAnalysis #BreakoutTrading #TrendlineSupport #QuantTradingPro #TradingView

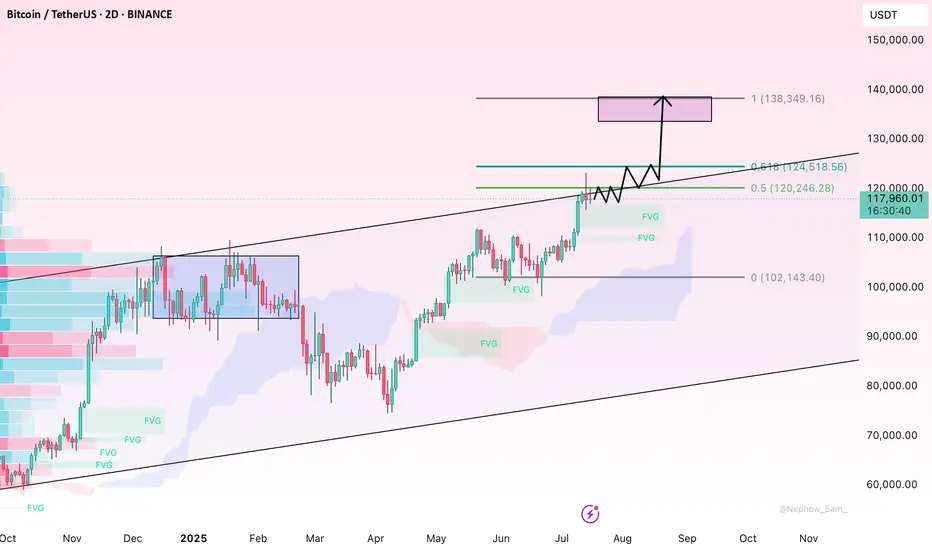
Bitcoin Forever Bitcoin's Technical Trajectory: Analysis for Q3-Q4 2025
Breaking New Records: Bitcoin's Path Beyond the July Peak
With Bitcoin currently trading near historical highs after reaching its all-time high of $123,218 in July 2025, we find ourselves in unprecedented territory. This comprehensive technical analysis examines Bitcoin's potential trajectory through the remainder of 2025, leveraging multiple analytical frameworks to identify probable price targets and key levels.
Current Market Context
Bitcoin has experienced a remarkable ascent in 2025, climbing from around $85,000 in January to establish a new all-time high of $123,218 in July. After this peak, we've seen a period of consolidation with price action forming a potential bull flag pattern between $117,000-$120,000. This consolidation phase represents a critical juncture for Bitcoin's next directional move.
The most recent data shows Bitcoin trading around $118,200 in late July, representing a modest pullback of approximately 4% from the all-time high. This shallow retracement suggests underlying strength rather than exhaustion in the primary trend.
RSI Analysis: Healthy Momentum Reset
Despite Bitcoin's extraordinary rise to $123,218 in July, the daily RSI has demonstrated remarkable resilience. After reaching overbought territory (70+) during the July peak, the indicator has now cooled to approximately 42-46, indicating a healthy reset of momentum conditions without surrendering the broader uptrend.
The weekly RSI reading of 46.4 is particularly significant—showing that despite the recent consolidation, Bitcoin maintains substantial momentum capacity before reaching the extreme readings (80+) that typically signal major cycle tops. This technical positioning creates an ideal scenario where momentum has reset while price structure remains intact.
Most notably, the absence of bearish divergences between price and RSI on higher timeframes suggests the current consolidation is likely a pause rather than a reversal in the primary trend.
Wyckoff Analysis: Re-accumulation Before Continuation
The price action following the $123,218 July peak displays classic characteristics of Wyckoff re-accumulation rather than distribution:
The initial decline from the peak represents a "Preliminary Support" (PS) phase
The subsequent trading range between $117,000-$120,000 shows tight price action with decreasing volatility
Volume characteristics show diminishing selling pressure rather than distribution
Recent price action suggests we're approaching the "Spring" phase that typically precedes markup
According to the data, Bitcoin's price action in late July shows decreasing volatility with narrowing price ranges, consistent with the "Cause Building" phase in Wyckoff methodology. This structure indicates institutional accumulation is still occurring at these elevated levels—a powerful sign that smart money anticipates further upside potential. The completion of this re-accumulation pattern projects a move toward the $135,000-$145,000 range in the coming months.
Supply/Demand Zone Analysis: Key Levels Identified
Supply and demand zone analysis reveals critical price levels that will influence Bitcoin's next directional move:
Major demand zone established between $115,000-$117,000 (recent consolidation floor)
Secondary support cluster at $108,000-$110,000 (previous resistance turned support)
Primary resistance at $123,200-$125,000 (all-time high region)
Limited historical supply overhead above $123,218 suggests minimal resistance once this level is breached
The formation of fresh demand zones during the recent consolidation indicates strategic accumulation before the anticipated upward expansion. The neutralization of previous supply zones during the advance to all-time highs has effectively cleared the technical pathway for Bitcoin's next significant move higher.
Volume Analysis: Confirming the Bullish Case
Examination of trading volume during the recent consolidation provides crucial validation for our bullish thesis:
Declining volume during pullbacks indicates diminishing selling pressure
Volume spikes on upward moves suggest accumulation on strength
The Volume-Weighted Average Price (VWAP) maintains a positive slope, confirming the underlying strength of the trend
The high-volume node has migrated upward in recent weeks, signalling comfort with accumulation at these unprecedented price levels—a powerful indication of market confidence in Bitcoin's valuation. The buying/selling volume differential maintains a positive bias, confirming underlying accumulation despite price consolidation.
Fibonacci Extension Framework: Projecting Targets
With Bitcoin having established a new all-time high at $123,218 in July, we can project potential targets using Fibonacci extensions from the most recent significant swing points:
The 127.2% extension from the June-July rally projects to approximately $132,000
The 161.8% extension suggests potential movement toward $145,000
The 200% extension indicates a possible target of $160,000
These projections align with psychological thresholds that could serve as natural targets in this new price discovery phase.
Elliott Wave Analysis: Extended Fifth Wave Scenario
The current price action suggests we're likely in an extended fifth wave scenario within a larger degree bull cycle:
Primary waves I through III appear complete with the move to $123,218 in July
The current consolidation represents wave IV
Wave V is projected to reach the $140,000-$160,000 range
This wave count suggests potential for continued appreciation toward the $145,000-$160,000 range before a more significant corrective phase begins. The internal structure of the current consolidation displays textbook proportional relationships, further validating our analysis.
Price Projection Timeline
August-September 2025:
Completion of the current consolidation phase with a potential final retest of support in the $115,000-$117,000 range. This would represent the "Last Point of Support" in Wyckoff terminology and provide a final opportunity for institutional accumulation before the next leg up. A decisive break above $125,000 would confirm the end of the consolidation phase.
October 2025:
Renewed momentum pushing Bitcoin toward the $132,000-$140,000 range, potentially coinciding with seasonal strength typically observed in Q4. This phase could see increased institutional participation as year-end positioning begins, with volume expansion confirming the strength of the move.
November-December 2025:
Final wave extension potentially reaching the $145,000-$160,000 range, representing a 20-30% appreciation from current all-time high levels. This phase may exhibit increased volatility and could be followed by a more substantial correction as the extended fifth wave completes.
Key Levels to Monitor
Support Zones:
Primary: $115,000-$117,000 (must hold for bullish scenario)
Secondary: $108,000-$110,000 (previous resistance turned support)
Tertiary: $100,000-$102,000 (psychological and technical support)
Resistance Zones:
Immediate: $123,200-$125,000 (all-time high region)
Target 1: $132,000-$135,000 (127.2% Fibonacci extension)
Target 2: $145,000-$150,000 (161.8% Fibonacci extension)
Target 3: $160,000+ (200% Fibonacci extension)
The Technical Case for New Highs
Despite Bitcoin already achieving unprecedented price levels in July, multiple technical frameworks suggest the potential for continued appreciation:
Historical Precedent: Previous bull cycles have shown Bitcoin capable of extending significantly beyond initial all-time highs before cycle completion
Institutional Adoption: On-chain metrics indicate continued accumulation by large holders despite elevated prices, with exchange outflows remaining positive
Technical Structure: The current consolidation pattern resembles re-accumulation rather than distribution, suggesting the market is preparing for another leg higher
Momentum Characteristics: Current momentum readings have reset from overbought conditions without breaking the underlying trend structure
Strategic Considerations
With Bitcoin having already achieved a new all-time high at $123,218 in July, strategic approaches might include:
Maintaining core positions while implementing trailing stop strategies
Adding to positions during retests of key support levels ($115,000-$117,000)
Considering partial profit-taking at key Fibonacci extension levels
Remaining vigilant for signs of distribution patterns that may emerge at higher levels
Conclusion: The Path to $160,000
The weight of technical evidence suggests Bitcoin has entered a new paradigm of price discovery following its break to all-time highs in July 2025. While the path may include periods of consolidation and volatility, the underlying trend remains firmly bullish with multiple technical frameworks projecting targets in the $145,000-$160,000 range by year-end 2025.
The current consolidation phase represents a healthy reset of momentum conditions rather than a trend reversal, creating an ideal technical foundation for Bitcoin's next major advance. With institutional adoption continuing to grow and technical indicators suggesting ample room for further appreciation, Bitcoin appears well-positioned to achieve new record highs in the coming months.
BTC/USDT Heist Mode: Buy Low, Escape Rich🏴☠️"Bitcoin vs Tether" Crypto Market Robbery Blueprint 🔥 | Thief Trading Style (Swing/Day Plan)
🌍 Hey Money Makers, Chart Hackers, and Global Robbers! 💰🤑💸
Welcome to the new Heist Plan by your favorite thief in the game — this time targeting the "Bitcoin vs Tether" Crypto Market like a smooth criminal on the charts. 🎯📊
This is not your average technical analysis — it's a strategic robbery based on Thief Trading Style™, blending deep technical + fundamental analysis, market psychology, and raw trader instincts.
💼 THE SETUP — PREPARE FOR THE ROBBERY 🎯
We're looking at a bullish operation, setting up to break into the high-value vaults near a high-risk, high-reward resistance zone — beware, it's a high-voltage trap area where pro sellers and bearish robbers set their ambush. ⚡🔌
This plan includes a layered DCA-style entry, aiming for max profit with controlled risk. Chart alarms on, mindset ready. 🧠📈🔔
🟢 ENTRY: "The Robbery Begins"
📍 Zone-1 Buy: Near 116200.00 after MA pullback
📍 Zone-2 Buy: Near 112600.00 deeper pullback
🛠️ Entry Style: Limit Orders + DCA Layering
🎯 Wait for MA crossover confirmations and price reaction zones — don’t chase, trap the market.
🔻 STOP LOSS: "Plan the Escape Route"
⛔ SL for Pullback-1: 113000.00 (2H swing low)
⛔ SL for Pullback-2: 110000.00
📌 SL placement depends on your position sizing & risk management. Control the loss; live to rob another day. 🎭💼
🎯 TARGET ZONE: “Cash Out Point”
💸 First TP: 127000.00
🏁 Let the profit ride if momentum allows. Use a trailing SL once it moves in your favor to lock in gains.
👀 Scalpers Note:
Only play the long side. If your capital is heavy, take early moves. If you’re light, swing it with the gang. Stay on the bullish train and avoid shorting traps. Use tight trailing SL.
🔎 THE STORY BEHIND THE HEIST – WHY BULLISH?
"Bitcoin vs Tether" shows bullish momentum driven by:
💹 Technical bounce off major support
🌏 Macroeconomic & geopolitical sentiment
📰 Volume + sentiment shift (risk-on)
📈 Cross-market index confirmation
🧠 Smart traders are preparing, not reacting. Stay ahead of the herd.
👉 For deeper insight, refer to:
✅ Macro Reports
✅ COT Data
✅ Intermarket Correlations
✅ CHINA-specific index outlooks
⚠️ RISK WARNING – TRADING EVENTS & VOLATILITY
🗓️ News releases can flip sentiment fast — we advise:
❌ Avoid new positions during high-impact events
🔁 Use trailing SLs to protect profit
🔔 Always manage position sizing and alerts wisely
❤️ SUPPORT THE CREW | BOOST THE PLAN
Love this analysis? Smash that Boost Button to power the team.
Join the Thief Squad and trade like legends — Steal Smart, Trade Sharp. 💥💪💰
Every day in the market is a new heist opportunity — if you have a plan. Stay tuned for more wild robbery blueprints.
📌 This is not financial advice. Trade at your own risk. Adjust based on your personal strategy and capital. Market conditions evolve fast — stay updated, stay alert.

BTC Nears $120K – Pullback Risk or Breakout Launchpad?Bitcoin has rallied strongly after breaking its multi-week consolidation, now hovering just under the key psychological and historical resistance at $120K. The daily chart shows price floating above the 20EMA, with no signs of distribution—yet. However, the dense liquidity pocket between $110K–$114K remains a magnet in case of a technical pullback.
If bulls defend $118K and price cleanly breaks above $121K with strong volume, the next target lies in the $125K–$128K zone. Spot ETF inflows remain healthy, and any dovish pivot from the Fed could set off another crypto-wide bull wave.
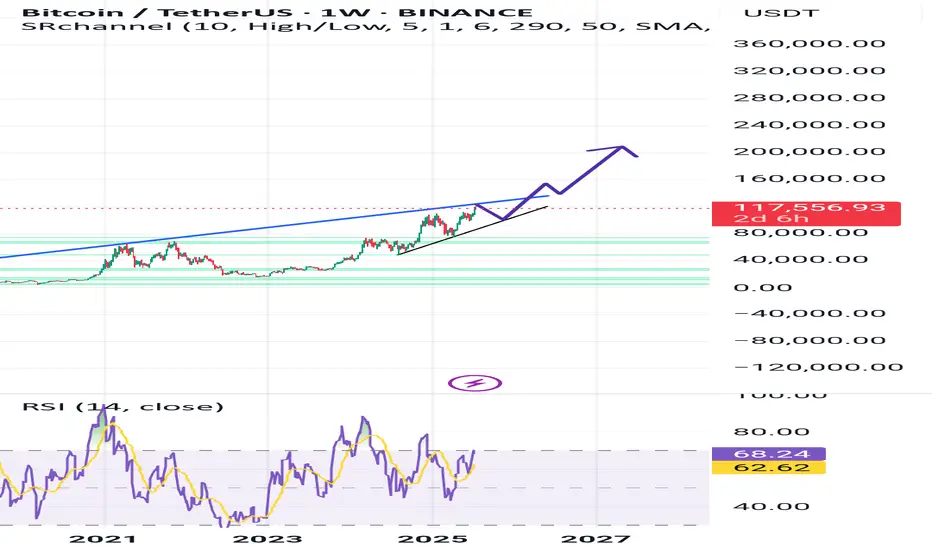
My Macro Take on BTCAfter checking BTC HTF charts, my take is that there is a resistance around $123K–$125K zone (psychological + measured move extensions). I drew a fib extension in november last year where I pointed out that 108K+ will be ATH Q1 2025 (check my TV post). It hit 110K, so pretty close. The next level was 125K, so that´s pretty close to were we are now (123K). So were are we heading now?
I might draw a new fib soon, but I see that monthly is strongly bullish. Stoch RSI is turning up from mid-range, so still has room to run. Volume hasn't spiked dramatically, so a healthy climb without blow-off. 100K looks like a resistance turned into support (also a psychological level).
Weekly is bullish with last weeks strong candle managed to breakout from that 110K level (should now be resistance level). Volume is increasing week-over-week the last weeks which confirms breakout strength. I see that if we loose 100K it could be critical (invalidation of bullish BIAS).
On daily the Stoch RSI is curling downward from overbought which might imply cooling off = short-term retrace. Price has rallied sharply and is currently pulling back slightly after tagging 123K. A pullback to 110-116K looks likely. It would be healthy and expected.

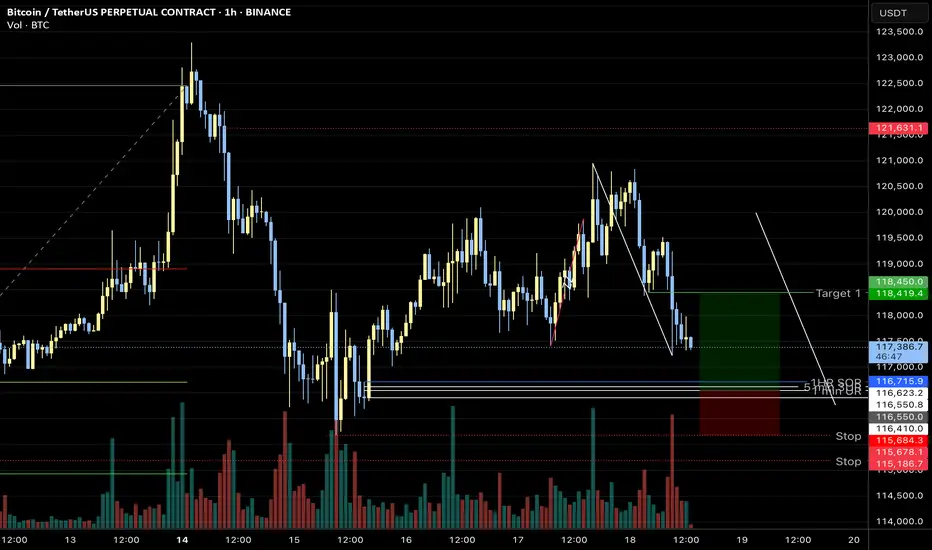
BTC Long London Low 07/16/25Next Monday between 2am-3am EST BTC will have retraced to 116-117k. This is where I will open a long, target 121500k-122k sl 115750.
BTC may sweep below this region before monday but I won't play a long until noted. The reason is based on the fact monday london sets the low range of the week and is the highest probable time to enter a swing trade. Price will most likley reach TP by Wednesday. Also The big confluence is the 1.1 B worth of longs placed at 116000.

Bitcoin Wave Analysis – 16 July 2025- Bitcoin reversed from a support area
- Likely to rise to resistance level 122770.00
Bitcoin cryptocurrency recently reversed up from the support area located between the key support level 115000.00 and the support trendline of the daily up channel from June.
This support area was further strengthened by the 38.2% Fibonacci correction of the sharp upward impulse from July.
Given the clear daily uptrend and the strongly bullish sentiment seen across cryptocurrency markets today, Bitcoin cryptocurrency can be expected to rise to the next resistance level 122770.00 (top of the previous impulse wave i).

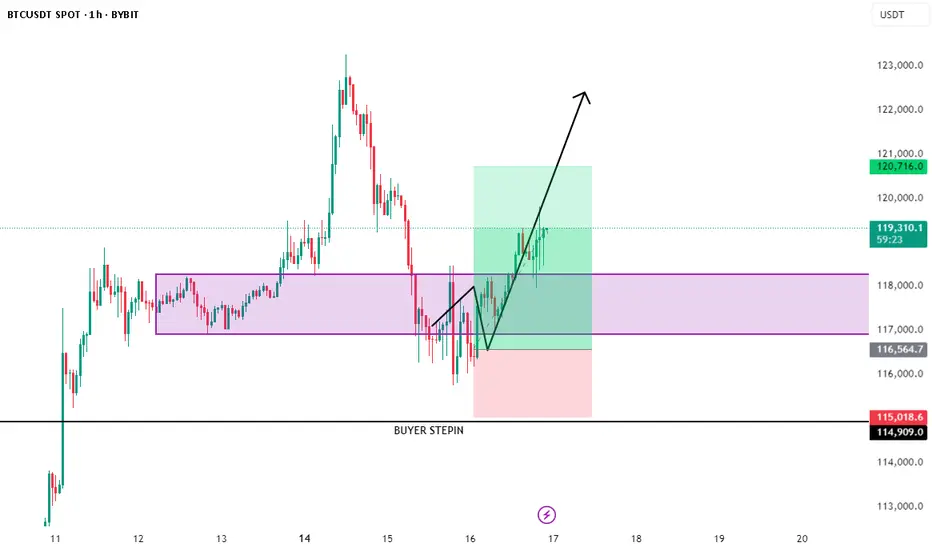
BTC/USDT Trade Update – July 16🚨 BTC/USDT Trade Update – As Planned! 🚨
Shared this setup earlier, and it’s unfolding exactly as expected. Hope you’re all locking in solid profits! 💸
🔹 Entry: BUYER STEP‑IN zone at 116.5 K – 118 K
🔹 Confirmation: Strong bullish engulfing from demand + reclaim of 118 K
🔹 Current Price: 119 K+ and climbing
🔹 Targets Ahead: 120.7 K 🔜 122 K 📈
📌 Why it’s working:
• Demand absorption after liquidity sweep
• V‑shaped recovery forming a higher low
• Increasing momentum + follow‑through volume
🔥 Riding the wave—letting profits run!
🔔 For more real‑time setups, follow 👉 @Ali15349323
#BTC #Bitcoin #CryptoTrading #PriceAction #Profits #TradingView