Bearish Bias
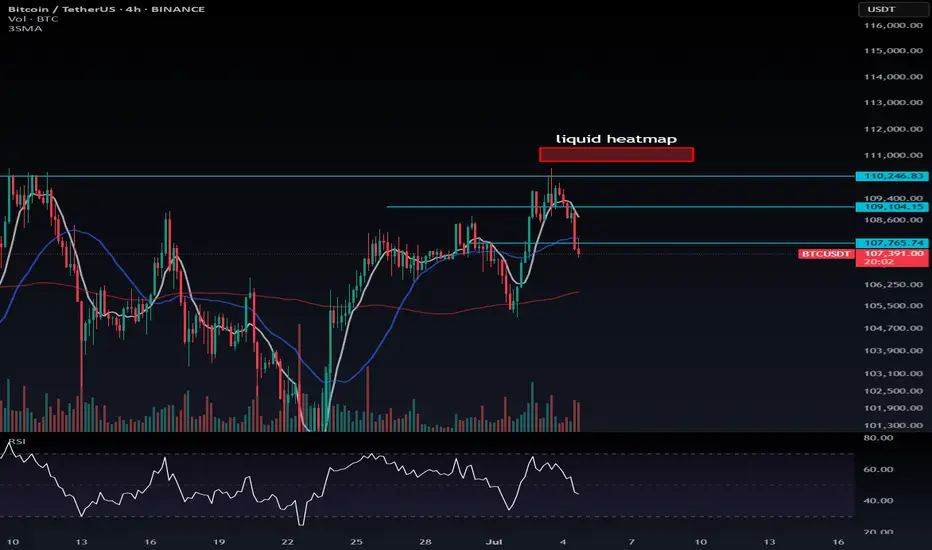
Bitcoin is currently trading around 107,849, showing signs of downward pressure:
🔻 MACD: Bearish crossover — MACD line is below the signal line, momentum is weakening.
🔻 Stochastic RSI: Rejected from mid-levels and turning down — indicating potential continuation of the bearish trend.
🔻 Moving Averages: Price is hovering below MA30 and struggling to reclaim key levels like 108,250.
📉 Key Levels
Resistance: 108,250 – 108,600
Support: 107,590 → 107,222
If BTC breaks below 107,590, expect further downside toward 107,222 or even 106,900.
🧠 Outlook: Bearish bias remains in the short term unless BTC reclaims and holds above 108,250 with volume.
BTCUSDT.P trade ideas

BTCUSDT PRICE PREDICTION If Bitcoin closes two consecutive candles below the 50 Moving Average with full body confirmation, then nothing can stop the price from dropping further — unless it eventually touches the 112,000 level.

SHORTYou’re right to be cautious around the $107K–$108K zone—it’s a pivotal area. A slight dip could happen, but the broader trend and institutional backing suggest more upside if resistance yields. Watch $105K–$106K support and $108K–$110K resistance closely. To 103K

BTC - 4H chart - $105k KEY ZONE, up or we try again7/4
1. As long as price finds support above 105k, the structure remains to go up, breaking the bull flag to ATH.
2. Below 105k, bottom bull flag for support

BITCOIN BITCOIN ,instead of forecasting the price movement i will follow its action, it doesn't matter the direction ,am always right because i follow the direction.
break of the current supply roof on 3hr is a buy confirmation and target will be 115-117k and if we retest and fail to break the descending 3hr supply roof we are selling and target will be 94k (ema+sma ) 4hr demand floor and aggressive sell will be around 90k zone .
NOTE ;everybody is a good trader ,but not everyone is patient enough to wait for a free trade.
trading is 100% educated probability ,don't take it personal.

Long IdeaI'm seeing a possible bullish cypher pattern forming for the mini blow off top for btc. This mimics the SPX500 and currently in lagging state. Ater that, it will go back around 50k - 60k area, probably to eliminate saylor out before going to the 240k - 280k region..

BITCOIN BITCOIN ,instead of forecasting the price movement, i will follow its price action,
break of the current supply roof on 3hr is a buy confirmation and target will be 115-117k and if we retest and fail to break the descending 3hr supply roof we are selling and target will be 94k (ema+sma ) strategy 4hr demand floor and aggressive sell will be around 90k zone .
NOTE ;everybody is a good trader ,but not everyone is patient enough to wait for a free trade.
trading is 100% educated probability ,don't take it personal.
focus on learning ,rather than how rich you want to become overnight.

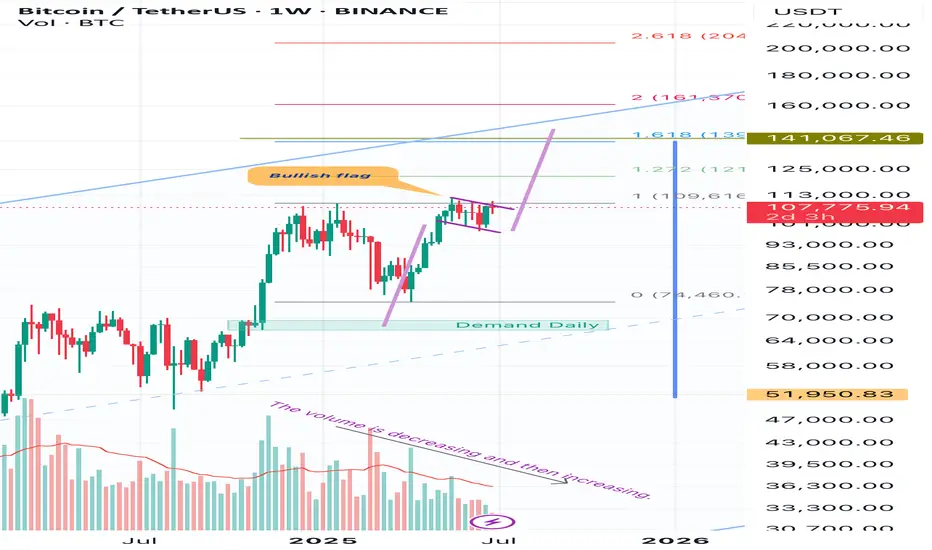
BtcusdtHello friends, in these important days of the markets, I wanted to share an analysis of Bitcoin with you. I think it is in a bullish flag and the target is 136,000 and within reach. It is 140,000. And I think that considering that the volume is decreasing, this indicates that with a sudden increase in volume, it will exit this bullish flag upwards with great intensity and speed.
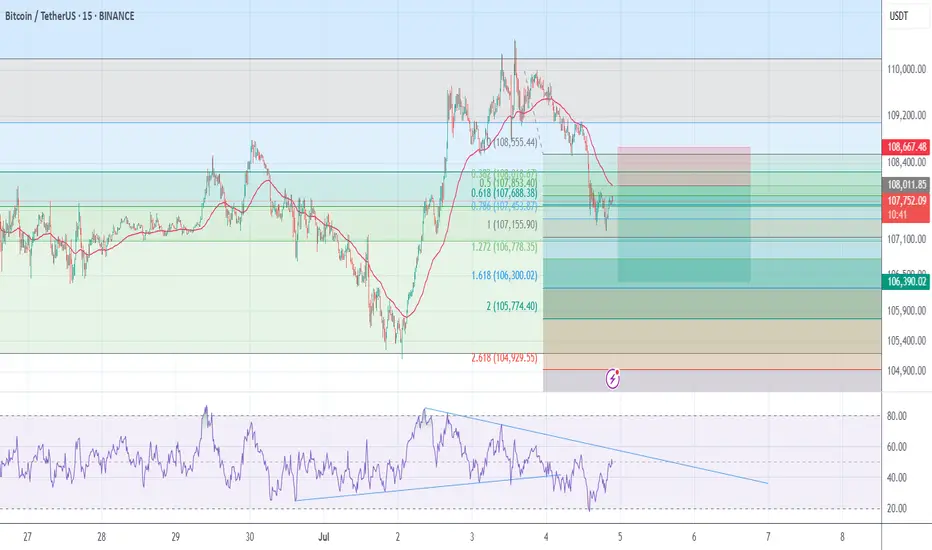
#Sell Bitcoinmy trading system is based on divergency and fibo.
#Sell Bitcoin
entry price = 108000$
T.P = 106400 $
S.l = 108700 $
RR = 2.5
Bitcoin Recovers Above 105,000, Extremely Bullish +AltcoinsBitcoin produced only two days red, a bear-trap, and is now trading daily back above $107,000, an extremely bullish development.
Good morning my fellow Cryptocurrency trader, I hope you are having wonderful day.
The altcoins market bull market is confirmed and what Bitcoin is currently doing gives further strength to the bullish case and bias. It will be only a matter of days before the entire altcoins market turns strongly bullish with major momentum.
The range is still valid though, $100,000 - $110,000. But this time around the upper-boundary is likely to break and the last ATH tested, a new all-time high is even possible and also highly probable which is what will propelled the altcoins to hit multi-year highs and some even new all-time highs. Many pairs will move ahead.
With each passing day, the Cryptocurrency market will continue to heat up. We can expect growth long-term.
The 2025 bullish cycle started with the 7-April market low. The start of the third wave started 22-June and should go for 2-3 months. Then we will have a correction, the fourth wave followed by one final jump, the fifth wave.
We can expect growth now and all through late 2025. The entire period will be bullish. Only when the marketwide correction comes there will be a pause but many pairs will grow even at this point.
Choose wisely. Low risk vs high potential for reward.
Aim high. Focus on the long-term.
Thanks a lot for your continued support.
Namaste.

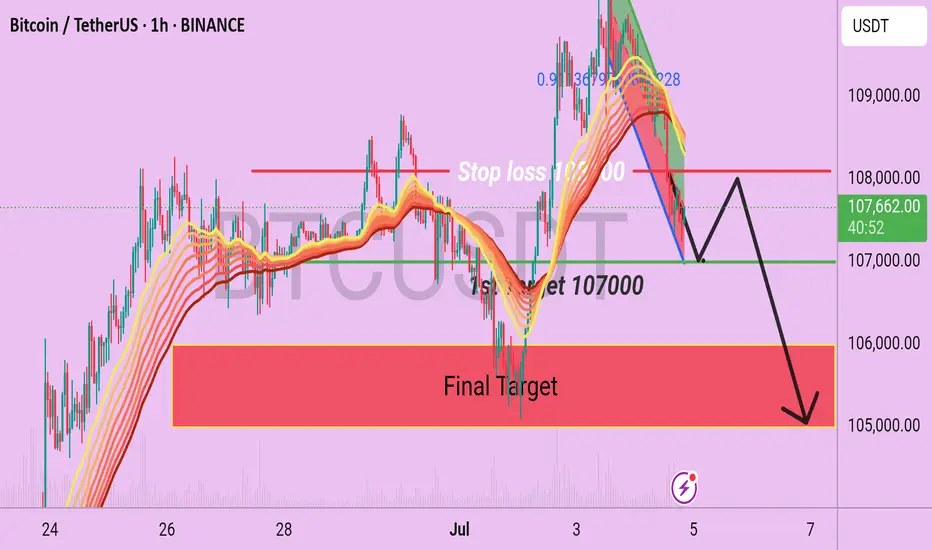
BTC/USDT H1 Chart Out look Bitcoin is Now running at near the 107500 and following a short term Bearish pattern on EMA 50 and 200 by using that we can consider on sell side with the given Targets like 107000 which is near the Bitcoin is consolidating and the Final target support is 106000/105000.
Bearish Scenario
1st Target is 107000 ( from here it may make some retest)
2nd Target is 106000( main target).
3rd Target is 105000.
Use stop loss at 108100.
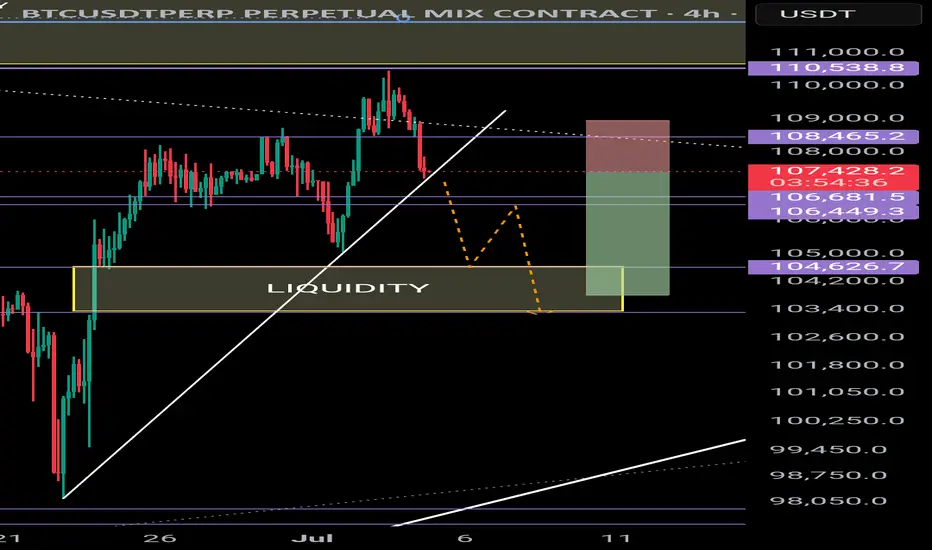
BTC correction - target4H
A break below the uptrend (white line) could result in a move down to 103,400 📉 which would fill a Fair-value-gap and grab liquidity.
Short position:
-3% vs +1%
2.3:1 Reward to Risk
All this just before Fedwire implements ISO20022?#bitcoin #btc price attempted a breakout but today failed with dumps. There "may" be other attempts but while ISO20022 subject is approaching, isn' t it wise to think about #xrp and other ISO20022 licenced coins will overperform the others (BTC, ETH, SOL and all other non iso certified coins) in near future? Not financial advice.

Outside of the analysis🔔 The Awakening of Legendary Whales | 9 Transactions from 14-Year-Old Wallets! 🔔🕯
Today, the market witnessed a rare event:
Addresses that had been completely dormant since 2011 (back when BTC was under $2!) suddenly woke up — each moving 10,000 BTC, worth around $1 billion!
📌 Details of some transactions:
💸 10,000 BTC
💵 Approx. ~$1.08B
📤 From: A wallet inactive for 14.2 years
⌛️ Time: 18:15
💸 10,009 BTC
💵 Approx. ~$1.079B
📤 From: A similar address, slightly different amount
⌛️ Time: 18:32
🖥 Analysis:
This simultaneous awakening of multiple ancient wallets, along with the movement of BTC toward exchanges, suggests:
There might be a large-scale plan behind the scenes
Possible market play by first-generation whales
Or a project undergoing restructuring and asset redistribution
👀 Interesting fact: In 2011, these addresses were only worth around $34,000. Today? They're moving billions.
💎 When Bitcoin’s past wakes up, the future starts to tremble…
BITCOINTHE pullback into structure will be watched ,if the daily candle gets rejects on the daily trendline, then the buy holds .if they fail then the daily cross supply roof will send price tanking
the price action is playing a quick one ,technically i wasn't expecting a break of 4hr demand descending trendline line acting as support floor. patience is key, allow the daily candle to close for clear directional bias..
the uptrend future will lie on daily candle close and the weekly candle close will be the final verdict.
trading is 100% educated probability, so don't take personal, even when your analysis are wrong ,accept it and try again.
overall, resilience and consistency are what will distinguish you from other traders.
do have a happy blessed weekend.
we coming new week on money and winnings .
#btc #bitcoin #gold #silver #copper

Bitcoin will Bearish conformed Structureon Thursday Bitcoin Price briefly reclaimed at 110K this morning as macro tailwinds and institutional flows lifted crypto but analysis say clear catalyst is still needed to break all time high after the long impulsive rally earlier in the year.
BTC has been trading with in descending channel on the daily time frame looking after the Long time price will needs break and catch there Support 105K Level if the price stays below more then could next zone formed 102K
You may find more details in the chart i need support from you Guys And feel free to share your thoughts other views in the comments.

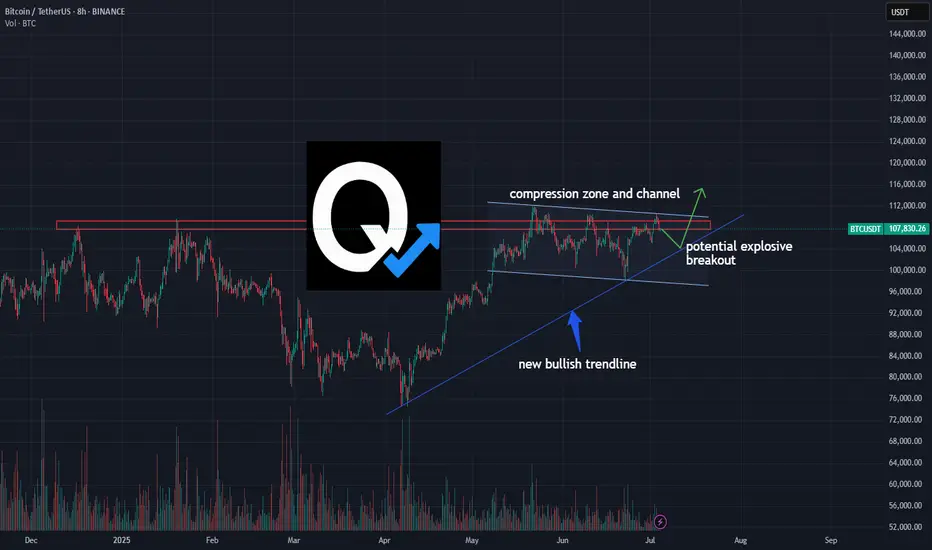
BTC/USDT – Compression Points to Potential Explosive BreakoutBitcoin is grinding into a major compression zone between horizontal resistance and a new bullish trendline. Volume is tightening, structure is intact, and the pressure is building.
This 8H chart highlights a classic breakout setup — a squeeze inside a channel, supported by an ascending trendline that has held clean since April.
🚀 A breakout above $110K could open up rapid upside continuation.
🧭 A retest of the trendline would offer a possible high-reward long entry.
📉 Breakdown invalidates the structure — watch $104K closely.
This is not financial advice — just a breakdown of what the chart is showing. Trade safe, think independently, and manage your risk.
#BTC #Bitcoin #CryptoTrading #BTCUSDT #TechnicalAnalysis #BreakoutSetup #CompressionZone #QuantTradingPro
Bitcoin Technical Analysis – Key Supports in Focus🔥 Bitcoin Technical Analysis – Key Supports in Focus
Bitcoin (BTCUSDT) is currently going through a correction after its recent rally. All eyes are now on the $107,000 support level. If this zone holds, we might see a bullish bounce from here.
⚠️ However, if BTC loses this support, the next strong demand zone lies at $105,300 — a critical level to watch for any potential reversal.
📈 On the upside, if bulls take control and price rebounds, the first target would be $113,700, followed by $117,800 as the next major resistance.
🧠 Smart traders are watching these levels closely — don’t miss the next move.
🔔 Follow for more real-time insights, clean charts, and professional TA!
#BTC #Bitcoin #CryptoTrading #BTCUSDT #TechnicalAnalysis #TradingViewIdeas #SupportAndResistance

Final move by the bears? Bulls lining up for ATHHi traders and investors!
Buyers have reached the first target at 108,952.
On Binance spot, BTC missed the second target (110,530.17) by just 99 cents.
Is this a setup for a breakout and a run toward a new ATH?
So far, the price action looks like a level manipulation around 108,952: volume in all 3 bars interacting with this level is concentrated above it.
Just below lies a buyer zone (107,500 – 105,100).
I am watching for buyer reaction once the price reaches this area.
This analysis is based on the Initiative Analysis concept (IA).
Wishing you profitable trades!

BTC shorting opportunity comes againBTC climbed above 108000 again, and the short-term bullish power was slightly stronger. According to the current strength, BTC still has room for growth, but it is still under pressure in the 109000-110000 area in the short term; if there is no major positive news, BTC may find it difficult to break through the resistance area in the short term under the current conditions, and may even experience stagflation and retreat again after approaching the resistance area.
Therefore, I think shorting BTC with the help of the resistance area is still the first choice for short-term trading. We can boldly short BTC in the 108500-109500 area and look towards the target area around 106000 again.

BTC/USDT 4H – High-Probability Decision Point Ahead Bitcoin is currently retesting a confluence-rich zone — a textbook decision area where structure meets sentiment.
🔻 What’s in play?
🟥 Demand Zone / Bullish Order Block / Breaker Block (visible on 1H)
📈 Third-touch test of the ascending trendline – statistically known to trigger strong moves
⚪ Price sitting just above the 200 EMA acting as dynamic support
🧱 Prior resistance flipped to support — now being validated again
Despite the correction, structure remains intact. This is a healthy retracement unless price starts closing below trendline + zone with volume.
🔀 Possible Outcomes:
Bounce: If buyers step in here, this could mark the next leg in the uptrend.
Breakdown: A strong close below the zone/trendline could shift structure and sentiment bearish.
⚠️ No trade bias here — let price show its hand.
💬 What’s your view — bounce or break? Comment below!
✍️ Chart marked with structure logic only — not financial advice.

BTC Trade SetupBTC will not take any major correction until it sweeps upside liquidation and close with big red candle, So take the long only on BTC. Wick possible below the SL. I will hold the trade without sl if it comes to entry, if tp achieved first then ignore the trade. Also July breakout possible for BTC, July always positive for BTC, let's see.

