War news are actually good news for Crypto & GoldI Love Global Peace and hope all Wars end soon.
Here are my thoughts about Crypto when war Starts between two countries or more.
i think After wars so many reasons will help Crypto to see gain specially for Bitcoin which is the King of this market.
Some of the major Reasons in my view are:
A. Countries currency or Markets start to fall :
Usually with starting of war, we have two countries that are involved and due to negative effects of war on different Economic parameters cause weaker country or both currencies lose the power of Their currencies and it start To dump.
weak countries Bank can get hacked or worst scenario a countries currency can get 0 by the time.
most of the times Their stock markets also Face with huge losses.
B. People start to Buy more Gold or Bitcoin and ...
with things mentioned above and other reasons their People start to Buy more Crypto usually and Metals like Gold.
C. People start to migrate to other countries with their Crypto Wallets Only
Some start to leave their countries and Sell their Cars homes and ... and turn them to BTC or... and transfer their money and life to a peaceful country.
D. Spies and bribery gets more in those countries which all is done with Crypto usually
Corruption & Spy jobs and ... increases in those countries usually and the money on this Fields usually transfer Via Crypto or Gold and Silver which is harder to track.
And with these reasons which mentioned Above usually in the past all the Attention comes to Metal like Gold and the Value of it increase in Wars, but now Days Bitcoin(&Crypto Tokens) also gets more value and attention in war in my personal View and See gain in price too.
DISCLAIMER: ((trade based on your own decision))
<<press like👍 if you enjoy💚
BTCUSDT.P trade ideas

TradeCityPro | Bitcoin Daily Analysis #118👋 Welcome to TradeCity Pro!
Let’s dive into the Bitcoin analysis and key crypto indexes. As usual, in this analysis, I’ll review the futures triggers for the New York session.
⏳ 1-Hour Timeframe
On the 1-hour timeframe, the price remains within the same range box between 108619 and 110256, and it is currently sitting at the bottom of that box.
✔️ Since yesterday, market volume has significantly declined — as you can see, there's practically no real volume in the market.
⭐ On the other hand, it seems the 108619 trigger is about to be activated, and price may move downward. However, personally, as long as market volume stays this low, I prefer not to open any positions.
📊 If we see selling volume entering the market following a break below 108619, I’ll consider opening a short position. But in the current situation, as mentioned, I prefer to stay out of the market.
💥 The RSI oscillator is steadily and gradually declining like a waterfall. This is also due to the lack of volume in the market, which has led to very low price volatility.
⚡️ So for now, it's better not to rely on RSI data because without volume, RSI readings won't be useful.
📈 If the price gets supported at the 108619 level with a good buying volume and starts moving toward 110256, the chance of breaking that level will increase significantly.
👀 If that happens, I’ll personally try to open a long position once 110256 breaks. But I think today, Saturday, and Sunday will remain the same in terms of market conditions, and real volume will likely return starting next week.
👑 BTC.D Analysis
Moving on to Bitcoin Dominance, a descending trendline can be drawn here, which has been tested twice and is now being approached again.
☘️ If BTC dominance gets rejected from this trendline and moves downward, it will likely reach the 65.04 support level. If the trendline breaks, the next resistance will be 65.64.
📅 Total2 Analysis
Looking at Total2, you’ll notice it’s showing more bearishness than Bitcoin and has lost the support it formed at the 1.15 level.
💫 This happened because BTC dominance has been rising since yesterday, which means more money has been flowing into Bitcoin than into altcoins.
🔼 The next support level for Total2 is at 1.13, and a potential downside move may reach this zone. The suitable long trigger remains a break above 1.17.
📅 USDT.D Analysis
Finally, USDT Dominance has exited the range box it had formed and climbed back above the 4.78 level.
🎲 If this upward move continues, the next major resistance will be 4.90. However, if this move turns out to be fake, the short trigger for a bearish reversal will be a break below 4.72..
❌ Disclaimer ❌
Trading futures is highly risky and dangerous. If you're not an expert, these triggers may not be suitable for you. You should first learn risk and capital management. You can also use the educational content from this channel.
Finally, these triggers reflect my personal opinions on price action, and the market may move completely against this analysis. So, do your own research before opening any position.

Lingrid | BTCUSDT possible Channel Break - Upside Surge The price perfectly fulfilled my last idea . BINANCE:BTCUSDT is pulling back slightly after rejecting the descending red trendline near the 108,000 level, while remaining above the breakout zone around 105,000. The structure suggests a potential bullish continuation if the price holds this level and forms a higher low. A successful breakout above 108,000 could ignite a move toward the 111,000 resistance band.
📈 Key Levels
Buy zone: 105,000–105,300
Sell trigger: breakdown below 105,000
Target: 111,000
Buy trigger: breakout and retest above 108,000 with strong momentum
💡 Risks
Failure to hold 105,000 reopens path to 98,700
Bearish rejection at 108,000 could maintain lower high structure
Weak volume breakout may lead to a bull trap under 111,000
If this idea resonates with you or you have your own opinion, traders, hit the comments. I’m excited to read your thoughts!

Is Bitcoin still bullish?Many still don't realize that the US economy is based on selling stable debt, for example, they give a loan to one country with a two-year repayment period, then they give the same loan in the form of another loan to another country with a shorter period, for example, one year.
With this description, I think that with the huge volume we have had for sale in the past months, the price should now have a deep correction.

A Comprehensive Analysis !!!This market has shown disregard for technical patterns, and every time the price approaches historically significant levels, it reveals its true intentions and disappoints us. This cycle tends to repeat.
In my opinion, we’re likely to see one more drop in Bitcoin’s price. After that, instead of continuing the expected downtrend from the pattern, the price could break the descending formation and experience a strong upward move.
Stay Awesome , CobraVanguard.

Bitcoin(BTC): Buyers Took Control | $120K is More Than RealisticBitcoin is getting ready to form a new all-time high (ATH), where after a slight rejection near the $110K area, buyers are back.
As we had recently broken the major resistance zone, and now we are seeing signs of a successful retest to occur as well, we are looking for proper volume to come in, which would then give us a possible BOS here; that's what we are looking for.
As soon as we form that BOS near $110K, we will be looking for another healthy bullish movement.
Swallow Academy

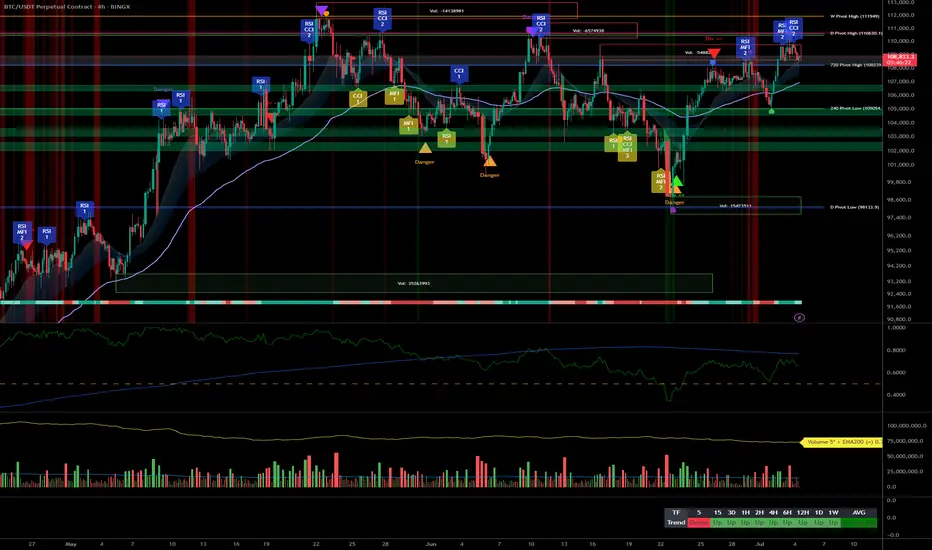
Bitcoin Analysis: Risk under 108k, aiming 111k+ in continuation__________________________________________________________________________________
Technical Overview – Summary Points
__________________________________________________________________________________
Momentum: Strong uptrend across all major timeframes (MTFTI “up”). Buyers remain in control; daily/4H/1H structure robust.
Key supports: 108,239.1 (720min Pivot, critical transversal support), 105,054.7 (240min Pivot), 99,581 (240min Pivot). Active defense seen on 108,239.1 at all timeframes.
Main resistances: 110,630.1 (1D), 110,483.1 (240min), 111,949 (W). The 110–111k area acts as the short-term ceiling.
Volume: Moderate activity, no spikes or climaxes, slight intensification noted on the 30min during key tests.
Risk On / Risk Off Indicator: “STRONG BUY” signal on all Tfs ≥30min, contributing to marked bullish momentum. Minor short-term divergence only on 15min.
Multi-TF behavior: ISPD DIV and Investor Satisfaction are neutral, no extreme behavioral stress; psychology is balanced, neither panic nor euphoria.
__________________________________________________________________________________
Strategic Summary
__________________________________________________________________________________
Overall bias: Bullish, synchronized multi-timeframes, dominant bullish liquidity.
Opportunities: Optimal long entries on validated pullback to 108,239.1, add on breakout of 110,630–111,949. Gradual partial take profit recommended in the 111k area.
Risk zones: Invalidation below 108,239.1 (confirmed H2 close), risk of further correction toward 105k then 99.5k; suggested swing stop under 108,000.
Macro catalysts: No major event, global markets stable. Geopolitical tensions monitored, low short-term impact.
Action plan: Prioritize “buy the dip” on pivots, active monitoring for any breakout/failure. Dynamic stop management, partial profit-taking on extension.
__________________________________________________________________________________
Multi-Timeframe Analysis
__________________________________________________________________________________
1D: Very strong daily structure, high momentum, intermediate supports near 98k/100.5k. Watch for major resistances at 108–111k.
12H/6H/4H: Ranging below 110–111k resistance, no fragility. Supports 108,239.1 and 105,054.7 holding, no selling pressure detected. Watch for breakout/impulse.
2H/1H: Buy zone if maintained >108,239.1, risk of sell-off below this pivot toward 105k. Price is ranging, momentum remains positive.
30min/15min: Consolidation on supports. 15min: temporary divergence on the Risk On / Risk Off Indicator but bullish structure intact unless a clean break below 108,239.1.
Risk On / Risk Off summaries: Dominant “strong buy” tone, synchronized momentum, only weak short-term divergence. No behavioral stress (ISPD DIV neutral everywhere).
__________________________________________________________________________________
Cross-analysis and recommendations
__________________________________________________________________________________
Momentum: Bullish environment sustained as long as >108,239.1. Continued upside bias if breakout above 110–111k is confirmed.
Risks: No major vulnerabilities detected. Very low probability of a local top, except in the case of exogenous macro shock.
Macro & On-chain: Stable newsflow, no distribution from HODLers or significant new inflows. Preferred strategy: swing trading in trend direction, tight stop under the main pivot.
__________________________________________________________________________________
Decision summary
__________________________________________________________________________________
Preferred scenario: Hold long >108,239.1, add on validated pullback, look for breakout with volume extension to 111k+.
Risk management: Stop under 108,000, partial profit-taking in the 110,630–111,949 area.
No immediate macro constraints: Use this calm window to ride the trend.
Monitoring: Resilience of the main support, any sudden geopolitical shocks.
BTC/USDT keeps a clear bullish bias, favoring swing or trend-following strategies as long as key pivots hold. Buy the dips remains optimal while technical structure holds; strict stop management is advised pending any “breakout fail”.
BTC - Bullish retest to ATH?Made a composite profile of that little range we had last week.
We took out the lower npoc, then took out the higher npoc and the internal equal highs (which was the only short I see for now)
I'm looking for 107.2-3 to get a bullish reaction, long from there into a clean-up of the 112k highs.
If the July 2nd lows don't hold, I'd look for the 101k npoc, or maybe a frontrun of that at the imbalance fill around 103k.

Bitcoin Bulls Are Losing Power - Signal To Sell NOW!!!?Bitcoin Bulls seem to be losing power. If this rising wedge aka Contracting triangle starts to break down, the descending triangle we are trading at will resume and MARKETSCOM:BITCOIN might go as low as $93k!!! Is your trading strategy ready for that?

BTC Looking To Break Above Resistance Of Bull-FlagBTC showed a strong move off support at 100310 that is now looking to break above resistance of the bull-flag, which will signal the end of the decline. A daily break above 106800 is confirmation of the uptrend continuation, which should target ATH in the first instance. Following a pullback, BTC should then make its way to new highs, with a first target at 138000, which is a 100% extension from 74500, with a bull-flag mid-point.
Trades
Long on a break above the descending resistance (close on the 30min chart)
Add to long position on a break above 106800
Reduce position size at 112000, to allow for a brief pullback or potential consolidation at ATH
Return to 100% allocation on a solid close above 112000 or a pullback to 106800

[SeoVereign] BITCOIN Bearish Outlook – June 29, 2025We are the SeoVereign Trading Team.
With sharp insight and precise analysis, we regularly share trading ideas on Bitcoin and other major assets—always guided by structure, sentiment, and momentum.
🔔 Follow us to never miss a market update.
🚀 Boosts provide strong motivation and drive to the SeoVereign team.
--------------------------------------------------------------------------------------------------------
Hello,
This is Seobeorin, approaching technical analysis not as a result but as a prediction, from a realistic perspective.
I am presenting a bearish view on Bitcoin as of June 29, 2025.
If you refer to the Ethereum idea from June 27, 2025, you can confirm that I presented a bearish perspective on Ethereum at the time. The basis for that perspective is still valid, and we are currently waiting for the take-profit level to be reached. The reason I selected Ethereum at the time was because I believed that the downward pressure on Ethereum was relatively stronger than that on Bitcoin.
However, based on today’s Elliott Wave count on the Bitcoin chart, I now judge that Bitcoin is also likely to experience some short-term downward pressure. Therefore, I am presenting a short position idea on Bitcoin.
The first take-profit target is set near $106,056. Depending on future price movements, this take-profit target may be narrowed or expanded. I will continue to track this idea, and as it develops, I will align the reasoning accordingly to organize the thought process more clearly.
Thank you.

BTCUSDTBitcoin has two paths: if it stabilizes above 111,800, it can go to the target of 144,540, but if this move is a fake break, it can go to the targets of 91,410 and even 85,662, but it is expected to fall and then move.

BITCOIN TWO LONG TRADE SETUPS Two potential long trades for Bitcoin are mentioned.
Each trade has an entry point, profit target, and stop loss.
A bullish divergence in the 24-minute time frame is recommended before making the trade.

BTC Analysis (4H)This analysis is an update of the analysis you see in the "Related publications" section
Since the red arrow was placed on the chart, Bitcoin's bullish phase has ended and it has entered a corrective phase. This correction appears to be forming a Diametric pattern, and we are currently in the middle of wave E.
After interacting with the demand zone, the price may move toward the specified targets.
A daily candle closing below the invalidation level will invalidate this analysis.
For risk management, please don't forget stop loss and capital management
Comment if you have any questions
Thank You

BTC - Will the Bearish Channel continue?Market Context
After a strong impulsive rally earlier in the year, BTC has been trading within a descending channel on the daily timeframe. This corrective structure suggests a period of consolidation and redistribution, as price oscillates between the channel's boundaries. The repeated rejection from the upper trendline and the inability to break through key highs reinforce the bearish bias in this structure.
Buy Side Liquidity Sweep Potential
Price is currently positioned just beneath a relatively clean swing high, sitting above the mid-range of the channel. This high represents a clear area of Buy Side Liquidity—stop losses from short positions and pending breakout orders from longs are likely clustered there. An engineered sweep of this high would serve as a strategic move for larger participants to collect liquidity before driving price lower.
Fair Value Gap as a Pivot Point
Beneath current price lies a Fair Value Gap—a visible inefficiency formed during a fast upward move earlier in the structure. This Gap remains unfilled and offers a compelling target for price once the Buy Side Liquidity Sweep occurs. It represents a logical zone for price to rebalance before deciding on continuation or reversal. Should price break below the Gap cleanly, it would confirm the bearish intent and potentially accelerate toward the lower bounds of the channel.
Channel Continuation Structure
The overall geometry of the channel remains intact, and the price respecting both upper and lower boundaries strengthens the likelihood of a continuation toward the downside. If the Buy Side Liquidity Sweep and subsequent rejection occur, the market could be poised for another leg lower—possibly seeking the next structural support closer to 90,000 or even toward the lower extremities of the channel around 80,000–82,000.
Final Thoughts
This chart reflects classic price delivery behavior: corrective structure, engineered liquidity sweeps, and the magnetic pull of inefficiencies like Fair Value Gaps. Whether you’re actively trading or simply observing, this is a clean, educational setup to learn from.
If this breakdown helped you see the market a bit clearer, I’d really appreciate a like. And feel free to share your thoughts or counterviews in the comments—your insights make the analysis even more valuable.

Bitcoin has dropped for profitable purchasesBitcoin is within the range. Quite a bit of time has passed since the last retest, and the liquidity pool that has formed below 106345 may not allow the price to fall on the first attempt.
Global and local trends are bullish. Enter a buy position after a false breakout of support and the formation of a local reversal pattern on TF m5-m15
Scenario: if, after a false breakout, price consolidation forms above 106500, then the entry point could be a breakout of local highs (breakout of the structure - ‘bos’).

Bitcoin long back to $110000Recently opened a long position on bitcoin. Aggressive entry. Soon I anticipate a push back up to 110000
4hr trend is still in tact. 1hr trend is bearish failed to make new LL.
Lets see how it goes.
2RR trade roughly.

BTC price prediction As my personal analysis if BTC crossing 🚸 110655 without touching the previous high 111960 then BTC moving down 👇 directly or after sideways condition some days

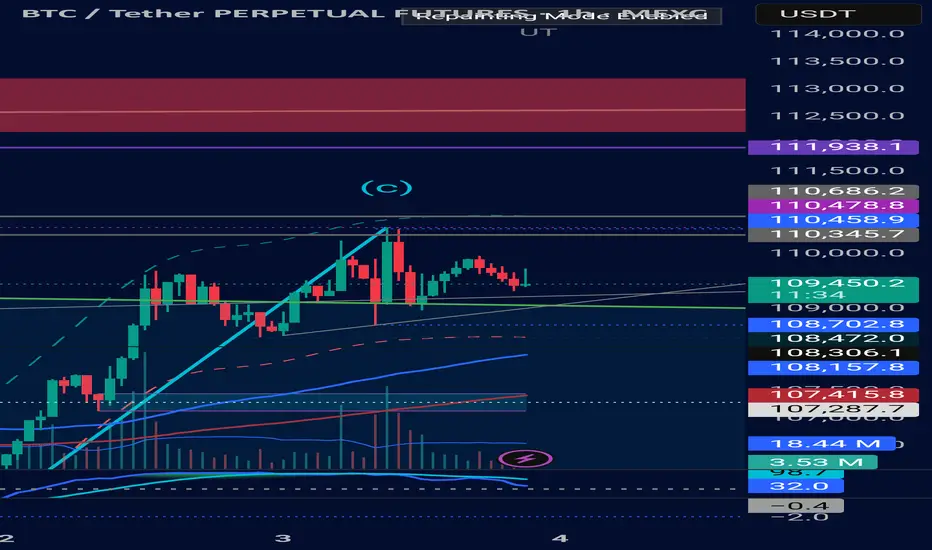
BTC Wyckoff distribution idea...Based on the Wyckoff distribution methodology, the current chart suggests an upward trajectory, considering the presence of unfilled CME and FVG gaps. The anticipated scenario involves a continuation of the UT phase, potentially reaching targets around 112k/113k, followed by a correction towards the CME gap at approximately 102.5k.
Subsequently, a continuation into the UTA phase is expected, which may indicate the conclusion of the bull market.
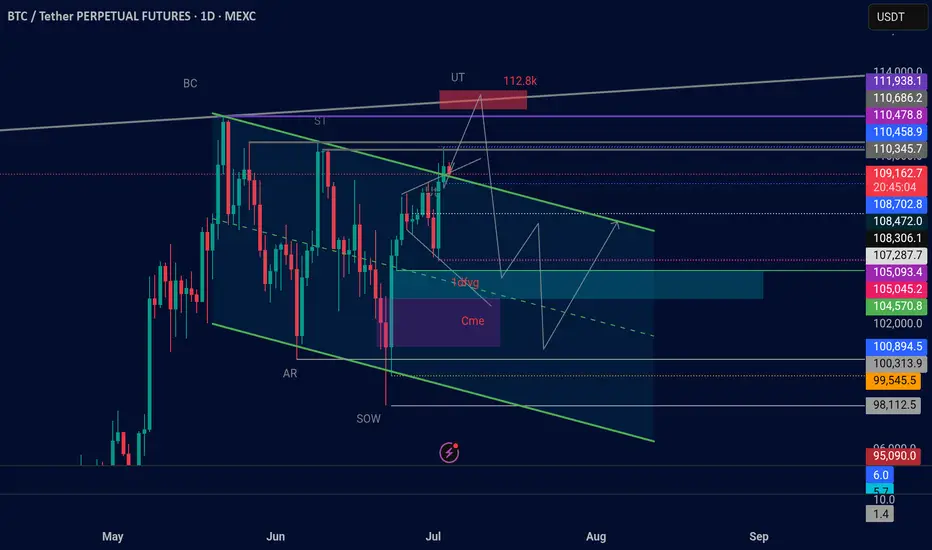
Btc Wyckoff distribution Based on the Wyckoff distribution methodology, the current chart suggests an upward trajectory, considering the presence of unfilled CME and FVG gaps. The anticipated scenario involves a continuation of the UT phase, potentially reaching targets around 112k/113k, followed by a correction towards the CME gap at approximately 102.5k. Subsequently, a continuation into the UTA phase is expected, which may indicate the conclusion of the bull market.
BTC breakoutIf the daily candle closes above the trendline, a breakout toward a new all-time high is likely to occur very soon.


CONSOLIDATIONfriends BTC will consolidate inside the channel for couple of days . if it break upside it will make all time high definitely. if it break downside there is chance of dump till 105k.
