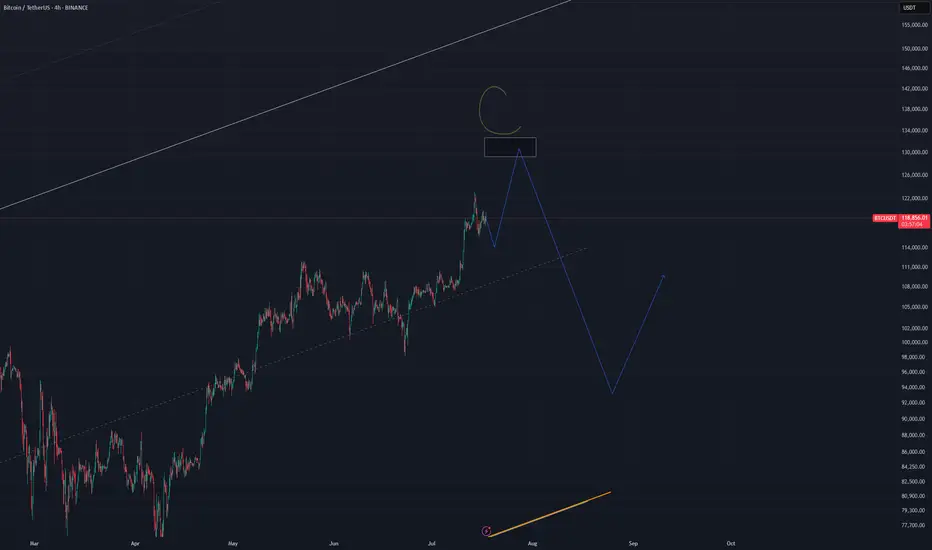
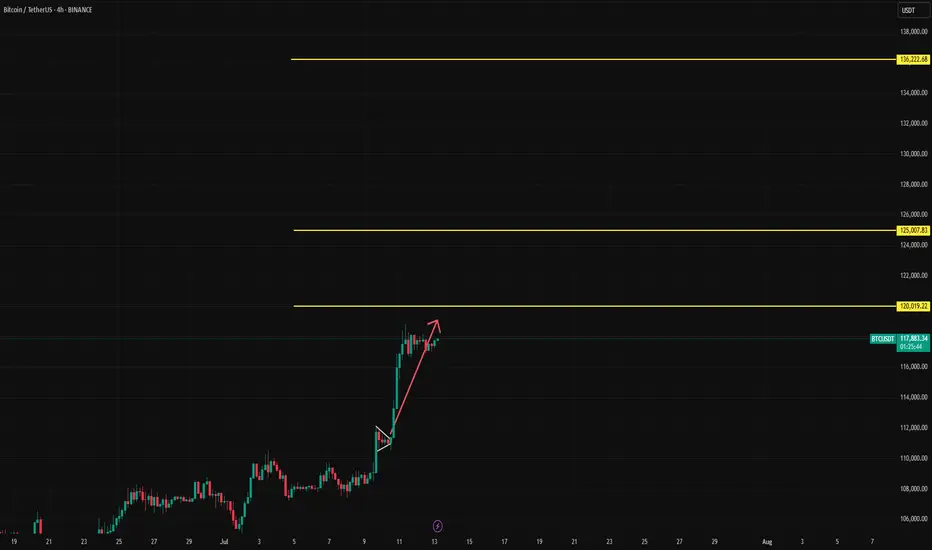
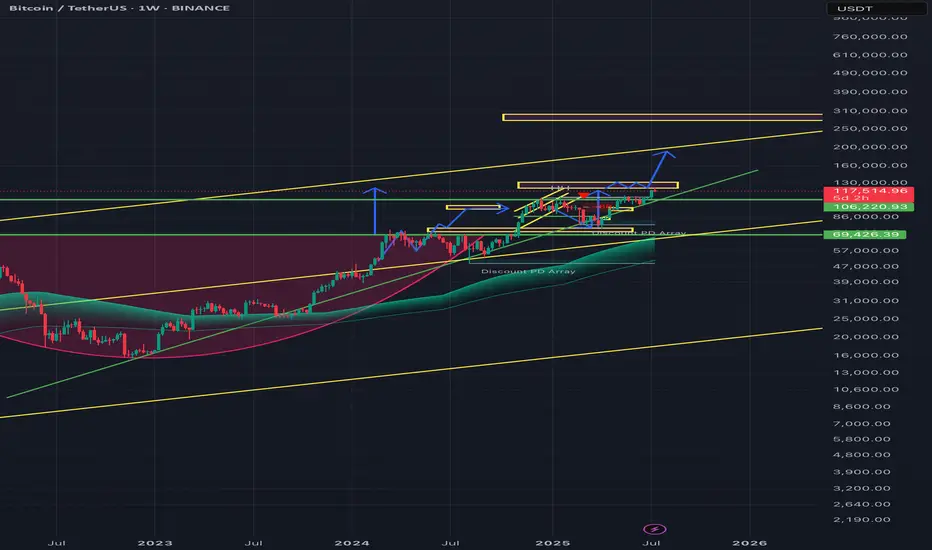
Still bullish on BTC, but this will be the LAST UP SWING!Take Profit around 130K.
Daily close above 133K will fail the analysis.
BTCUSDT.P trade ideas
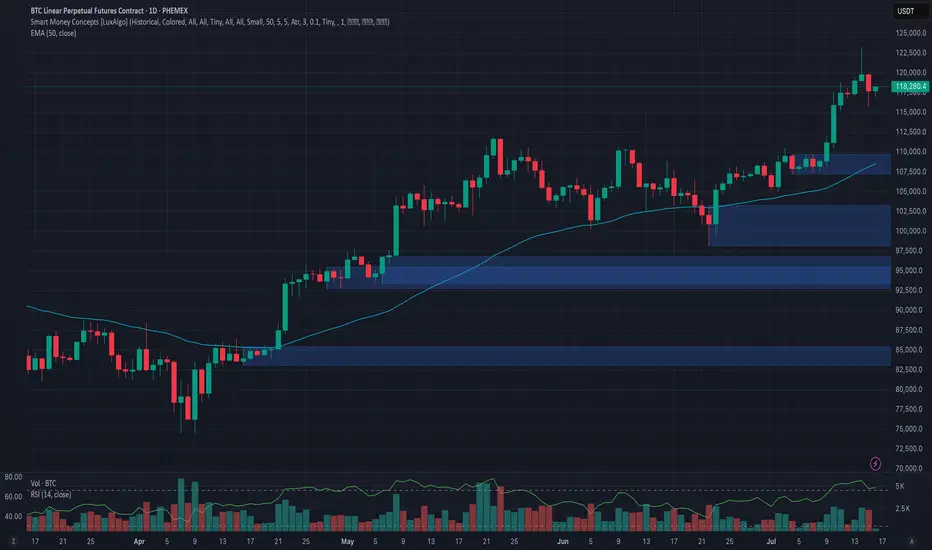
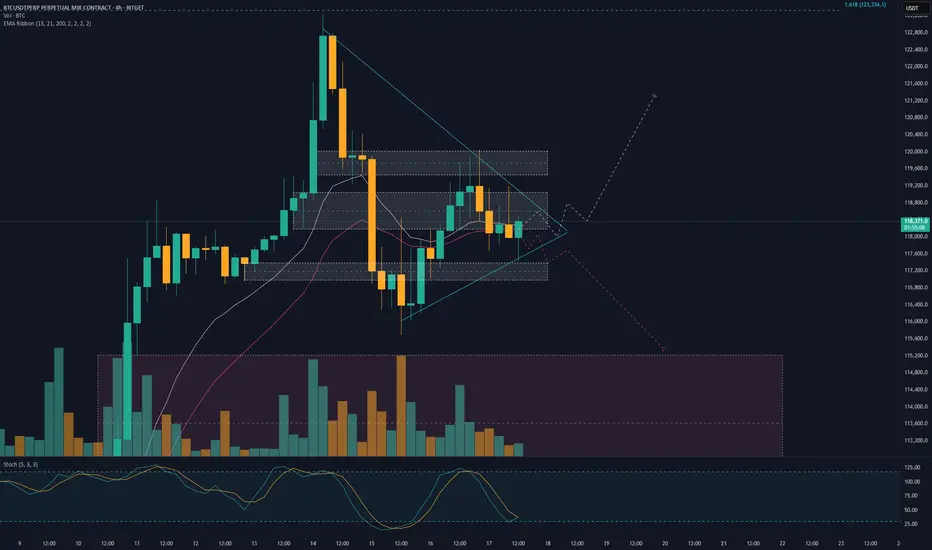
Phemex Analysis #97: What's Next for Bitcoin, After $123k?!Bitcoin ( PHEMEX:BTCUSDT.P ) recently made history by hitting an all-time high of $123,251 on July 14, 2025. However, enthusiasm was quickly tempered as BTC retraced by approximately 6%, dropping sharply to around $115,696 on July 15. Currently, the price has partially recovered and is trading at about $118,200.
With the market sentiment at a pivotal juncture following this volatile movement, traders and investors are carefully considering their next steps. Let's dive into several possible scenarios that might unfold in the coming days.
Possible Scenarios
1. Bullish Continuation (Breakout Above $123k)
If Bitcoin quickly regains bullish momentum, it may retest and surpass its recent high at $123,251. Breaking decisively above this resistance could trigger another strong rally, driven by renewed market optimism and potential institutional inflows.
Pro Tips:
Entry Strategy: Look to open or add to existing positions upon confirmation of a clear breakout above $123,251, especially if accompanied by high trading volume.
Profit Targets: Key resistance zones for profit-taking after a breakout include psychological levels at $128,000, and the significant milestone at $130,000.
Risk Management: Use protective stop-loss orders placed below the recent low around $115,000 to manage downside risks effectively.
2. Extended Consolidation (Range-Bound Scenario)
Bitcoin could enter a period of price consolidation, fluctuating between support at approximately $115,000 and resistance near $123,000. This scenario often occurs when the market awaits clearer directional cues.
Pro Tips:
Range Trading: Employ a grid-trading strategy, placing buy orders near support ($115,000–$116,000) and sell orders around resistance ($122,000–$123,000) to maximize profits from short-term volatility.
Monitoring Indicators: Keep an eye on declining trading volume, which often signals the potential for an upcoming breakout or breakdown.
3. Bearish Pullback (Correction Scenario)
Given the rapid recent surge to all-time highs, a deeper market correction remains possible. If BTC decisively breaks below support at $115,000 with strong selling pressure, further declines towards $107,218 or even $98,132 could ensue, especially if accompanied by negative broader market sentiment.
Pro Tips:
Short Opportunities: Experienced traders might explore short positions if BTC convincingly breaks below the $115,000 support level.
Accumulation Strategy: Long-term investors can strategically accumulate positions around significant lower support levels such as $107,218 and $98,132, provided price stabilization signals are evident.
Conclusion
Bitcoin is currently at a crucial technical and psychological level after hitting its latest all-time high. Traders should closely monitor the outlined scenarios—particularly watching key resistance at $123,251 and essential support at $115,000. By utilizing disciplined risk management, proactive profit-taking strategies, and careful market analysis, investors can effectively navigate BTC’s ongoing volatility and strategically position themselves for the next significant move.
🔥 Tips:
Armed Your Trading Arsenal with advanced tools like multiple watchlists, basket orders, and real-time strategy adjustments at Phemex. Our USDT-based scaled orders give you precise control over your risk, while iceberg orders provide stealthy execution.
Disclaimer: This is NOT financial or investment advice. Please conduct your own research (DYOR). Phemex is not responsible, directly or indirectly, for any damage or loss incurred or claimed to be caused by or in association with the use of or reliance on any content, goods, or services mentioned in this article.
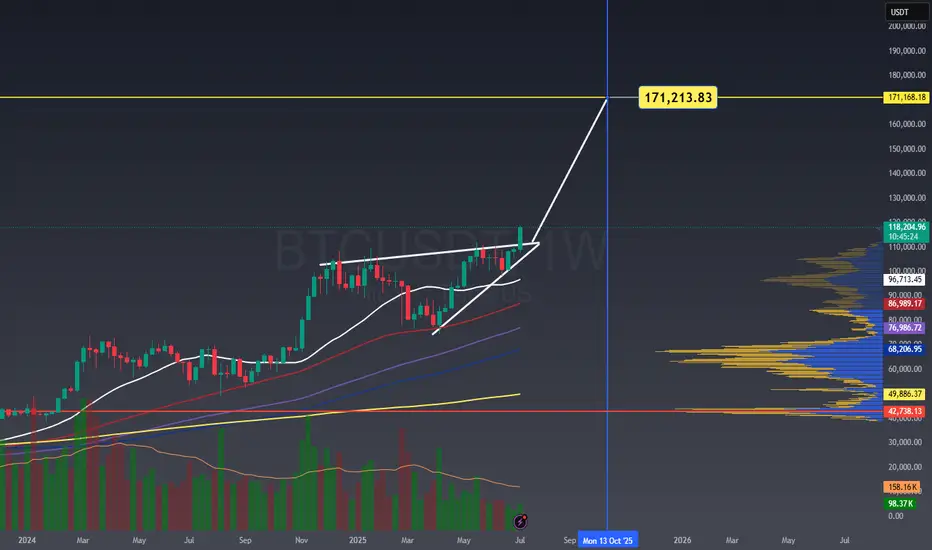
BTC TO 172K BY Oct 13, 2025BTC TO 172K BY Oct 13, 2025
rising wedge inverted head and shoulder measured move to the upside 172k
BTC - local situation (1h) SHORT🔻 Breaking down from a bearish pattern.
I expect a local decline to $114,000 - $112,000 on the 1h timeframe.
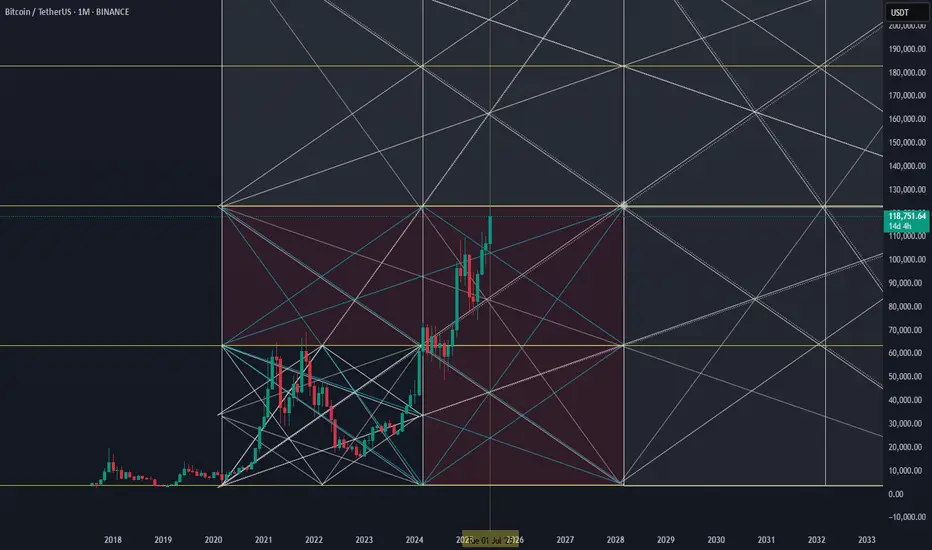
Cycle Top Theory: BTC 2025–2028 : The ₿ Line BreakoutCycle Top Theory: BTC 2025–2028" explores the probabilistic path of Bitcoin through the remainder of the current bull cycle. Combining historical market structure, halving-driven supply shocks, and volatility-based modeling, this thesis outlines potential top scenarios ranging from $xxxK to $xxxK.

BTC/USD bearish conf. finally?BTC printed a double top on the 5m and on the 1h.
BTC being very weak all over the day, even running against ETH and co.
That might be the signal for the retracement "everybody" is waiting for.
BYBIT:BTCUSDT.P

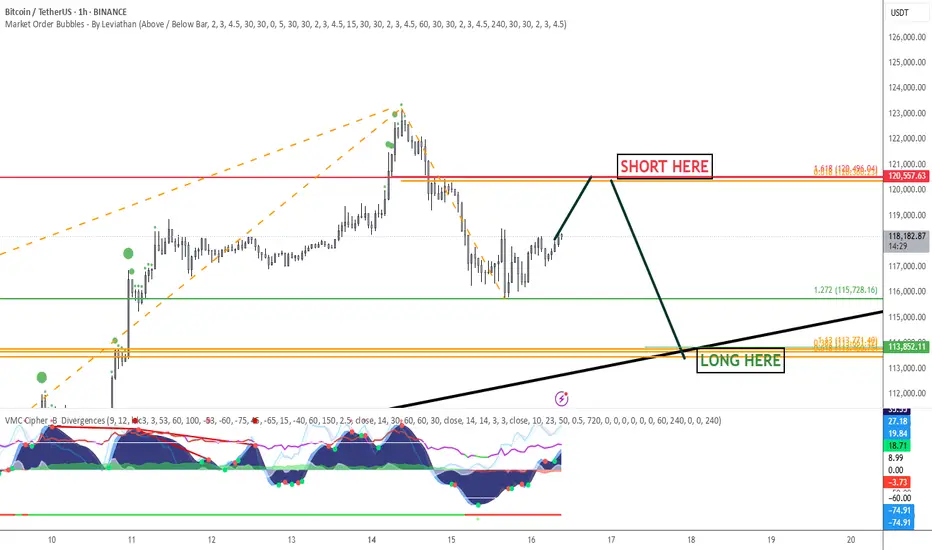
Bitcoin playbookSetup simple AF.
Everything is on the chart. First a small bounce into resistance 120 550 $, followed by a continuation to the downside, to the support level at 113 850 $ (to complete a classic ABC corrective structure)
HF & GL
BITCOIN LONG TRADEWaiting for pullback to 105k region, Might not happen as Bitcoin seems to keep ripping from past experience.

Volume Spread Analysis (VSA) reflects increasing selling!🚨 Bitcoin Market Update 🚨
Bitcoin recently hit an All-Time High (ATH) but is now experiencing a downward correction. Multiple technical indicators suggest continued bearish momentum:
📉 Volume Spread Analysis (VSA) reflects increasing selling pressure.
📊 A bearish engulfing pattern confirms the market is trending lower.
📕 The synthetic order book reveals a heavy concentration of sell orders.
📈 The 50 & 100 SMA are acting as strong resistance levels, keeping price action suppressed below them.
🔍 Key Watch Level: If BTC breaks above the 50 SMA, we could see a potential pump. However, as of now, all confirmations point toward a bearish continuation.
💡 DYOR – Do Your Own Research
🛑 Not Financial Advice

Global liquidity downtrend cometh!During this current BTC cycle, major uptrends in global liquidity have corresponded to major uptrends in the market 72ish days later. The last major uptrend in liquidity is about to run its course, pause, and then downtrend. If this relationship holds, we are at or near at least a pause in the local up trend. I have my popcorn ready to see if this plays out.
Note: The global liquidity prediction pauses until December 11th and then downtrends, so if we see floating higher prices until that point and then a pause, the relationship would still be valid.
Second Note: I will publish the BGL (Bitcoin Global Liquidity) indicator very shortly. Please test it out and DM me if you see any issues or have suggestions.
--Da_Prof

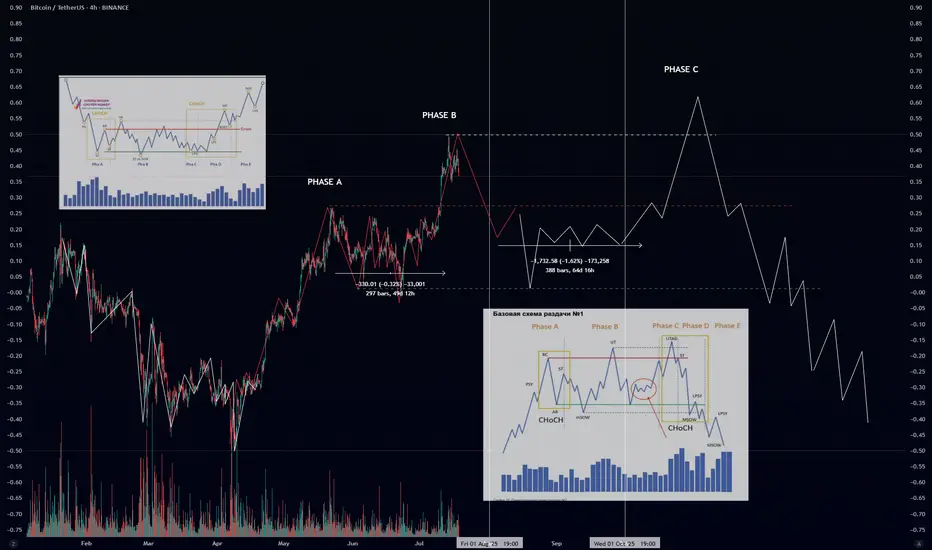
Wyckoff Distribution Schematic #1 – ExplainedIf you’ve ever wondered how smart money offloads their positions before a major downtrend — this is it. The Wyckoff Distribution Schematic #1 is the mirror opposite of accumulation. It reveals how institutions distribute (sell) to retail before the market collapses.
🔍 Phases Breakdown:
🟠 Phase A – Preliminary Supply & Buying Climax
PSY (Preliminary Supply): First signs of selling pressure.
BC (Buying Climax): Sudden surge in price with high volume – often traps late buyers.
AR (Automatic Reaction): Price drops as buyers lose momentum.
ST (Secondary Test): Retest of the top – often with lower volume.
🔄 CHoCH (Change of Character): Early warning sign that supply is increasing.
🟡 Phase B – Building the Cause
Sideways price action where large players distribute their holdings.
UT (Upthrust): Fake breakout above resistance.
mSOW (Minor Sign of Weakness): Slight breakdowns showing cracks in structure.
🔴 Phase C – The Trap
UTAD (Upthrust After Distribution): Final fakeout to trap bulls before the real drop.
Market often shows strength… right before the collapse.
Another CHoCH confirms the shift toward bearish control.
🔵 Phase D – Breakdown Begins
LPSY (Last Point of Supply): Final bounces with weak demand.
MSOW (Major Sign of Weakness): Strong breakdown on high volume — momentum shifts decisively.
⚫ Phase E – Downtrend
Distribution complete.
Price trends downward with weak rallies.
Retaiя is left holding the bag.
📊 Volume matters: look for volume spikes on upthrusts and breakdowns, and declining volume on bounces.
🔁 Compare with Accumulation:
Accumulation ends in Spring → Uptrend 📈
Distribution ends in UTAD → Downtrend 📉
ABC Short PositionThis is a live trade, ABC short position on the 1hr time frame. There is a larger short position on the 4hr chart if we break 111,865 area. Watching for reversals & ABC formations to the upside to closeout trade.

More up📈 Trading Tip – Long Position on Bitcoin (BTC)
As of today, Bitcoin is trading around $117,395, after retreating from an intraday high of $120,196. The price action follows a recent rally toward $123,000, followed by a healthy correction to the $116,000 area.
Technical Overview:
• The resistance zone at $119,000–$120,000 has been broken and could now act as future support.
• A potential inverse head and shoulders pattern is forming, suggesting a breakout toward the $160,000 level, if the support at $114,000–$115,000 holds.
• On the 4-hour chart: MACD is showing a renewed bullish crossover, and RSI is rising steadily without entering the overbought zone — both supporting further upside toward $125,000–$130,000.
🔹 Suggested Entry: Between $117,000 – $118,000, ideally after confirmation of support near the previous breakout zone.
🔹 Target 1 (TP1): $125,000
🔹 Target 2 (TP2): $130,000–$135,000 (depending on momentum continuation)
🔹 Stop Loss (SL): A confirmed break below $115,000 (preferably on the daily close or with strong sell pressure)
⚙️ Risk Management: Do not risk more than 2–3% of your total capital on this trade.
📅 Watchlist Note: Keep an eye on major economic data (e.g., U.S. CPI or Fed announcements) as they can heavily affect market liquidity and volatility.
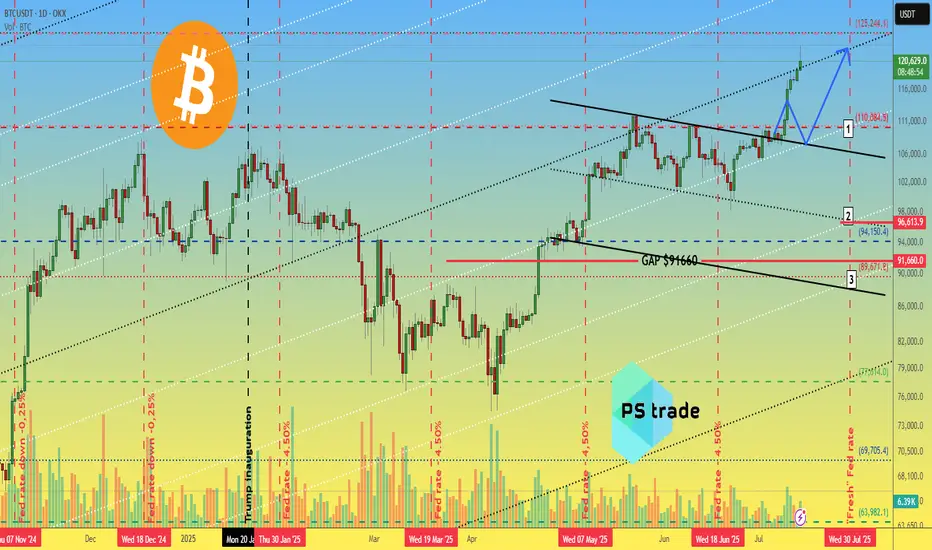
Bitcoin BTC price analysis📈 Two weeks have passed since the previous analysis of the OKX:BTCUSDT chart, and the market has decided to go with the 1️⃣ scenario.
Less than 3% remains to reach $125,000, and the price could easily get there by inertia, but that's a minor detail.
CRYPTOCAP:BTC is updating its ATH, and total liquidations on the crypto market over the past 24 hours are “only” $750 million, of which almost $450 million is accounted for by #Bitcoin.
Weak, very weak... Previously, longs were liquidated for $2+ billion, and it was reported that the actual amount of liquidations was significantly higher due to the fact that the exchanges' data was not fully disclosed. (For the sake of objectivity, at that time, the lion's share of liquidations was accounted for by altcoins, but now this is not the case).
◆ During this time, Trump introduced new tariffs — the market was “on a roll” — it swallowed it and didn't even notice the news.
◆ Tomorrow, July 15, the US CPI will be announced — the forecast is for inflation to rise from 2.4% to 2.6% (although there are rumors that the situation in the US economy is much worse and this may "come to light" tomorrow).
◆ July 16 - PII announcement - these indicators may act as a “cold shower” to bring the market out of its euphoria.
◆ From July 14 to July 18, the US Congress is considering three key crypto laws, including the GENIUS Act. Major players consider this a powerful driver. Perhaps the current growth has already “played out” and priced in expectations for news.
🪐 And this trading week will end on 18.07 with the start of Mercury retrograde, even the US Congress is postponing all important matters, and you still don't believe in it ))
🖐 Long positions are certainly beneficial, appropriate, and in line with the trend at present, but it is advisable to hedge them with stops, because as mentioned above: the price is rising, and there are few liquidations. During the previous decline in the cryptocurrency market, there were significantly more liquidations of long positions, and they may wish to repeat this.
And with the #BTCUSD price correction, there will be a fixation: some will have profits, and some will have losses in stablecoins, which would then be logical to reinvest as capital in altcoins. First in something more voluminous and less risky, and in the last stage, they will pump everything in a row)
But until then, we still need to survive and preserve our deposits.
So, in your opinion: correction to one of the levels:
1️⃣-$110k 2️⃣-$97k 3️⃣-$90k
or
is everything written above complete nonsense, and the market growth has only just begun to “take off”?
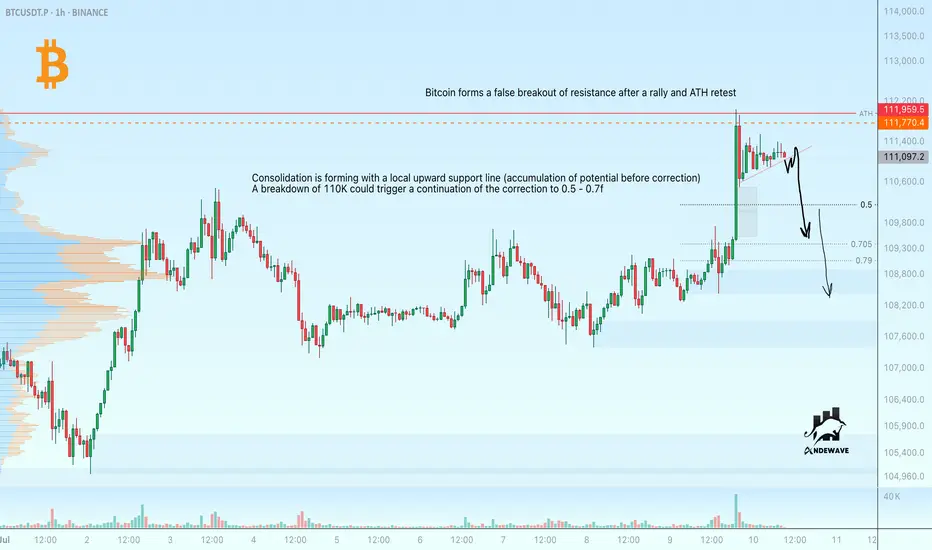
Bitcoin may correct after false ATH breakoutBitcoin is forming a false ATH breakout. There is a possibility of a correction beginning.
Consolidation is forming with a local upward support line (accumulation of potential before correction).
A breakdown of 110K could cause the correction to continue to 0.5 - 0.7f.
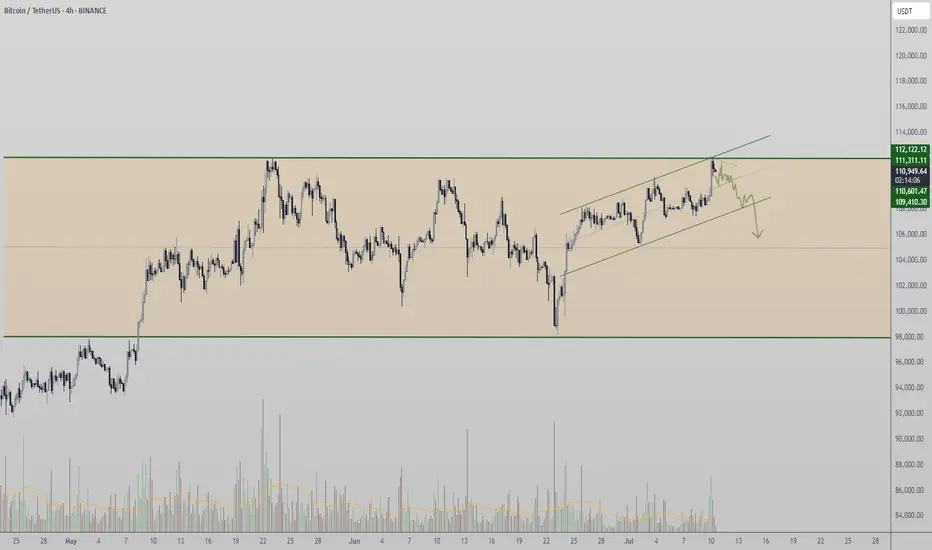
Bitcoin Tests Range High — Breakout or Rotation lower?Bitcoin is currently trading at a critical resistance level — the previous all-time high — which also marks the upper boundary of its multi-month high time frame range. While many are watching for a breakout, price action suggests that a continuation of range-bound behavior is still the more likely scenario. Without decisive volume or structural confirmation above this resistance, BTC may be gearing up for another rotation toward lower support.
Key Technical Points:
- Key Resistance at ATH: Bitcoin is retesting its prior all-time high, which is the current range high
- Volume Remains Weak: Lack of breakout volume signals indecision and caution
- Liquidity Now Resting Below: Upside liquidity has been cleared; downside offers more incentive for market makers
Bitcoin’s price has once again returned to the range high, aligned with its previous all-time high — a level that has consistently capped price over recent months. This area has acted as a significant inflection point where momentum has historically slowed, and price has failed to push through with conviction.
Currently, price action is showing signs of stalling, and importantly, there has been no influx of volume to suggest a true breakout is underway. When volume fails to accompany a test of resistance, it often signals weakening demand or exhaustion from buyers — increasing the risk of a false breakout or rejection.
Additionally, the upside liquidity has already been taken, meaning there’s now less incentive for large players to push price higher in the immediate short term. In contrast, resting liquidity lies beneath current levels, offering greater appeal for a downward move — particularly for market makers seeking efficiency and liquidity capture.
From a technical perspective, Bitcoin remains range-bound until a decisive breakout above the highs occurs with supporting volume and strong candle closures. As of now, this has not happened, keeping the likelihood of a rotation lower well on the table. Should price begin to trade down, watch for a move toward the mid-range or even the lower boundary of the range, depending on how momentum unfolds.
Unless Bitcoin breaks above its all-time high resistance with strong volume, expect the range structure to hold. A lack of bullish follow-through may lead to a rotation toward lower support levels.
BTC AI Prediction Dashboard - 6h Price Path
BTCUSDT Forecast:
Crypticorn AI Prediction Dashboard Projects 6h Price Path (Forward-Only)
Forecast timestamp: ~13:45 UTC
Timeframe: 15m
Prediction horizon: 6 hours
Model output:
Central estimate (blue line): ~118,370
40% confidence band (light blue): 117,719 – 118,563
80% confidence band (dark blue): 117,040 – 119,652
Volume on signal bar: 331.4
Observations:
Price currently near central estimate, within 40% band
Continuation likely as long as price remains within 80% band
Moves outside 80% = low-probability fade or potential breakout
Model does not repaint. Forecast is fixed once published.

Yeet! You thought "Why are these market so fake and scammy" is our daily crypto mantra. We extend this tradition

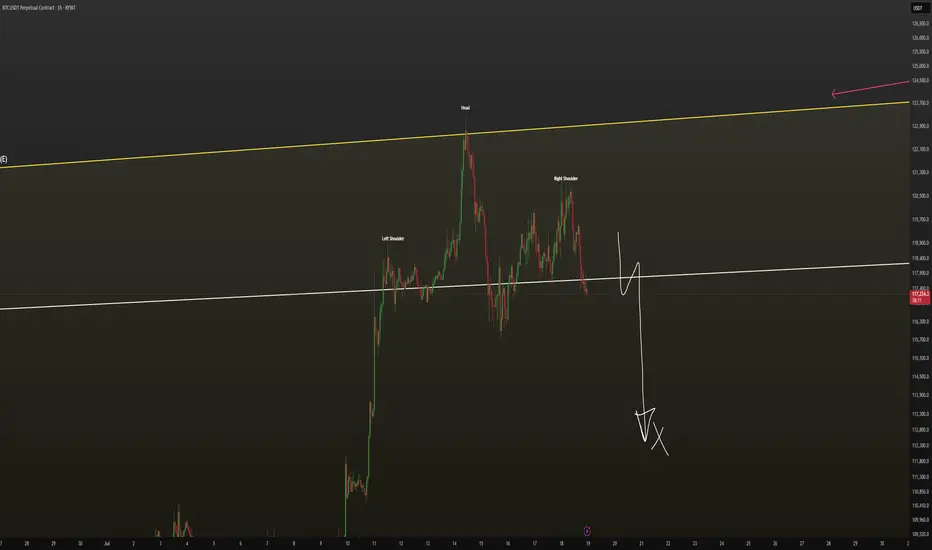
Possible correction toward a 112,600$📥 On the lower timeframes, a head and shoulders pattern has formed, which could trigger selling pressure down to the 112,600 level in the short term. This correction on the lower timeframes might also cause a minor pullback in the altcoin market, potentially creating a good buying opportunity

BTC-----Buy around 121100, target 121800 areaTechnical analysis of BTC contract on July 14:
Today, the large-cycle daily level closed with a small positive line yesterday, the K-line pattern continued to rise, the price was above the moving average, and the attached indicator was running in a golden cross. The overall trend is still very obvious, and it can be seen from the overall trend that the retracement is very small. After the shock correction in the two trading days over the weekend, it rose strongly again during the day and broke through the previous high position, so we keep the main idea of buying on retracement in trading; the short-cycle hourly chart intraday price broke upward, the starting point was 118880 area, the current price is consolidating at a high level, the K-line pattern continued to rise, and the attached indicator was running in a golden cross. If we look at the continuation of the high closing today, two conditions must be met: the European market price broke through the intraday high; the retracement cannot break the starting point, otherwise it will be difficult to fall.
Today's BTC short-term contract trading strategy:
Trade in the 121100 area when retracement, stop loss in the 120500 area, and the target is the 121800 area;
