BTC - Falling Correction = Continuation?BTC has been playing by the rules lately!
Every time Bitcoin forms a falling correction, it turns out to be a bullish continuation pattern — and history might be repeating itself 👀
As shown on the chart:
Previous falling channels (flag/wedge structures) have consistently led to strong bullish impulses.
The current correction also appears to be a falling channel, hinting at another potential bullish leg soon.
As long as the structure holds and no major support is broken, the next target could be a new all-time high.
Let’s see if BTC continues to respect this textbook behavior.
📌 Remember: Falling corrections in an uptrend = healthy continuation!
📚 Always follow your trading plan regarding entry, risk management, and trade management.
Good luck!
All Strategies Are Good; If Managed Properly!
~Rich
BTCUSDT.P trade ideas

BITCOIN PULLBACK 110.000🔹 The uptrend remains intact
After setting a new high, the price may enter a mild correction toward the $110K zone.
Key support levels in this uptrend are:
✅ $115K
✅ $110K
✅ $105K
As long as the price holds above $105K, any pullback is considered healthy and the uptrend is likely to continue.
📊 A shallow correction is part of a healthy market structure.

Bitcoin’s Wild Ride to New ATHs: What’s Next for Traders?Hello, TradingView warriors! 👋
Have you caught Bitcoin (BTC) smashing through a new all-time high (ATH) this Monday? 🎉 If you blinked, you might’ve missed it! But don’t worry, the crypto king isn’t done with its rollercoaster ride just yet. After soaring to new heights, BTC has pulled back for a retracement—not a full-on reversal, so hold your horses! 🐎 Whales are playing their usual games, setting traps for unsuspecting traders. Don’t fall prey to their tricks! 🦈 Let’s break down the key levels to watch and stay one step ahead. 💡
🔍 Key Levels to Watch on the Chart
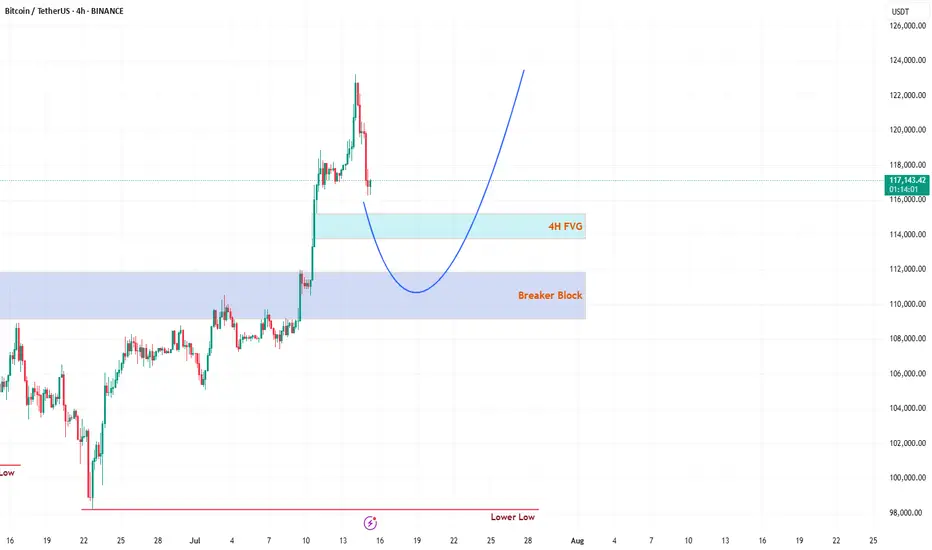
1️⃣ 4H Fair Value Gap (FVG)
This 4H FVG is a thing of beauty—my personal favorite! 😍 But let’s be real, Bitcoin doesn’t care about aesthetics. This FVG is likely to act as the first resistance level. Here’s the plan:
If respected, expect BTC to use this level as a springboard to catapult back toward the ATH. 🚀
If broken, BTC might slide toward the stronger resistance below. Keep your eyes peeled for how price reacts here! 👀
2️⃣ Daily Breaker Block (PD Array)
This is the big one—a rock-solid resistance zone on the daily timeframe. I’m leaning toward BTC dipping into this Breaker Block to clear out liquidity before making its next big move to retest the ATH. 🏦 This level is a magnet for price action, so don’t sleep on it! 😴
🛠️ Trading Strategy: Stay Sharp!
Patience is your best friend right now, traders. 🙏 Don’t rush into trades without confirmation. Watch how BTC interacts with these two levels:
4H FVG: Look for rejection or a breakout to gauge short-term direction.
Daily Breaker Block: If price dips here, it’s likely hunting liquidity before the next leg up.
Wait for clear price action before jumping in—let the market show its hand! 🃏 Stay disciplined, avoid the whale traps, and let’s ride this BTC wave together. 🌊
📚 Want More? Follow Me!
If you’re hungry for more technical analysis insights and market updates, hit that follow button! 📈 I share tips, tricks, and breakdowns to help you navigate the markets like a pro. Let’s level up your trading game together! 💪
What’s your take on BTC’s next move? Drop your thoughts below, and let’s discuss! 💬 Happy trading, and may the profits be with you! 📈
Bitcoin (BTC): Current Neckline Zone is Crucial | Bounce Coming?After a recent push to a new ATH area, the price has cooled down, which led the price back to the local neckline zone, which is our next important zone.
This correction cooled down the Bollinger Bands Channel and RSI, which would mean we are just one MSB (on smaller timeframes) away from another rally towards the upper zones.
Now if for any reason we fall more, then this might turn into a nasty movement, as our target would be then around $110K, where we would be looking for another buy entry (if we fail to get that MSB we are currently looking for).
Swallow Academy


BTC SHORT Price found resistance after exhaustive uptrend to 120K area.
Trend reversal taking place. Looks like more downside for now.


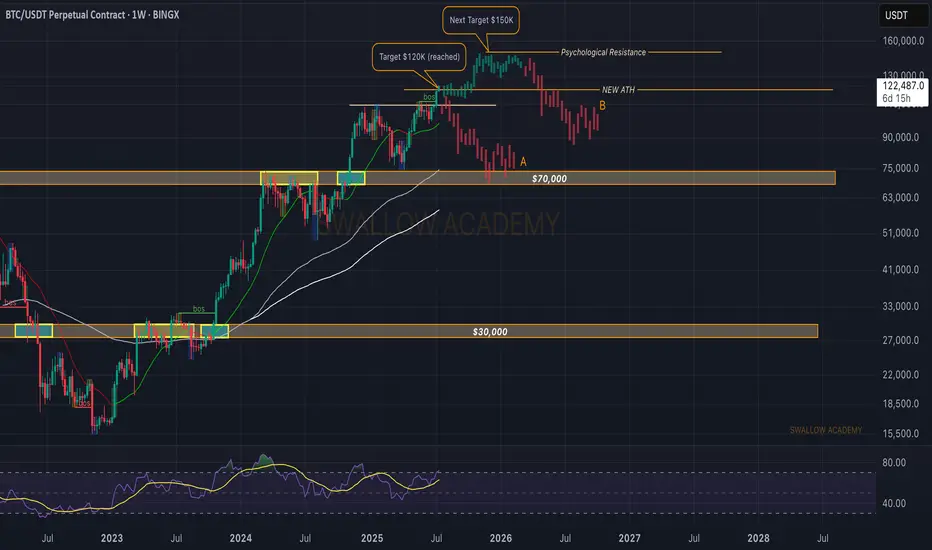
Bitcoin (BTC): Our Target Got Reached, Not Time To Just Watch!Buyers keep on pushing. As a new week starts, we are seeing a strong buy-side dominance and a new ATH to be formed, which broke our major target area of $120K.
Now to give a quick answer, our target is sitting at $140-150K, which we think will be the local top for this bull cycle, and as we recently reached major psychological resistance, we might see some sideways movement from here on, so there are a few things we are going to look for in order to get a potential trade from here.
1) Look for proper BOS (which should give us a good entry for long position)
2) if we see sideways channel, wait out for it to properly form on 30M timeframe, then try to trade inside the channel
3) If we see any kind of MSB (market structure break), we are going to look for a short position, as we might have a quick liquidity hunt there.
Swallow Academy
from 118k $, I expect a correction to the area of 100k$Somewhere from the current levels of 118k $, I expect a correction to the area of 100k$
Where Can Bitcoin Go? Part 9 – Breakout and History in Motion🌋🚀 Where Can Bitcoin Go? Part 9 – Breakout and History in Motion. 🔓💥
The breakout over 114900 has happened.
After 2 rejections, years of preparation, and countless fakeouts… Bitcoin has finally cleared the $114,921 barrier.
We are now officially in price discovery mode within the upper resistance channel.
📍 As long as BTC stays above $114,900 – we are long.
This level is now our trigger line. Lose it? Flip back to short bias. Hold it? There’s only one word: 🚀
🔑 Context:
We’ve tracked this structure since 2023 using a 1-2-3 model based on macro highs. The third test is always the decider — and this time, we broke through.
✅ Test 1: Rejected (2021)
✅ Test 2: Rejected (2025)
✅ Test 3: Breakout confirmed (July 2025)
Now compare that to previous cycles:
2016 halving → ATH in 2017
2020 halving → ATH in 2021
2024 halving → ATH coming by end of 2025?
🧭 Based on this map, BTC’s next structural targets are:
→ $137K
→ $160K
→ $182K+
But there’s a catch: if we fall back below 114,900, the entire breakout thesis is at risk. This is now a binary zone.
⚠️ What to Watch:
📌 Support Retests:
Expect volatility around the 114.9–116K level. This zone will now be stress-tested.
📌 Media Frenzy vs Structure:
As hype increases, stick to levels — not noise.
📌 Ultimate FOMO vs Breakdown:
Hold structure = ATH potential
Lose structure = Down we go, potentially hard.
🎥 Missed the full structural breakdown?
👉 Watch “Where Can Bitcoin Go? Part 8” for the blueprint
👉 This is now Part 9 – The terminal move has begun
We are now playing for cycle maturity – this could be the final leg before topping out in late 2025.
Let’s trade it with clarity, not emotions.
One Love,
The FXPROFESSOR 💙
Disclosure: I am happy to be part of the Trade Nation's Influencer program and receive a monthly fee for using their TradingView charts in my analysis. Awesome broker, where the trader really comes first! 🌟🤝📈
🚨 BITCOIN HAS BROKEN OUT but keep in mind: under 114900 be OUT!

BTC Roadmap Still Intact Bullish Momentum Building Toward 120KBitcoin Price action continues to validate the bullish roadmap shared in our last BTC post. The market respected the Immediate Buy Back Zone, springing from a demand backed structure into a fresh impulsive leg.
Notably, price has carved a clean 5-wave structure supported by recurring bullish pennants and continuation patterns each breakout driving momentum higher. Our target at 120,151 remains firmly intact, with price action showing healthy structure and controlled pullbacks.
The current setup remains valid as long as price holds above 106,655 and especially 100,941, which now act as structural pivot zones. Any deeper correction into the Demand Area would only serve as a re-accumulation window before the next leg.
Let’s see how price behaves into June. Momentum is aligning with structure.
Share your thoughts, like the post, and drop your setup confirmations on the comment section.

$BTC All Eyes on the FVG Zone. CRYPTOCAP:BTC broke out above key resistance and is now retesting the FVG zone near $112K–$115K.
Holding this level could trigger a fresh rally toward $127K–$132K.
DYRO, NFA

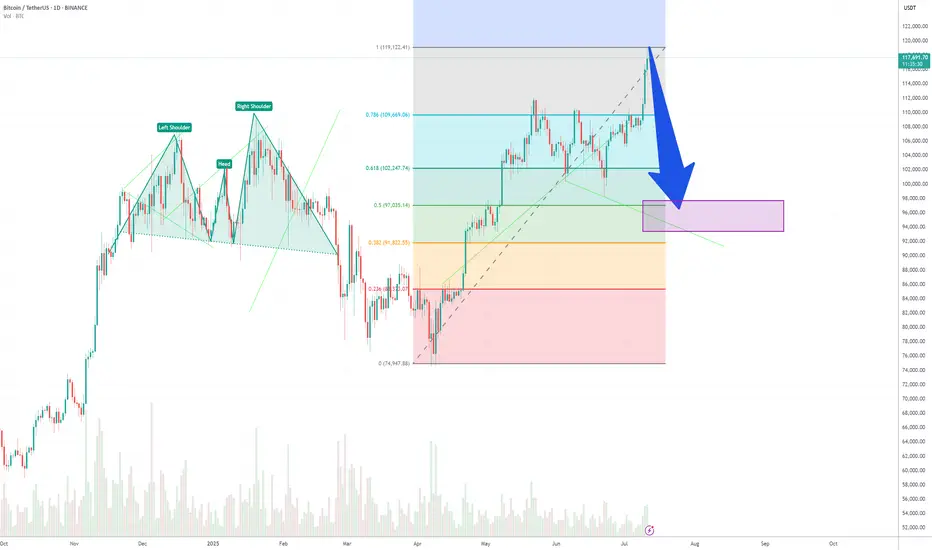
Urgent Bitcoin Prediction: Longs Beware!!! Bitcoin longs should be careful, as we are below an important resistance and the market looks bearish. Wait for the confirmations I’ve shown in the video before making any moves! Trade professionally with a proper strategy and well-defined entry tactics!

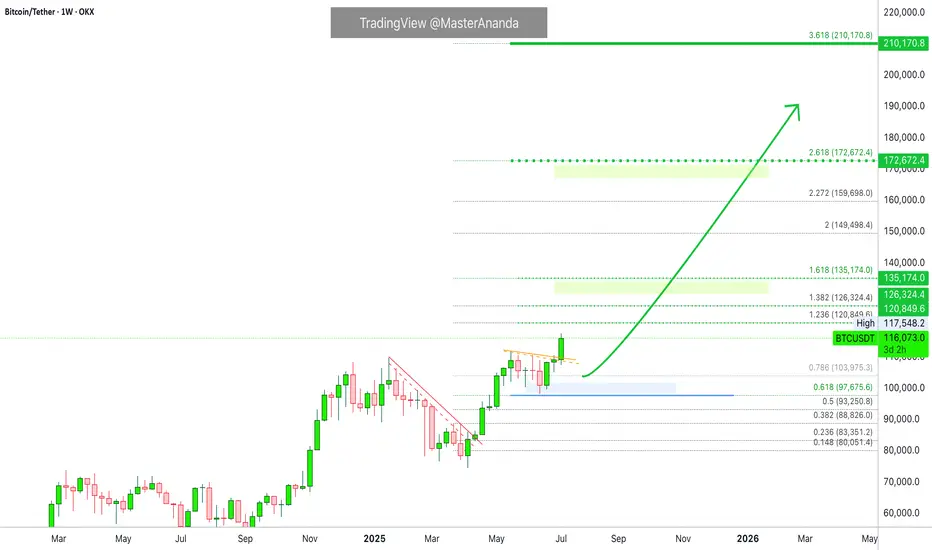
Bitcoin's Next Target Based on a 210 Days Long ConsolidationAfter each 210 days long consolidation phase Bitcoin advanced 137% on average, from bottom to top, since the November 2022 bear market low. Such an advance would put Bitcoin at a price of $170,000 next.
Now, the 137% is just the average. In one occasion Bitcoin rose 83% while in another occasion total growth amounted to more than 200%. We are counting the rise from the consolidation phase lowest point.
Let's look at some numbers:
» An 83% rise would put Bitcoin just above $135,000.
» A 128% rise would put Bitcoin right at $170,000.
» A 202% rise would put Bitcoin at a price of around $225,000.
~200% is how much Bitcoin grew between late 2023 and early 2024.
How much will Bitcoin grow exactly? We don't know. What we can know for sure is that there is plenty of room available for growth.
We are aiming for at least 100% growth starting from 100K, that is, a target of $200,000. Can be $180,000 just as it can be $220,000. That's the cycle top.
Do you agree with this target?
Leave a comment with your number.
Thank you for reading.
Namaste.
BTC: Demand Zone + QML + Trendline Flip = Perfect SETUPHello guys!
BTC is showing signs of a potential bullish reversal, forming a Quasimodo Level (QML) setup inside a valid S&D zone that remains unbroken despite multiple tests.
The downward trendline has been broken and is now acting as support, aligning perfectly with the QML and demand zone. giving us a solid confluence area.
Important to watch:
Rejection wicks and volume building at $106.6K–$107.4K zone show strong buyer interest.
If price can reclaim $109K and consolidate above, we could see a move toward $112K and higher.
Invalidation below $106.4K suggests the demand has failed, and bears may regain control.

BTC/USDT – Weekly Outlook & Reflection (15m, Ichimoku) by RiscorA new trading week begins after an exceptionally strong bullish close last week. Given the strength of that rally — and seeing how long/short ratios are now heavily skewed to the long side — I expect this week to open with a pullback.
To me, the bullish impulse feels exhausted, so I’m watching for a short-term retracement. My initial target is a move toward 117,500, but if the correction accelerates, we could even see a deeper dip, possibly down to the 113,000 area.
That said, the uptrend is still strong — any shorts here are high-risk, countertrend trades. I’ll treat all short setups as tactical reversals only, not as a full trend change. Caution is key in this environment!
Let’s see how the structure develops as the week unfolds.

BTC/USDT, 1H chart, Futures - Bearish projection.the price looking for high areas without time in the SQZ minitor or strength, I hope that during the morning today it will fall and begin its journey to low areas between $115,500 and $114,500.

$BTC - Much Higher or Much Lower. EoY '26I'm not gonna lie, I drew these lines with my balls. I use them to move my cursor on my computer monitor.
This is not financial advice. This is just how my deep gut instinct likes to draw brushstrokes.
I gave 4 optional trajectories.
These will likely not happen, nor is it likely that the Price Action and Valuation will stay within these lines.
Enjoy and Happy Trading!
Mr. Storm

Idea that BTC will retrace before bullish continuationI might be wrong tonight, i see some clowns (cme gaps, fibs, OB) lurking need to be eliminated soon, i wish i'm wrong this idea, going to retrace at 113 before bullish continuation. Anyway DYOR and stay safe!

Bitcoin (BTC): Smaller Correction Means Nothing | BullishBitcoin still looks strong;we had a smaller correction recently, but buy-side volume still shows signs of dominance.
Accumulation is on, so we might have a very volatile movement very soon; be careful!
Swallow Academy

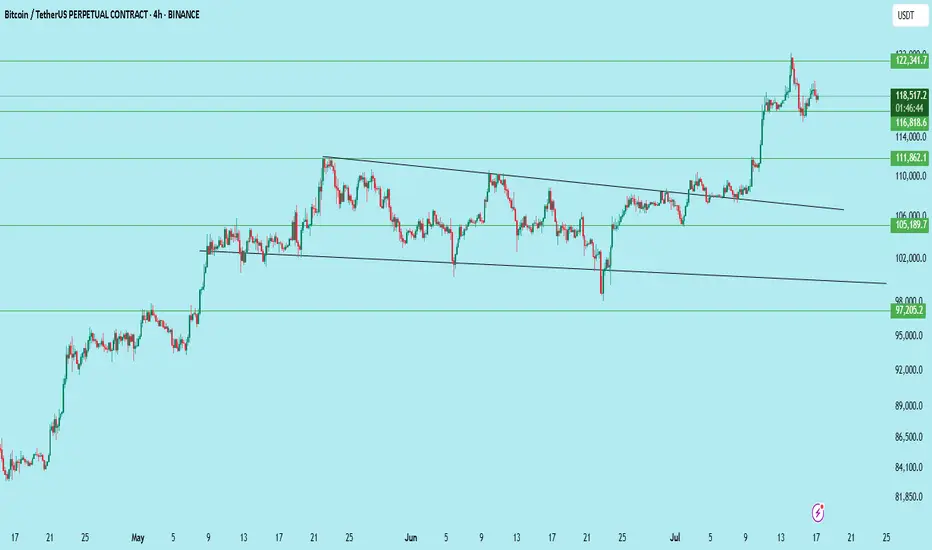
#BTCUSDT | Massive Breakout – Now What?Bitcoin has broken out of a multi-week descending wedge on the 4H chart — a classic bullish reversal pattern. Price is now consolidating just above $116,818 support, forming a base for the next leg up.
What Just Happened:
Clean breakout above the wedge resistance
Strong momentum candle above $111,862
Immediate rejection near $122,341
Currently retesting the previous breakout zone
Key Levels:
Resistance: $122,341
Support: $116,818 → key short-term level
Breakout Support: $111,862
Deeper Support: $105,189
Invalidation Level: $97,205
Bullish Outlook:
If BTC holds $116,818 and breaks above $122,341 with volume, the next leg could extend toward $128,000–$132,000.
Bearish Risk:
Losing $116,818 with volume → look for retest near $111,862 or even $105,189 for a stronger bounce.
Bias:
Bullish above $116,818 — watching for consolidation before continuation.
Trade Setup (if planning to enter):
Entry on retest of $116,818–$117,000
SL: Below $114,000
TP1: $122,341
TP2: $128,000
TP3: $132,000
DYOR | Not Financial Advice

Bitcoin - Last move down, ready for ATH?Bitcoin is showing clear signs of a corrective move within a broader bullish structure. After forming a second consecutive lower high, price is now pressing downward, creating space for a potential liquidity grab and discount entry. Despite this short-term weakness, the macro narrative remains intact. The all-time high remains untapped above, holding a thick layer of liquidity that the market has yet to collect.
Liquidity and Fib Confluence
There is a visible equal low structure around the 107.8k area. This is a prime zone for a sweep, where smart money is likely to trigger sell stops before reversing. Below that lies a Fair Value Gap (FVG) extending into the 106.5k range. Within this same zone, we also have strong Fibonacci confluence, especially at the 0.786 level near 106.2k. This makes it a high-probability entry area if price delivers a clean displacement after the sweep.
Short-Term Bearish, Long-Term Bullish
The market is respecting a trendline drawn across the lower highs, giving the impression of sustained bearish control. However, this is likely a trap. Once the sell-side liquidity below the 107.8k low is taken and the imbalance around 106.5k is filled, price will be primed for a reversal. The true target lies much higher, with the all-time high around 110.5k as the main magnet.
FVG Fill and Reversal Mechanics
This entire drop is likely engineered to fill inefficiencies left behind earlier in the move up. The FVG acts not only as a magnet, but also a springboard for the next leg. Expecting price to show a reaction at the 0.786 level, where the order flow could shift and confirm a bullish reversal, is key here. Ideally, we see a clean sweep, a displacement, and a reclaim of previous structure before targeting higher levels.
Projection and Trade Setup
The anticipated sequence is a sweep of 107.8k, fill of the gap and fib zone down to 106.2k, then a potential reversal structure forming. If that structure confirms, the next major move should aim for the untouched all-time highs, where significant liquidity remains resting. Traders should remain patient and let the sweep and confirmation unfold before entering.
Conclusion
We are watching a classic setup where engineered downside movement is likely to create the conditions for a powerful reversal. As long as price respects the 106k zone and gives a strong reaction, the path toward the ATH remains wide open.
___________________________________
Thanks for your support!
If you found this idea helpful or learned something new, drop a like 👍 and leave a comment, I’d love to hear your thoughts! 🚀
