[SeoVereign] BITCOIN Bearish Outlook – July 9, 2025We are the SeoVereign Trading Team.
With sharp insight and precise analysis, we regularly share trading ideas on Bitcoin and other major assets—always guided by structure, sentiment, and momentum.
🔔 Follow us to never miss a market update.
🚀 Boosts provide strong motivation and drive to the SeoVereign team.
--------------------------------------------------------------------------------------------------------
Hello.
This is SeoVereign.
As of July 9, 2025, I present a bullish outlook on Bitcoin.
This idea is an extension of the analysis posted on July 6.
Therefore, it will be easier to understand this analysis if you first read the July 6 idea.
The position reached the second target price and then showed a downward movement.
In this idea, harmonic 0.382 and 1.618 patterns have been additionally identified, and accordingly, I plan to continue holding the long position entered from the July 6 entry point.
The average target price has been set around 109,150 KRW.
I will continue to track the situation, clarify the rationale, and provide updates through this post.
Wishing you continued good fortune.
Sincerely,
SeoVereign
BTCUSDT.P trade ideas

War news are actually good news for Crypto & GoldI Love Global Peace and hope all Wars end soon.
Here are my thoughts about Crypto when war Starts between two countries or more.
i think After wars so many reasons will help Crypto to see gain specially for Bitcoin which is the King of this market.
Some of the major Reasons in my view are:
A. Countries currency or Markets start to fall :
Usually with starting of war, we have two countries that are involved and due to negative effects of war on different Economic parameters cause weaker country or both currencies lose the power of Their currencies and it start To dump.
weak countries Bank can get hacked or worst scenario a countries currency can get 0 by the time.
most of the times Their stock markets also Face with huge losses.
B. People start to Buy more Gold or Bitcoin and ...
with things mentioned above and other reasons their People start to Buy more Crypto usually and Metals like Gold.
C. People start to migrate to other countries with their Crypto Wallets Only
Some start to leave their countries and Sell their Cars homes and ... and turn them to BTC or... and transfer their money and life to a peaceful country.
D. Spies and bribery gets more in those countries which all is done with Crypto usually
Corruption & Spy jobs and ... increases in those countries usually and the money on this Fields usually transfer Via Crypto or Gold and Silver which is harder to track.
And with these reasons which mentioned Above usually in the past all the Attention comes to Metal like Gold and the Value of it increase in Wars, but now Days Bitcoin(&Crypto Tokens) also gets more value and attention in war in my personal View and See gain in price too.
DISCLAIMER: ((trade based on your own decision))
<<press like👍 if you enjoy💚

Bitcoin ATHBINANCE:BTCUSDT This is amazing for crypto community because this level-up all of lover crypto currencies.
Next target: 120.000K
Best for pollback levels: 111.000K & 105.500K
👓We are this time keep calms emotional in buy or sell.

Volatility period likely to continue until July 11th
Hello, traders.
Please "Follow" to get the latest information quickly.
Have a nice day today.
-------------------------------------
This volatility period is expected to last until July 11th.
The first volatility period, July 1-7, 3 days passed, and the second volatility period began on July 6.
It is important to explain it in words, but I think it would be better if you could intuitively understand the flow by looking at the chart.
For that reason, I divided the chart into a chart with a trend line drawn and a chart with indicators.
Since the trend line is used as a tool to calculate the volatility period, it is not necessary to show it after the volatility period is displayed.
What we need to look at is the support and resistance points drawn on the 1M, 1W, and 1D charts after the calculated volatility period, or the support in the indicator to find the trading point.
-
It seems that support is being checked around 108316.90, which is the HA-High indicator point of the 1D chart.
Therefore, we need to see if it can rise after receiving support near 108316.90 during this volatility period.
If not, it will eventually show a downward trend.
As a basic trading strategy, we use buying near the HA-Low indicator and selling near the HA-High indicator.
Therefore, considering the current price position, it can be said that it is a section where we should sell to make a profit.
However, since the HA-Low and HA-High indicators are intermediate values, if it falls from the HA-Low indicator, it is possible to show a stepwise downward trend, and if it rises from the HA-High indicator, it is possible to show a stepwise upward trend.
Therefore, we need to respond with a split transaction.
Conditions for continuing the uptrend include:
1. When OBV is above the High Line and shows an upward trend,
2. When PVT-MACD oscillator is above the High Line,
3. When StochRSI is above K > D, showing an upward trend,
If the above conditions are met, there is a high possibility that the uptrend will continue.
-
If it falls below the M-Signal indicator on the 1D chart, it is highly likely that it will select the trend again when it meets the M-Signal indicator on the 1W chart.
At this time, whether there is support near 99705.62 is important.
If it rises, you should check whether it is supported near 111696.21.
If it is not supported, it means that it has not broken through the high point section, so you should prepare for a decline.
The high point boundary section is the 108316.90-111696.21 section.
Therefore, if the price is maintained within this section, there is a possibility that it will continue to attempt to break through upward.
-
Thank you for reading to the end.
I hope you have a successful trade.
--------------------------------------------------
- Here is an explanation of the big picture.
(3-year bull market, 1-year bear market pattern)
I will explain more details when the bear market starts.
------------------------------------------------------

BTC - Can it reach 100k?FOR SUREEEEE it can! Just let it close above 120k for it to form in a formed manner or way

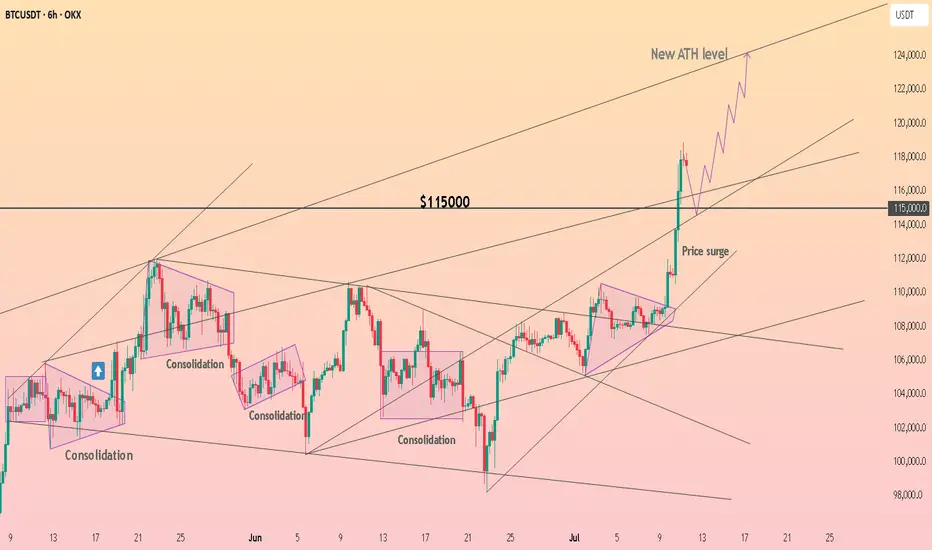
HolderStat┆BTCUSD above the $115kOKX:BTCUSDT broke out of its consolidation structure and surged past $115,000 resistance. The price is showing parabolic behavior as it targets the ATH level near $125,000. Structure remains bullish as long as the support base near $113,000 holds.
Bitcoin Trading Update:From the current market position at 102,663.96, Bitcoin is poised within a key price range. As per your outlined strategy, you're targeting a potential 4.71% drop to the mitigation block at 97,911. This level serves as a critical zone for price action, which could offer an opportunity for a potential reversal or continuation.
Key Levels:
Dealing Range High: 117,900
Mitigation Block: 97,911
Current Price: 102,663.96
Potential Drop: 4.71% to the mitigation block
Price Target (TP):
From the mitigation block at 97,911, the target suggests a 20% potential gain as the price moves toward the upper boundary of the dealing range at 117,900.
Key Observations:
Risk/Reward Ratio: The setup shows a favorable Risk/Reward ratio of 4.75, which aligns with a solid risk management strategy, especially considering the potential for a 20% gain from the mitigation block to the dealing range high.
Stop Loss: The stop loss is set around 93,456.00 as per the chart, ensuring proper risk management in case the market moves against the expected setup.
Suggested Strategy:
Entry: Watch for price action near the mitigation block (97,911) for a potential entry.
Take Profit: Aim for the 117,900 level, targeting a 20% gain.
Stop Loss: Keep stop loss orders at 94,960 to protect against larger downside movement.
This setup offers an attractive risk/reward proposition, but always ensure you are actively managing the trade, especially if price approaches the mitigation block.

Bitcoin to revisit $100k | Summer price target = $120kGeopolitical tension is causing fear in the markets. Today, Bitcoin fell from $107.7k to current price $105k with no sign of buyer support whatsoever, printing 11 consecutive H1 red candles intraday. Like a hot knife through butter.
At $105k, there is very little support. Sell volume absolutely overshadowed the tiny buy volume. Bulls have yet to close a green candle. I believe in the next few hours Bitcoin will be trading at $104k, followed by the first stop $102k.
$102k can serve as an entry point, depending on how price reacts. $100k is the optimal entry point for maximum profit, after mass liquidations. Retail traders are confident that the liquidity hunt is over after the initial tap, placing stops and liquidation levels at $100k.
Invalidation level will be beyond the 200SMA. The 200SMA have historically proven itself time and time again as a safe zone during rallies after golden crosses.

BTC - Falling Correction = Continuation?BTC has been playing by the rules lately!
Every time Bitcoin forms a falling correction, it turns out to be a bullish continuation pattern — and history might be repeating itself 👀
As shown on the chart:
Previous falling channels (flag/wedge structures) have consistently led to strong bullish impulses.
The current correction also appears to be a falling channel, hinting at another potential bullish leg soon.
As long as the structure holds and no major support is broken, the next target could be a new all-time high.
Let’s see if BTC continues to respect this textbook behavior.
📌 Remember: Falling corrections in an uptrend = healthy continuation!
📚 Always follow your trading plan regarding entry, risk management, and trade management.
Good luck!
All Strategies Are Good; If Managed Properly!
~Rich

BITCOIN WE shared for free the strcuture of bitcoin and it came back 100% complete. On break and retest and 116k is target and 126-128k will be watched.
trading is probability and any key level can fail.

BTC , 4hr , BearishBTC is Forming a Pattern and it is at the top of the Another Pattern and It is facing rejection 3 Times from Above and now it is forming another pattern inside and Ready for Break Down of the Pattern , if it breaks the Pattern Down then it will be bearish almost 90% it will move to down side , if it has not given Breakdown and moving inside the small pattern then wait patiently and observe carefully .
Then it may also give Breakout for up side .
Follow Risk Management Properly
Follow for More Swing Ideas Like this .

BTCUSDTPreferably suitable for scalping and accurate as long as you watch carefully the price action with the drawn areas.
With your likes and comments, you give me enough energy to provide the best analysis on an ongoing basis.
And if you needed any analysis that was not on the page, you can ask me with a comment or a personal message.
Enjoy Trading ;)
Don't take a short position BTCUSDT"Don't take a short position, but be prepared for a temporary drop before the market goes back to ranging. Right now, we're in one of the most exciting moments in the BTC market. "

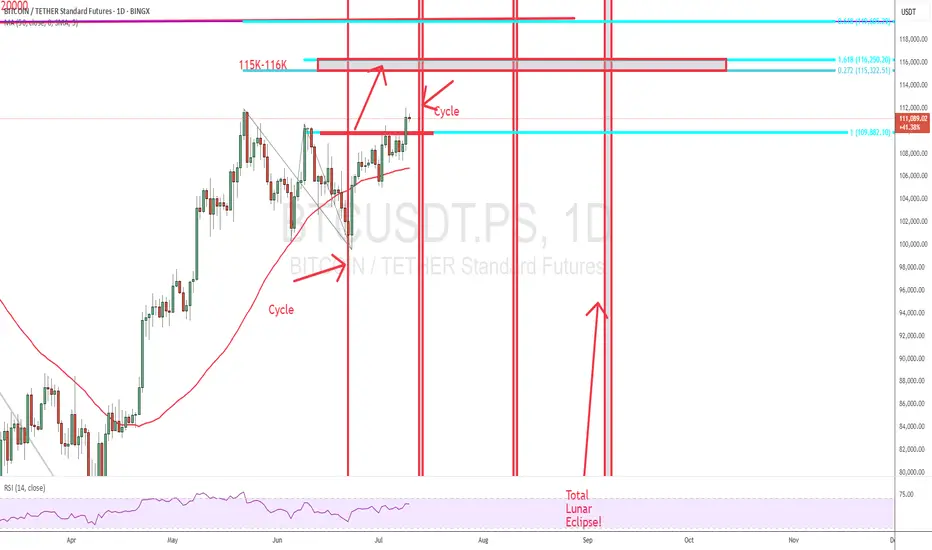
Bitcoin (BTCUSDT) Potential Move from $43,600 to $120,000Description:
Based on the current weekly chart analysis for Bitcoin / Tether Standard Futures (BTCUSDT), there is a significant potential for Bitcoin to move from $43,600 to $120,000. Below are the key points observed:
Current Price: Bitcoin is currently trading at approximately $54,806.45, down by 5.75%.
Elliott Wave Analysis:
The chart indicates a potential ABC correction pattern.
Wave A has completed, and Bitcoin is currently in Wave B, which suggests an upcoming bullish Wave C.
Support and Resistance Levels:
The primary support level is at $39,987.31.
The significant resistance level and target is the area around $120,000.
Fibonacci Retracement Levels:
38.2% Retracement: $31,145.00
50.0% Retracement: $23,356.00
61.8% Retracement: $15,568.00
Indicators:
RSI shows potential bullish divergence indicating a possible upward move.
Volume profile indicates strong accumulation in the lower price ranges.
Extrem Buy Alert: The chart highlights an "EXTREM BUY ALERT," suggesting that the current levels could be a significant buying opportunity before the expected upward move.
Chart Details:
Timeframe: Weekly (1W)
Ticker: BTCUSDT.PS
Exchange: Binance
Disclaimer: This analysis is based on historical data and technical indicators. It is not financial advice. Please conduct your own research before making any trading decisions.

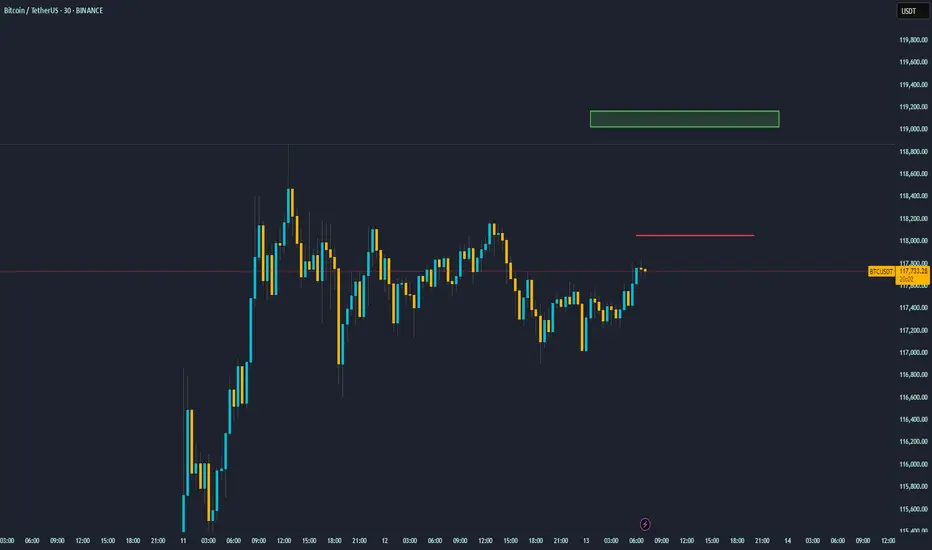
Bitcoin at a Crossroads: Key Levels to WatchThis 30-minute chart for Bitcoin (BTC/USDT) shows the price consolidating within a range after a strong upward rally. The key levels drawn on the chart outline a potential trading plan for the next short-term move.
Asset: Bitcoin / TetherUS (BTC/USDT)
Timeframe: 30-Minute (Short-term outlook)
Current Situation: After a significant price surge on July 11th, Bitcoin has entered a sideways consolidation phase. The price is currently making a move towards the top of this range, approaching a critical resistance level.
Key Levels Explained
Immediate Resistance (~$118,000): The red horizontal line marks the immediate resistance. This is a crucial level that has previously rejected the price. For the current upward momentum to continue, Bitcoin must decisively break and hold above this price ceiling.
Primary Target / Supply Zone (~$118,900 - $119,100): The green box above represents the next major resistance area or "supply zone." This is the logical target for bulls if they can successfully break through the immediate $118,000 resistance.
Potential Scenarios
Bullish Scenario: If Bitcoin breaks through the $118,000 red line with strong volume, it would signal a potential continuation of the uptrend. Traders would then look towards the green box around $119,000 as the next take-profit area.
Bearish Scenario: If Bitcoin fails to break the $118,000 resistance and gets rejected, it is likely to fall back towards the lower end of its current range. The recent lows around $117,000 - $117,200 would act as the first line of support.
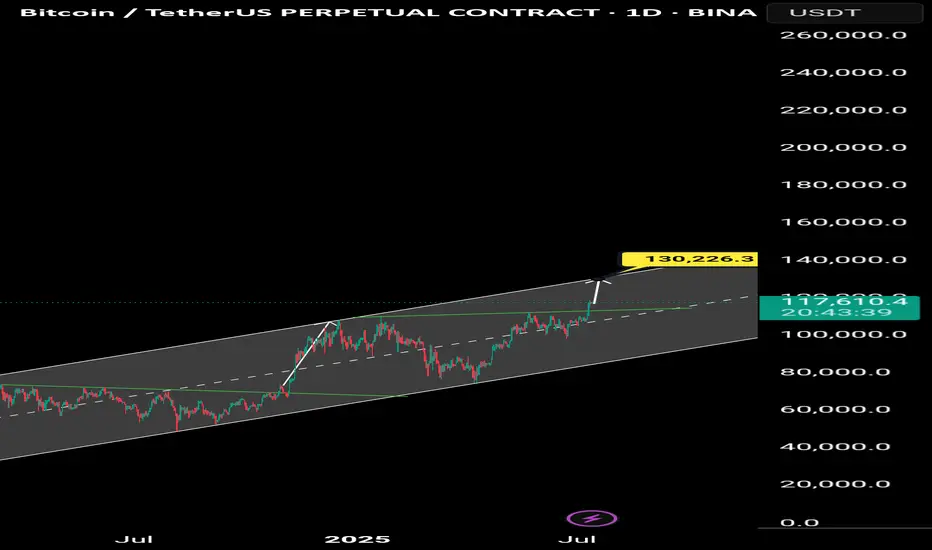
Bitcoin Go 130kBitcoin is heading towards 130,000 tomorrow
The alt season has begun and the market is sharply bullish.
I see that you are in profit, but your voice is not heard.Hello friends...
I see that you are in profit, but you are not making any sound.
As we mentioned in previous analyses, the upward trend has started, now the scenario ahead must be considered.
Like previous analyses, I still consider the area of $134,000 to $137,000 to save profit in this upward trend.
After the price of Bitcoin reaches the said area, you can save profit or think about selling Bitcoin.
But Bitcoin targets are higher than this desired number, but for some reasons (such as US tariffs and war), we cannot give high targets. In future analyses, I will say what our team thinks is the ceiling of this Bitcoin upward cycle.
So follow the page so that you don't miss the analyses.

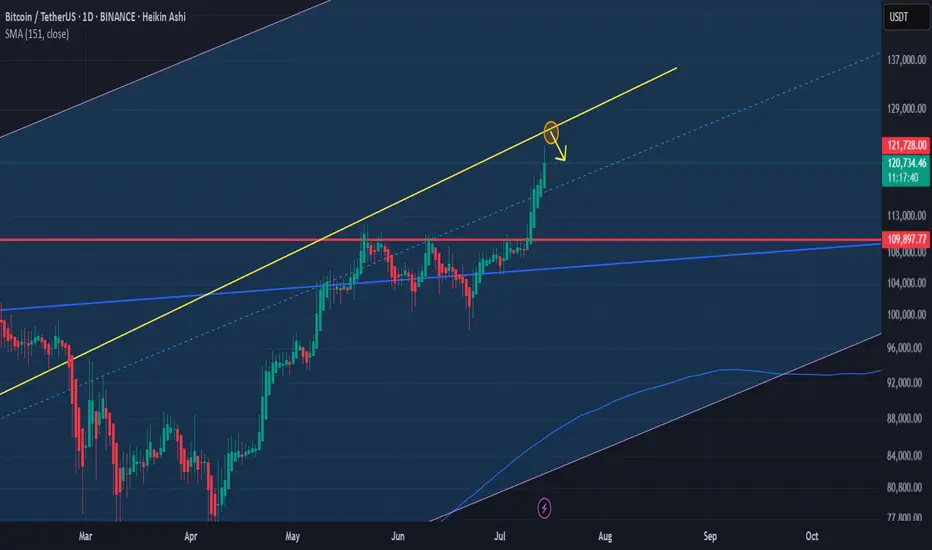
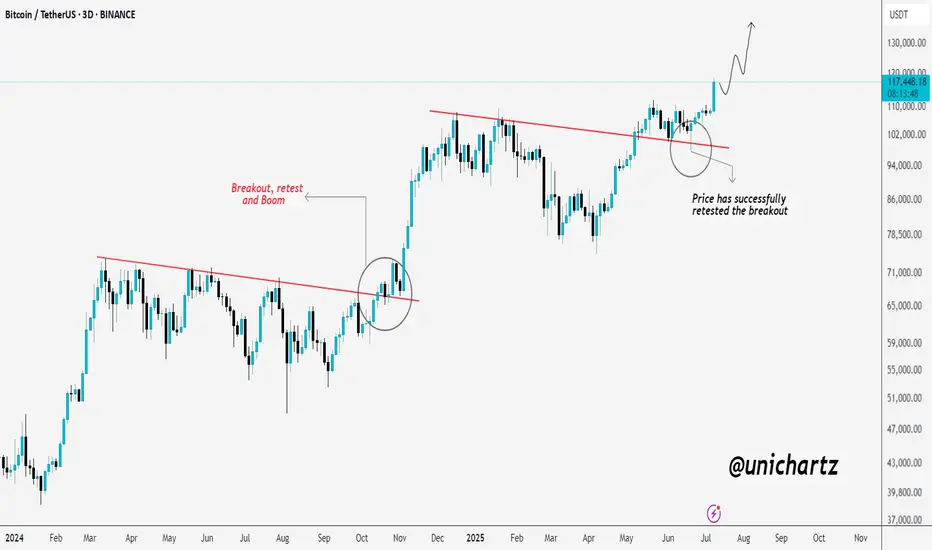
Bitcoin Looks Ready for LiftoffBitcoin is showing a textbook bullish continuation.
After breaking out of a long-term downtrend line, CRYPTOCAP:BTC came back for a clean retest — just like it did during the last breakout phase. That previous breakout led to a massive rally, and now we're seeing a very similar setup again.
The retest around $94K held perfectly, confirming strong demand and validating the breakout. Since then, price has pushed higher with momentum, now trading above $117K.
If this pattern continues to play out like before, Bitcoin could be eyeing $130K and beyond in the coming weeks.
The structure is strong, the trend is intact, and bulls are clearly in control.
BTCUSDT - going to 113866.19$My analysis is based on numerology, all the numbers you see on the chart are from the same place. There is a certain numerological symbolism, which tells me that the price has already put the bottom 49(13) and will make a reversal from the zone 52260+- and then will fly strongly upwards with the target first 89k bucks, and after 113k. It's time to look for a good entry point.

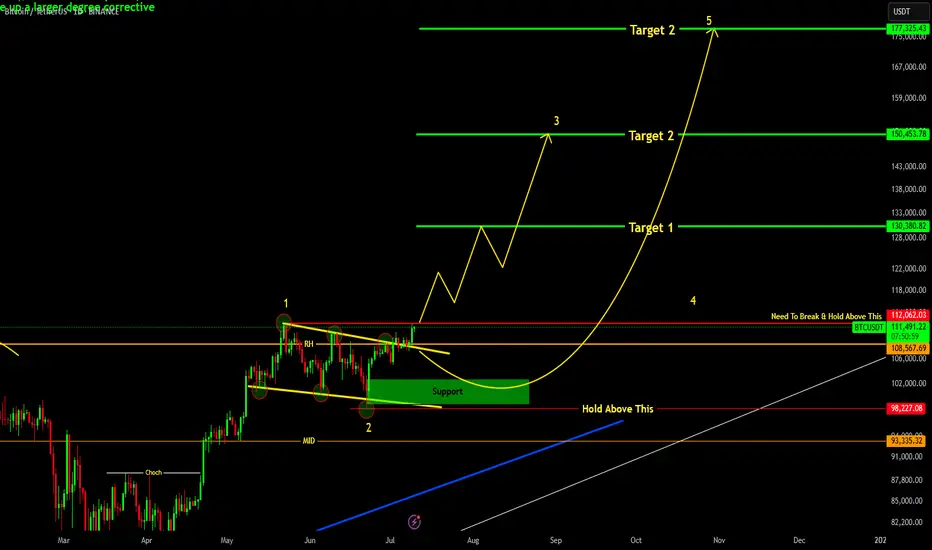
ARE YOU READY FOR 150K+ BTC RALLY !!!BTC has successfully broken out it's bull flag resistance and currently testing above it.
Major resistance resides above is 112K level , if we successfully break and hold above it then easy targets would be 130-150k levels.
Elliott Wave Count final targets 180k level.
If we goes below 106k level then we may see BTC getting into support region of 102-100K region.
For all of this, BTC should remain above 98K level.
btc/usdtI think it's time for Bitcoin to grow. It doesn't matter what the news is. This time, Bitcoin and Tether's dominance have reached their peak and are ready to make Bitcoin grow. This is my analysis. What do you think?
