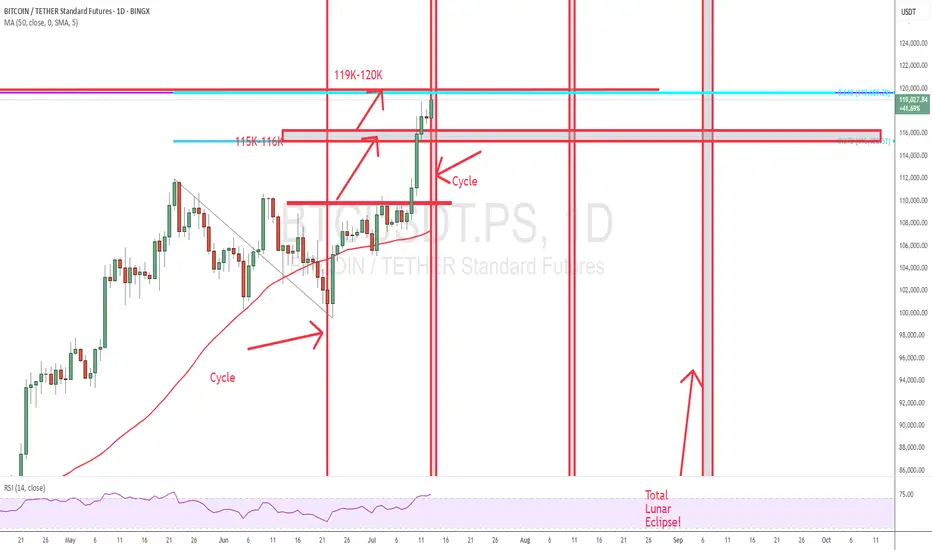
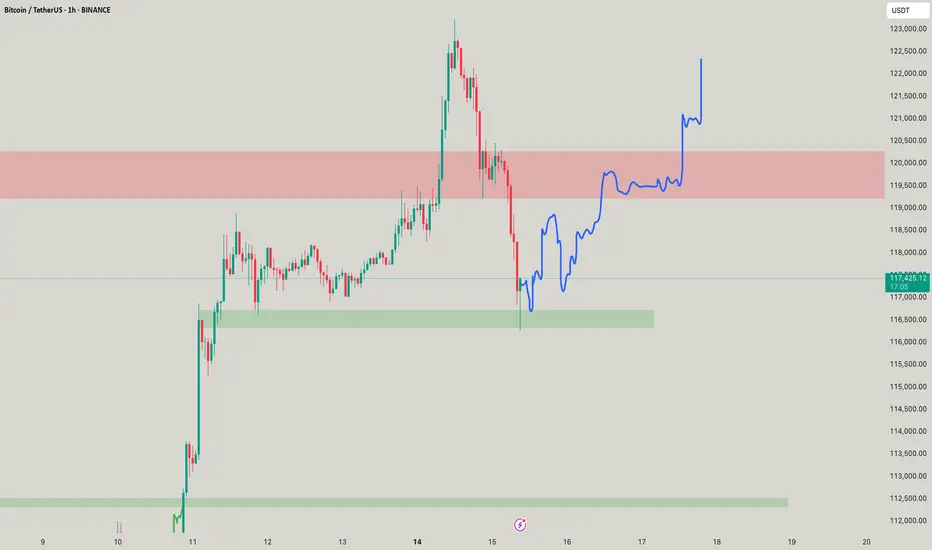
BTC updateFinally, BTC got to my price.
It came exactly to the price and Time (Cycle). Let's see if we clear that.
Good Luck
BTCUSDT.P trade ideas
BTC 4 HR TIME FRAME ANALYSIS 4H Technical Analysis – BTCUSDT.P (Bitcoin Perpetual on Bitget)
✅ 1. Trend Overview:
Current Market Phase: Strong uptrend.
Price has broken multiple H4 BOS (Break of Structure) levels with strong bullish momentum.
The last impulse candle shows a vertical breakout, often a sign of aggressive buyers or FOMO.
🔄 2. Key Structure Zones:
🔵 Demand Zones (Highlighted in Green):
Around 113,700–114,000 → fresh demand zone after last breakout.
Around 108,000–110,000 → mid-level zone from earlier accumulation.
Deeper zone at ~96,000–98,000 → higher timeframe demand (may hold if larger correction happens).
🔴 Supply Zones (No immediate supply shown, but...)
Watch for reaction zones around 118,000–120,000 as psychological resistance.
📍 3. Price Action & Structure:
The current move is parabolic, indicating momentum exhaustion may soon follow.
However, the last CHoCH and BOS signals are clearly bullish, and pullbacks are being aggressively bought.
Short-Term Expectation:
A correction or sideways consolidation may happen near 118,000–119,000.
Best scenario: price pulls back into the 113,700 zone, forming a bullish continuation setup.
🔍 4. Candlestick Patterns:
At the top, the last 2 candles are showing wicks, indicating possible early rejection or take-profit activity.
No confirmed reversal pattern yet (e.g., no bearish engulfing, pin bar, or evening star).
Wait for confirmation if considering a reversal trade.
📉 5. Risk Zones:
If price breaks below 113,700, then correction may deepen toward 110,000 or even 108,000.
Below 108,000 would invalidate the current short-term bullish structure and signal trend weakening.
📌 6. Key Levels to Watch:
Type Price Zone Notes
Resistance 118,500–120,000 Current high zone, psychological barrier
Demand Zone 1 113,700–114,000 Nearest fresh demand
Demand Zone 2 108,000–110,000 Mid support
HTF Demand ~96,000–98,000 Deep liquidity + structural demand
✅ Conclusion:
Market is in a strong bullish trend on the 4H chart.
Wait for a healthy pullback to demand zones before considering new longs.
Watch for bearish candlestick confirmation (like engulfing or M-structure) near highs for possible short-term reversals.
⚠️ Disclaimer:
This is not financial advice or a trading signal.
It's purely educational analysis.
Always trade based on your personal strategy and risk management. BITGET:BTCUSDT.P

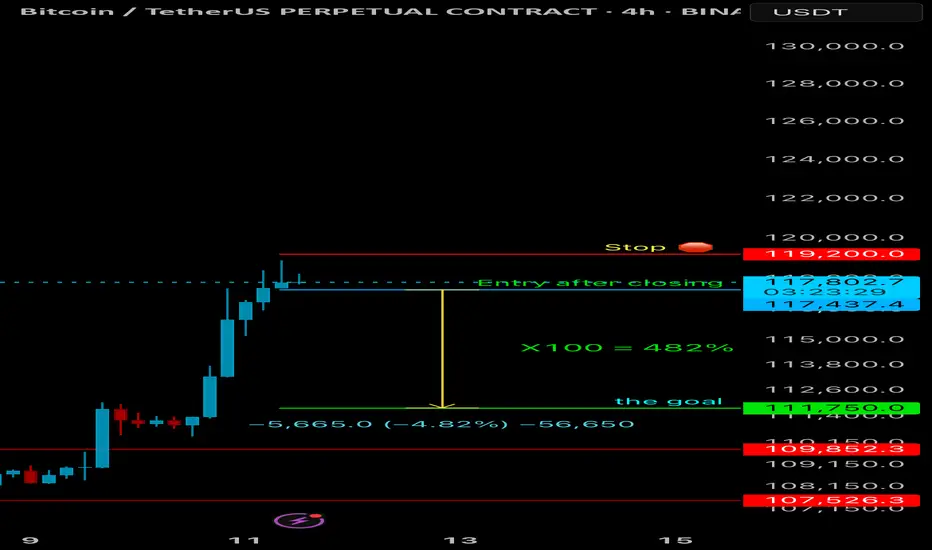
BTCQuick trade. I hope everyone manages their risk and enters after the close. 4-hour time frame. Leverage from 10 to 100.
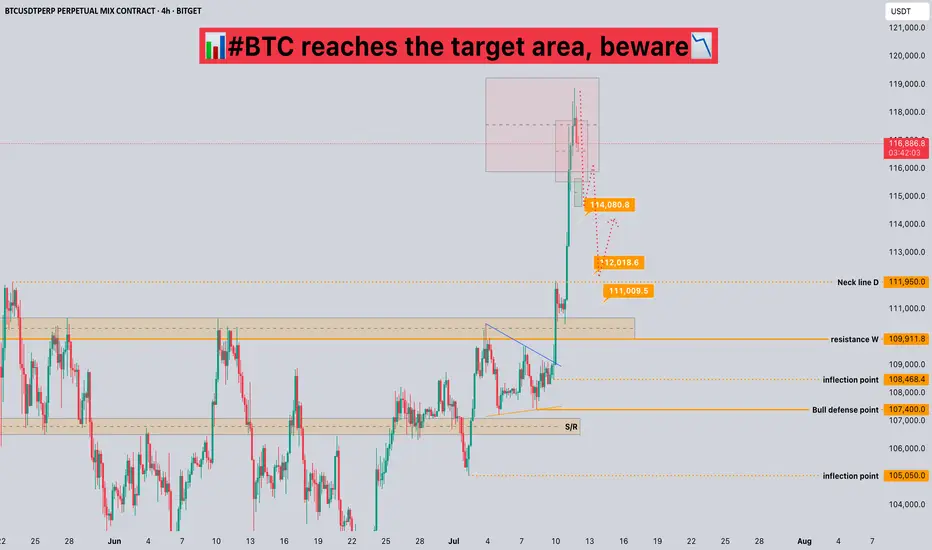
#BTC reaches the target area, beware📊#BTC reaches the target area, beware📉
🧠From a structural point of view, we have reached the target area of the bullish structure, so we need to be alert to the risk of callbacks and do not chase the rise in the target area!
➡️From a graphical point of view, the appearance of the ascending triangle means that the daily level of the upward trend is about to come to an end, so we need to be alert to the correction of the daily level. However, it is worth noting that the bullish trend at the weekly and monthly levels is still intact.
➡️Therefore, if we want to participate in long transactions, we must wait for the callback to occur. The aggressive support level is around 114000, and the stable support area is 110000-112000.
⚠️No matter how the market develops, it is reasonable, so please do a good job of risk management, keep yourself alive first, and then seek profits!
🤜If you like my analysis, please like 💖 and share 💬
BITGET:BTCUSDT.P
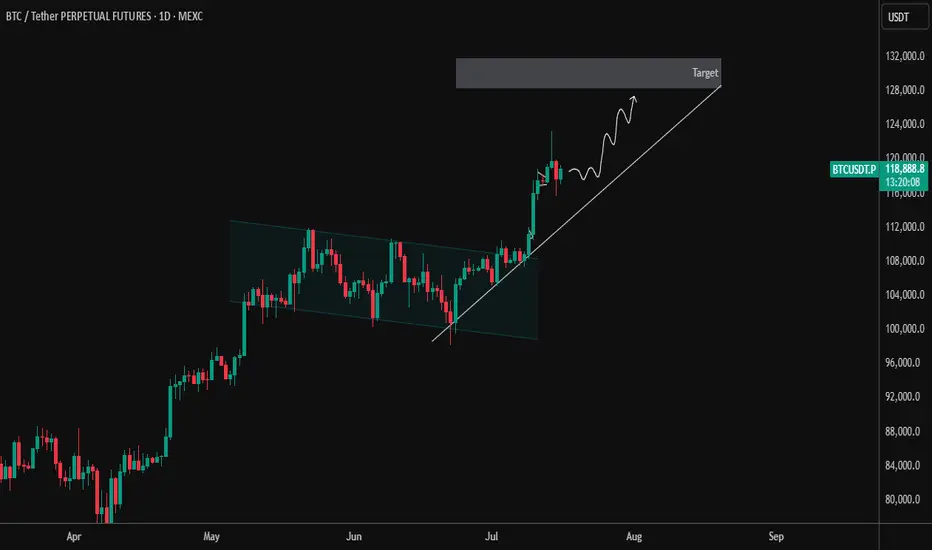
BITCOIN =140-150kThe X-wave has formed in the form of a neutral triangle pattern, and eventually Bitcoin could once again touch $106,000 and move towards $140,000-150,000 with the completion of wave-e.
Good luck
NEoWave Chart

Bitcoin ATHBINANCE:BTCUSDT This is amazing for crypto community because this level-up all of lover crypto currencies.
Next target: 120.000K
Best for pollback levels: 111.000K & 105.500K
👓We are this time keep calms emotional in buy or sell.


BTC is sitting on a volcanoStrong resistance at 110k and things couldn't get hotter for BTC esp. with the President pumping it and profiting from all of this (ethics 101). Let's recap: yields going up, economy is cooling (S&P going up for a week is not a reflection of things getting better), high interest rates, ultra high historical multiples, tariffs and higher debt, which are inflationary are all in front of us. This is not sustainable, a correction will happen very soon and people could get wiped out.
Always do your own due diligence and best of luck! Profit takers and crypto bros will start selling real soon, just like every other time before.

BITCOIN → Market manipulation. Chance for growth to 110KBINANCE:BTCUSDT , as part of a correction triggered by negative news from the US regarding tariffs, is testing liquidity in the support zone. There is a chance of recovery to 110K.
Bitcoin is reacting with a decline to fundamentally negative data on tariffs from Trump. Technically, the price is facing support and forming a false breakdown, the purpose of which was to capture liquidity. This could lead to a recovery within consolidation in an uptrend, but again, there are conditions...
Countries that have received notification of tariffs are responding positively to cooperation (if this trend continues, Bitcoin could receive a local bullish driver).
The market perceives this as positive, and after liquidity is captured, the price could recover to the resistance of the trading range.
Resistance levels: 108230, 109690
Support levels: 107500, 106500
Bulls are trying to hold the local interim bottom at 107500. There is a reaction to the false breakdown of support. The focus is on 108230; if the market can break through this level, we will have a chance to grow to 110K.
Best regards, R. Linda!

Good moment for try to Buy BTCGood moment for try to Buy BTC. A good triangle has formed. There are prerequisites for its upward breakout. Very good risk/reward ratio. Stop below the triangle. Let's see...
$BTC CRYPTOCAP:BTC 💰
CRYPTOCAP:BTC Update 💰
If we look at the current situation, there's a potential for a correction first...
I think reaching the demand area around $116K would be really solid, bro...

Bitcoin - Bull Trap! Don't get caught (Buy at 102,909 USD)Bitcoin has been pumping last week, but the problem is that the bulls made a false breakout above the bullish flag / descending channel. We see that the price went above the channel but failed to continue in the uptrend. This is called a false breakout of a pattern or a bull trap. Usually what happens next is that the price goes in the opposite direction!
That's a pretty bearish case because the bulls are now trapped in their long position, and we all know that the whales need liquidity (orders and stop losses). That's why they will be ready to push the price to the downside, potentially to the 0.618 Fibonacci retracement of the previous impulse wave.
From the Elliott Wave perspective, this is a bullish setup, but we have just finished an impulse wave (1), so we should wait for an ABC correction (wave (2)) to form before entering a long position. I expect Bitcoin to hit 102,909 USD in the short term because there is the 0.618 FIBO. Also, we have an unfilled FVG between 102k - 104k on the daily chart. Usually these kinds of gaps tend to be filled sooner rather than later; that's why I expect a pullback.
Write a comment with your altcoin + hit the like button, and I will make an analysis for you in response. Trading is not hard if you have a good coach! This is not a trade setup, as there is no stop-loss or profit target. I share my trades privately. Thank you, and I wish you successful trades! Trading tip at the end: Organize Personal Life - Professional traders have great management of their personal life as they keep their trading activities from personal concerns. Balancing your personal life is essential to achieve harmony as well as improve your performance in trading.

BTC - Can It go back to 123k - 124k?Yeaah IT CAN! Provided you know where it moves out, it have little imbalances at 115k as well so eye on it as well!
BITCOIN LONG TRADEBTC had a large flush after its ATH of 123.1k causing most late longs to get wiped out. It seems fear has been overestimated and we should see a reversal soon. We're also near major support on the 4h and have an oversold StochRSI. CPI numbers are coming out today so make sure you're managing risk accordingly and only invest what you can afford to lose.

Potential path for BTC (no free lunch)
The market gets horny as PA moves into the weekly open again.
BTC pulls an F-you move and dumps into the Daily fair value gap
THEN continuation actually happens

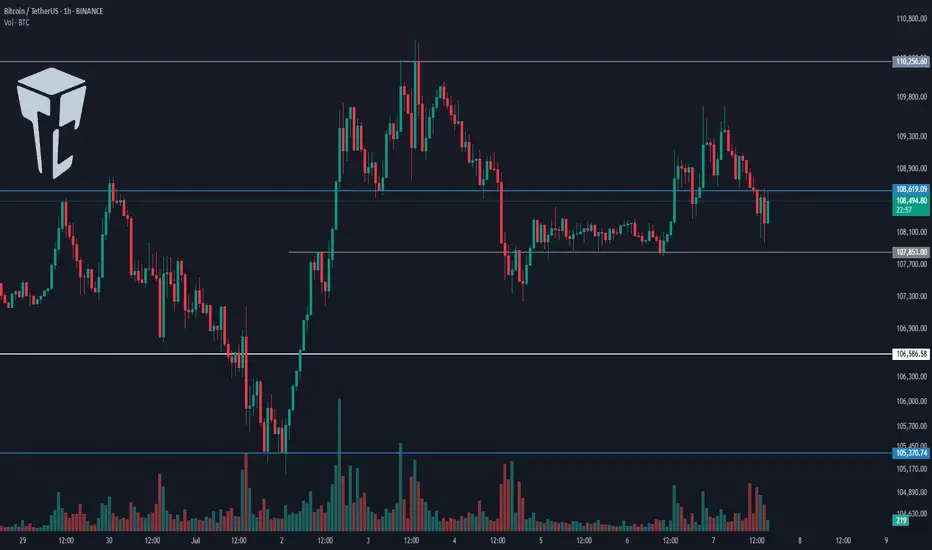
TradeCityPro | Bitcoin Daily Analysis #121👋 Welcome to TradeCity Pro!
Let’s dive into the Bitcoin analysis and key crypto indicators. As usual, I’ll walk you through the triggers for the New York futures session.
⏳ 1-Hour Timeframe
As you can see on the 1-hour timeframe, the upward move Bitcoin made yesterday turned out to be a fakeout, and the price is now heading downward.
⚡️ I’m not moving the 108619 line for now. I’ll wait to see if the price reacts to it again in the future, then decide whether to adjust it.
✅ Currently, if the 107853 level breaks, we can enter a short position. We already have volume confirmation, and if this increase in volume continues, we could see a sharp downward move.
📈 Next support levels for Bitcoin in this timeframe are 106586 and 105370, which can be used as targets.
✨ If Bitcoin starts moving upward again, the long trigger remains the 110256 level. A breakout here would mark the beginning of a true uptrend.
👑 BTC.D Analysis
Bitcoin dominance continued its downward move today, dropping close to the 65.04 level.
🔼 We’re currently seeing a reaction at this level, suggesting some support. A break below 65.04 could trigger a strong downtrend.
📅 Total2 Analysis
This index is still in an uptrend but showing significant weakness. It’s currently sitting on key support at 1.15.
⚡️ A break below this level could give us a short position. Additional support levels are 1.14 and 1.13. For a long position, the only trigger we have right now is 1.17.
📅 USDT.D Analysis
Looking at Tether dominance, it’s still hovering around the 4.78 level. After a brief fakeout below, it has returned above that zone.
📊 If this level breaks again, Tether dominance could move down toward 4.72.
❌ Disclaimer ❌
Trading futures is highly risky and dangerous. If you're not an expert, these triggers may not be suitable for you. You should first learn risk and capital management. You can also use the educational content from this channel.
Finally, these triggers reflect my personal opinions on price action, and the market may move completely against this analysis. So, do your own research before opening any position.
BitcoinBitcoin/TetherUS (BTC/USDT) Trading Analysis - Jul 15, 2025
Key Observations:
Price Movement:
Current Price: $117,692.46
24h Change: -2,148.72 (-1.79%)
Range: Low of $116,250.00 to High of $119,940.83
The price is currently near the lower end of the day's range, indicating bearish pressure.
Support and Resistance:
Support Levels:
Strong Support: $112,000.00 (marked as S/L)
Intermediate Support: $113,500.00 and $110,000.00
Resistance Levels:
Immediate Resistance: $119,900.00
Higher Resistance: $120,000.00 and $122,500.00
Profit Levels:
The "Profit" section lists potential take-profit targets, with the highest at $135,000.00.
The price has recently dipped below the $120,000.00 psychological level, suggesting weakening bullish momentum.
Trend Context:
The chart spans from June to September, but the current price action (July) shows consolidation after a potential pullback from higher levels.
The presence of multiple support levels ($112K–$116K) suggests a critical zone for buyers to defend.
Actionable Insights:
Bearish Short-Term: The price is below key levels ($119,900–$120,000) and has broken below $118,250.00. A retest of support at $112,000.00 is plausible.
Bullish Reversal Signal: If BTC holds above $112,000.00 and reclaims $120,000.00, it could target $122,500.00 or higher.
Risk Management: A break below $112,000.00 (S/L) may trigger further downside toward $110,000.00 or lower.
Conclusion:
The market is currently in a corrective phase. Traders should monitor the $112,000.00 support for potential reversals or breakdowns. A close above $120,000.00 would shift bias to bullish.

SELL BTC 13.7.2025 (scalping M15)Counter-trend trade order: SELL at THE TOP
Type of entry: Limit order
Condition:
- If the price break down at 122,041 confirming the down trend.
Note:
- Management of money carefully at the price of bottom (122,041)
Set up entry:
- Entry sell at 122,821
- SL at 123,334
- TP1: 123,041
- TP2: 121,389
Trading Method: Price action (No indicator, only trend and candles)

BTCUSDT 1 Day – Breakout and Retest Completed | Next TargetBTC has officially broken out of the descending parallel channel that dominated price action from mid-May to early July. After a successful breakout, price pulled back for a clean retest of the channel resistance, which has now flipped to support — a classic bullish continuation signal.
🔹 Key Technical Highlights:
✅ Breakout from descending channel structure
✅ Retest of breakout zone confirmed with strong bullish candles
🔼 Current Price: ~$118,971 (as of chart time)
📈 Short-Term Structure: Following a clean higher-low formation with ascending trendline support
🎯 Target Zone: $128,000–$130,000 (next key resistance area)
As long as BTC maintains this ascending support line, the momentum remains with the bulls. Any dips toward the trendline may offer good long opportunities with proper risk management.
📌 Watch for:
Rejection near the target zone
Bullish continuation patterns like flag/pennant on lower timeframes
Volume confirmation during breakout attempts
Let the trend be your friend. Trade safe! ⚡


BTCUSDT idea within the next 24 hoursas explained in the video, im taking the trades as projected in my video...
i will share any update if anything changes

btc 120k then 115in im opinion btc will go up 120k max then fall to 115k , bcs there are a lot of sl's :D
