BTC - ATH Incoming?current market structure
this 1-hour chart of btcusdt presents a sophisticated transition from accumulation to a potential breakout structure, with well-defined fair value gaps (fvgs) and a clear instance of manipulation followed by rapid recovery. the market appears to be attempting to regain bullish momentum following a liquidity sweep and subsequent internal shift in structure.
accumulation within an ascending channel
price action developed within an ascending channel, marked by higher highs and higher lows over time. this is a classic representation of controlled bullish accumulation. the tight, stair-stepping movement reflects steady institutional positioning, building long exposure while keeping volatility contained. this phase shows multiple rejections of the lower trendline, confirming consistent demand.
manipulation into fvg
the breakdown beneath the channel coincides with a sharp move into a large fvg (highlighted in light blue). this aggressive wick likely triggered stop-losses of retail longs, constituting a liquidity grab or manipulation event. such actions are typical after extended consolidations, flushing out weak hands to enable large players to enter at a discount. the reaction from this zone confirms its significance, as buyers immediately stepped in and reclaimed lost ground.
recovery and shift in momentum
after manipulation, the market found support in the fvg zone and launched a sharp bullish move. the rapid recovery illustrates strong underlying demand. the price re-entered a smaller fvg (labelled “resistance in this fvg”), briefly faced selling pressure, and then decisively broke through it. this reclaim of supply zones is often a powerful signal that bullish momentum is back in control.
bullish inversion fair value gap (ifvg)
price is now challenging a smaller bullish internal fair value gap (ifvg), marked in red. this zone, which once acted as a resistance layer, has now become a pivot point. successful hold or breakout above this region would likely trigger continuation, with market participants targeting previous swing highs or beyond.
break of structure and bullish continuation
a key development here is the break above the previous swing high or "bsL" (buy-side liquidity). this signifies a structural shift—no longer just recovering, the market is actively seeking higher liquidity. such breaks often catalyze rapid directional movement, especially when they occur after liquidity has been swept from the opposite side.
distribution and potential for new all-time high
the green projection suggests the possibility of further bullish expansion toward a distribution zone. if current momentum continues and no major supply zones disrupt the advance, the market could be on its way to challenge or set new all-time highs (ath). the label “on the way to new ath?” reflects this open-path scenario, contingent on continuation above 105,600–106,000 levels.
market psychology
this chart reveals a narrative of engineered manipulation followed by strength confirmation. institutions manipulated price below support to shake out retail traders, then absorbed that liquidity and pushed price higher. once resistance was reclaimed, confidence returned, inviting both short cover and fresh long entries. such sequences reinforce the importance of waiting for price reactions at key levels rather than acting on the first impulse.
summary
btc has exited an accumulation phase within a rising channel, experienced a strategic liquidity sweep into a deep fvg, and then quickly reversed. the current positioning above multiple reclaimed fvgs and just beneath a structural break confirms a bullish outlook. if price holds above the current bullish ifvg, the pathway to distribution and possibly new highs remains open. strategic traders may now focus on confirming pullbacks into these reclaimed zones for continuation setups.
BTCUSDT trade ideas

BTC - Accumulation, Manipulation & Distributioncurrent market structure
this btcusdt 1-hour chart illustrates a classic three-phase market structure: accumulation, manipulation, and potential distribution. the price action follows a strong bullish impulse, after which the market enters a sideways range suggesting absorption of previous selling pressure. this kind of behavior is often observed before a continuation of the prevailing trend, but not without intermediate structural games, as seen in the projected manipulation phase.
accumulation phase
the blue highlighted zone marks a consolidation range that serves as an accumulation phase. during this stage, large market participants likely accumulate positions quietly while maintaining the price within a defined range. the tight price action within this zone and relatively small candles are consistent with market absorption, where supply is being matched or outpaced by demand. the repeated rejections of lower prices in this range imply growing buyer interest and strength building beneath the surface.
unfilled fair value gap
beneath the accumulation range lies an unfilled fair value gap (fvg), shown in grey. this price imbalance was left behind during the prior bullish leg and remains a magnet for price action. such gaps often attract price as the market seeks efficiency by mitigating unbalanced areas. the presence of this fvg makes it a likely candidate for a liquidity grab or retest before further bullish continuation.
manipulation setup
the red path outlines a possible short-term manipulation event. this move involves a quick sweep of liquidity beneath the accumulation zone, triggering stop-losses from late long entries and drawing price into the fvg. this is a classic “spring” or “shakeout” scenario designed to trap sellers and create panic, thereby enabling larger players to enter at discounted prices. the manipulation tag here signals a deliberate attempt to create false downside conviction before reversing upward.
re-accumulation and breakout
following the manipulation phase, the green projection shows a sharp reversal and aggressive push upward, initiating a new bullish leg. this move represents re-accumulation, where price quickly exits the range and enters an expansion phase. momentum will likely increase after price breaks back above the original range high, signaling confidence in the trend continuation and drawing in breakout traders. the large green area indicates the expected path toward a new distribution zone.
distribution projection
at the top of the chart, the green box represents a possible future distribution zone. after an extended bullish run, price often enters distribution, where buying interest begins to wane, and larger participants start offloading positions into retail strength. although speculative at this point, its placement reflects the natural progression of a market cycle if the projected bullish move plays out.
market psychology
this chart reflects a clear sequence in market psychology: stealth accumulation, a manufactured dip to create fear (manipulation), followed by a surge fueled by both institutional entries and retail breakout traders. understanding this dynamic helps traders anticipate rather than react, positioning themselves in alignment with likely intent rather than emotional impulses.
summary
the chart outlines a structured bullish scenario with a potential manipulation wick into an unfilled fvg, setting the stage for a continuation higher. if price reacts strongly off the fvg and regains the range, confirmation of bullish intent would be established. this setup emphasizes the importance of understanding liquidity dynamics and price inefficiencies, favoring patient and strategic entries over reactive ones.

Bitcoin – Sweep the Highs, Next Target $98kMarket Overview
Bitcoin has been trading sideways for more than 8 days now, forming a tight consolidation range with no real breakout in sight. This kind of price action typically signals accumulation or distribution by larger players. While it may seem indecisive on the surface, this phase is often where the market sets its trap. What looks like inaction is actually a setup in progress. Price is compressing, volume is thinning out, and both bulls and bears are being lured in. That’s a perfect recipe for a sudden, aggressive move that wipes out one side entirely.
Liquidity Structure
The structure of this range is very clean, which in trading terms usually means dangerous. On the top side, we have a lot of liquidity, just above $105,800. This level has been tapped multiple times but never convincingly broken, and it now acts as a magnet for liquidity. On the flip side, the downside holds multiple clean lows, all clustered under the $100,000 mark. Both ends of this range are packed with liquidity. Smart money doesn’t trade in fair value, it trades where the most liquidity sits, and in this case, both the top and bottom of the range are loaded.
Inducement and Manipulation
The real purpose of this kind of range is not balance, it’s inducement. The market is inviting traders to take breakout positions on both sides, knowing full well that it’s unlikely to follow through cleanly. I believe we are currently in the inducement phase of the cycle. The equal highs around $105,800 are baiting breakout longs and short stop-losses alike. A move above that level would act as the stop hunt, triggering the final wave of longs before the rug is pulled. Once that liquidity is taken, I expect a sharp reversal that targets the lows of the range and continues further toward the real pool of liquidity sitting between $98,000 and $97,500.
Scenario Outlook
The most probable sequence from here is a fake breakout to the upside, followed by an impulsive selloff. A wick above $105,800 would serve as the signal, and once that inducement is cleared, the move down should be fast and decisive. This drop would take out the range lows and sweep the stops of everyone who tried to buy the breakout. If price does hold above $105,800 and shows continuation with strong volume and follow-through, that would be an invalidation of this short setup and a shift in structure, in which case I would reassess and wait for a pullback before considering any longs.
Price Target and Expectations
The first key event is the sweep above $105,800. That’s where breakout traders will commit, and that’s where I expect the reversal to begin. From there, downside targets include the low of the range and deeper liquidity near $98,000 to $97,500. This area aligns with a big imbalance zone, inefficiencies and the golden pocket fib level.. The expectation is for a quick drop once the trap is sprung, with a potential for a reaction or even a new bullish setup forming near that demand region.
Conclusion
Bitcoin has been compressing for over a week, and that usually ends with expansion. But expansion is not always trend continuation, especially when the structure suggests manipulation. The current setup looks ideal for a stop run above the range before dumping into deeper liquidity. The key is to wait for the sweep and watch how price reacts. The more obvious the breakout, the more likely it is to fail. Liquidity is king in this environment, and right now, the biggest pockets lie below.
___________________________________
Thanks for your support!
If you found this idea helpful or learned something new, drop a like 👍 and leave a comment, I’d love to hear your thoughts! 🚀
Make sure to follow me for more price action insights, free indicators, and trading strategies. Let’s grow and trade smarter together! 📈

Bitcoin BTC Is Entering Into CorrectionHello, Skyrexians!
I got a lot of comments to analyze BINANCE:BTCUSDT because it has almost reached ATH and people don't understand what is happening. In my opinion last pain ahead and after that likely we see great gains.
Let's take a look at 4h time frame. We can finally notice the full 5 waves cycle which is likely to be finished. If you remember my recent analysis this is just the wave 1 inside higher degree wave 3. Awesome Oscillator has printed divergence, so there is a great chance that correction has been already started. The target for this correction is 0.5 Fibonacci at $90k. I don't recommend you to short this move if you are not experienced because this is trade against the trend.
Best regards,
Ivan Skyrexio
___________________________________________________________
Please, boost this article and subscribe our page if you like analysis!

After $105K Peak, Bitcoin May Revisit 0.382 FOB Level!CRYPTOCAP:BTC is pulling back after hitting a high of $105,800
If you look at the daily chart, we haven’t seen any healthy pullback, the price has gone straight up.
In my opinion, a retest of the 0.382 FOB level around $94K would be a healthy correction for Bitcoin. Based on the liquidation heatmap, we’re also seeing liquidity building up at lower levels.
This is one of the signs of a pullback, which is important for a sustainable and healthy market.
Stay tuned and follow for more updates!

Bitcoin - $100k retest before new ATH?Bitcoin has broken out of its 1-hour ascending channel with a sharp bearish displacement, ending the slow grind higher that had been in place since the 9th of May. That channel served as a controlled environment for accumulation and small trend continuation, but the move we just saw confirms that the phase of balance has shifted into a clear retracement. The displacement candle was strong, clean, and aggressive, closing well outside the lower boundary of the channel and taking out multiple internal lows in the process. This wasn’t a weak break, it showed intent.
From a market structure standpoint, this confirms that short-term control has shifted to the downside. That move also left behind a visible Fair Value Gap just above current price, which is likely to act as a draw in the coming sessions. Unless that FVG gets reclaimed impulsively, this looks like the beginning of a deeper retracement.
Consolidation Structure
Prior to the break, BTC was building liquidity inside a clean ascending channel. The highs kept getting swept by small wicks, which hints at repeated inducement and short-term stop hunts. The final push into the top of the channel marked the last bullish attempt, and price immediately reversed after that sweep. The moment it broke structure with a high-volume bearish candle, the entire channel was invalidated and turned into supply.
We now have a clean CISD framework in play, price consolidated inside a channel, created inducement near the highs, triggered a stop hunt into the upper end of the range, and then dropped with strong displacement. That displacement not only broke structure but also left behind an imbalance that has yet to be filled.
Bullish/Bearish Scenarios
Right now, the short-term bias is bearish. The break of structure is confirmed, the Fair Value Gap is still open, and there is a clear inefficiency left behind. I expect price to revisit that gap and then reject to the downside again. That would complete the FVG retest leg and open the door for a move into deeper zones.
The next key area of interest is around the $100,000 mark, slightly below the current trading range. That level holds both technical and psychological weight. It lines up with a previous breakout zone, an unfilled imbalance, and likely a large pool of resting liquidity from retail long stops and institutional bids. If we reach that zone, I’ll be watching for signs of strength to suggest that this pullback was a liquidity grab before the next leg up.
If we do get that tap into $100K and price responds with bullish displacement from there, the bullish narrative would be back in play. That could easily form the base for a new impulse toward all-time highs. However, if $100K fails to hold and price pushes through without a significant reaction, then we’re dealing with a larger correction, and I’d expect continuation toward lower inefficiencies.
Price Target and Expectations
First, I expect a small leg up to fill the Fair Value Gap inside the broken channel structure. That area will act as the first test, and if price shows rejection there, I’m looking for continuation toward the $100,000 to $99,500 region. That zone aligns with a clean 1H imbalance and marks the origin of the last strong bullish expansion.
If BTC taps into that deeper imbalance and confirms a reversal with clear bullish intent, the stage will be set for a potential breakout into new all-time highs. That’s where I would expect stronger hands to step in and take control. The longer price holds above that $99k zone, the higher the odds we break past the previous high.
But if there’s no reaction and price bleeds through $99K, the bullish structure on the higher timeframes would be compromised, and the move could extend toward the mid-$90K range.
Current Stance
Short-term bearish, waiting for price to retest the FVG inside the previous channel. That will be the first key area where I expect a reaction. If the rejection confirms, I’ll be watching for signs of continuation into $100K.
Not interested in chasing price between levels. I’ll either look to short the FVG retest with confirmation or wait for the deeper tap into the $100K zone to look for a long setup. No trades in the middle, only acting at the extremes where the risk-reward makes sense.
Conclusion
This setup fits cleanly into a classic displacement narrative. Bitcoin broke out of structure with a high-volume move, left behind an FVG, and is now likely preparing for a short retrace before continuing lower. The $100K zone is the main area to watch — that’s where the next high-probability trade opportunity is likely to develop. If bulls defend that zone and we get bullish confirmation, the path to new highs is still intact. But if $99K fails, I’ll be sidelined and looking for the next major level.
The structure is clear, the inefficiencies are visible, and the plan is defined. Now it’s just about waiting for price to do its job.
___________________________________
Thanks for your support!
If you found this idea helpful or learned something new, drop a like 👍 and leave a comment, I’d love to hear your thoughts! 🚀
Make sure to follow me for more price action insights, free indicators, and trading strategies. Let’s grow and trade smarter together! 📈

Bitcoin at Resistance With Weak Momentum-Bearish SetupBitcoin ( BINANCE:BTCUSDT ) finally reached the Resistance zone($105,100-$104,520) as I expected yesterday. Of course, the way Bitcoin reached the resistance zone was NOT with high momentum , so I decided to share this analysis with you.
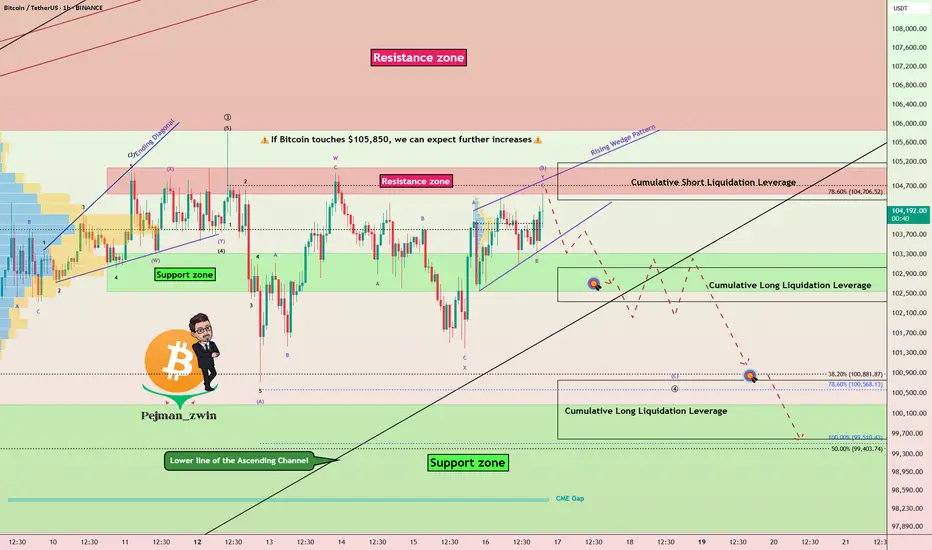
In terms of Classic Technical Analysis , Bitcoin appears to have formed a Rising Wedge Reversal Pattern between Support zone($103,320-$102,600) and Resistance zone($105,100-$104,520) over the past few hours .
In terms of Elliott Wave theory , given Bitcoin’s low momentum and the Heavy Cumulative Short Liquidation Leverage($105,180-$104,412) ahead of Bitcoin, it appears that Bitcoin has completed microwave B of the main wave 4 with a Double Three Correction(WXY) .
I expect Bitcoin to decline to at least $102,800 at the first target AFTER breaking the lower line of the Rising Wedge Pattern, and if the Support zone($103,320-$102,600) and lower line of the ascending channel(Major) are broken, we should expect a drop to Cumulative Short Liquidation Leverage($100,763-$99,600) .
Note: If Bitcoin touches $105,850, we can expect further increases.
Please respect each other's ideas and express them politely if you agree or disagree.
Bitcoin Analyze (BTCUSDT), 1-hour time frame.
Be sure to follow the updated ideas.
Do not forget to put a Stop loss for your positions (For every position you want to open).
Please follow your strategy and updates; this is just my Idea, and I will gladly see your ideas in this post.
Please do not forget the ✅' like '✅ button 🙏😊 & Share it with your friends; thanks, and Trade safe.
HelenP. I Bitcoin will fall to support zone and then start riseHi folks today I'm prepared for you Bitcoin analytics. This chart shows how the price continues to trade inside a rising channel, with the price currently hovering just above the support zone around 101000. After forming a clean consolidation phase near the upper boundary of the structure, the market is showing signs of a potential pullback toward this zone. However, the broader trend remains bullish, and as long as price holds within the ascending formation, this correction may act as a base for the next move higher. The consolidation structure formed at the top indicates that buyers are not rushing in aggressively, but they are also not allowing prices to drop sharply, a classic sign of accumulation. This aligns well with the previously confirmed trend line and horizontal support zone. If BTC holds this area and finds renewed momentum, I expect a breakout from the consolidation range to the upside. My goal remains at 107000 points, which sits a little higher than the projected top of the current channel. Given the strength of the structure, the higher lows, and the recent defense of support, I maintain a bullish bias and anticipate another upward wave from this level. If you like my analytics you may support me with your like/comment ❤️

BTC Approaches All-Time High — But Signs of Weakness Emerge!BTC is once again approaching its all-time high (ATH) on the daily timeframe, generating excitement across the market. However, a closer look at the lower timeframes reveals signs of potential exhaustion as BTC encounters strong resistance. This suggests a pullback could occur before any continuation higher.
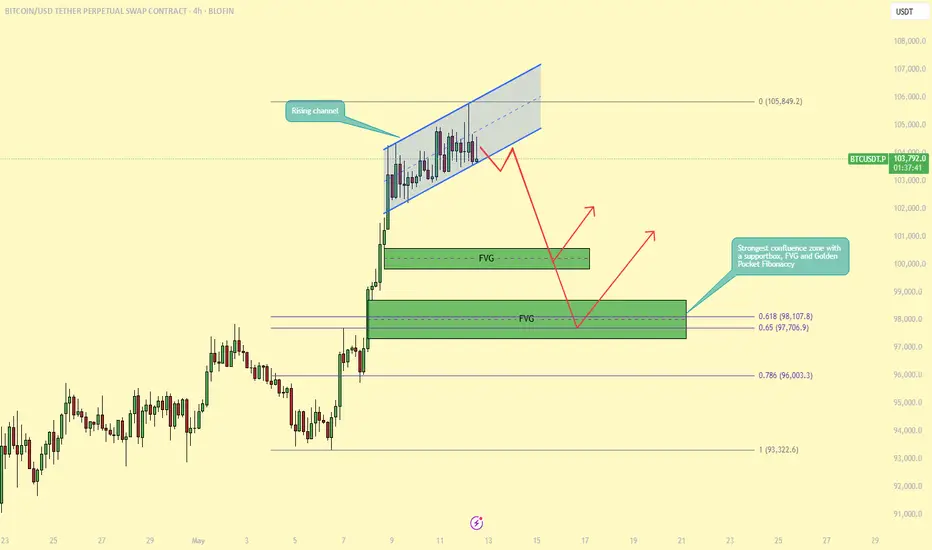
On the 4-hour and 1-hour charts, BTC is currently trading within a rising channel, which is often considered a bearish continuation pattern, especially when it forms directly below a key resistance level like the ATH. Price action within this structure is starting to lose momentum, and the presence of bearish divergences and decreasing volume further supports the likelihood of a near-term correction.
Where Could We Buy the Dip?
A pullback may offer a strategic entry opportunity for traders looking to ride the next leg up. Notably, two fair value gaps (FVGs) were created during the recent upward move. The first FVG could provide a minor bounce, but the second one is more compelling for a higher-probability long setup.
This second FVG aligns with a well-established support zone and coincides with the Golden Pocket of the Fibonacci retracement (between the 0.618 and 0.65 levels). This confluence of technical factors makes it a strong area of interest for bulls, and a potential springboard for price to retest, and possibly break, the ATH.
In summary, while BTC is showing strength on the higher timeframes, lower timeframe patterns suggest that a healthy correction is likely. Patience and proper level selection will be key. Watching how price reacts around the second FVG and the Golden Pocket zone may present one of the best opportunities for re-entry.
-------------------------------
Thanks for your support.
- Make sure to follow me so you don't miss out on the next analysis!
- Drop a like and leave a comment!
Bitcoin – Respecting $103k FVG, Approaching ATH.Bitcoin failed to fully fill the large 4h and 1h FVG around the $100,000 zone, front-running the level before bouncing sharply. This type of price behavior suggests strong demand, with buyers stepping in aggressively before the inefficiency could be completely mitigated. The market is now shifting back to a more bullish tone after establishing a short-term bottom near the key higher-timeframe FVG.
Consolidation Structure
The price action has been messy and range-bound over the past few days, stuck between the major 1h/4h demand zone around $102,000 and the $105,000 resistance level. Within that broader range, Bitcoin created a new 1h FVG on the push off the lows, which has already been respected intraday around the $103,000 area. That newly formed FVG now acts as short-term support as price grinds upward again toward the prior resistance.
Bullish/Bearish Scenarios
On the bullish side, if Bitcoin flips the $104,500 to $105,000 resistance area cleanly into support with a convincing displacement and consolidation above it, there’s a good chance it will break out and target higher inefficiencies above $106,000. That would confirm buyers are in full control and using each FVG as a stepping stone higher.
However, if price gets rejected again inside the resistance zone without showing signs of strength or accumulation just below it, we could see another rotation lower back to the $100,000 FVG or potentially even a deeper retest of the broader $97,500 area. A rejection at the highs could align with a sweep of local buy-side liquidity and serve as a trigger for a short-term reversal.
Price Target and Expectations
Upside breakout targets sit around $106,200 and higher, based on the previous price inefficiencies and trend structure. On the downside, if we see rejection, price may revisit $100,000 and possibly test the deeper 4h imbalance zone closer to $97,500 again.
Current Stance
For now, price is trading inside the upper portion of the range and grinding into a known resistance area. There’s no clear confirmation yet of either a breakout or rejection, so the next move depends heavily on how price reacts within the $104,500 to $105,000 zone. Watching for either bullish continuation (with a clean flip and hold above) or a strong rejection setup for a possible fade back into the midrange.
Conclusion
Bitcoin continues to respect FVGs both to the downside and upside. The bounce from the 1h/4h demand confirms higher timeframe interest, and the respect of the new 1h FVG around $103,000 shows short-term strength. The next major decision point is the $105,000 resistance. A clean break and flip could signal continuation, while rejection there may trap longs and send price back toward demand.

Bitcoin Breakout Loading: Resistance Zone Under Pressure!!!Bitcoin ( BINANCE:BTCUSDT ) made the correction I expected , as I predicted in my previous idea .
Bitcoin is trading in the Resistance zone($103,320-$102,600) and near the Resistance lines . Given the momentum of the previous hour's candle and the fact that the previous three candles together formed a Morning Star Candlestick Reversal pattern , it is expected that the Resistance lines will be broken soon.
In terms of Elliott Wave theory , it looks like Bitcoin has completed the main wave 4 as I expected with a Zigzag Correction(ABC/5-3-5) . A break of the Resistance lines by Bitcoin could confirm the end of the main wave 4 .
Also, given Bitcoin's higher correlation with the S&P500 Index ( SP:SPX ) and the fact that I expect the S&P500 Index to increase , the increase in the S&P500 Index could help Bitcoin increase further .
I expect Bitcoin to break the Resistance zone($103,320-$102,600) and Resistance lines soon and attack towards the Resistance zone($105,100-$104,520) .
Cumulative Long Liquidation Leverage: $101,360-$100,600
Note: If Bitcoin falls below $101,280, we should expect further declines.
Please respect each other's ideas and express them politely if you agree or disagree.
Bitcoin Analyze (BTCUSDT), 1-hour time frame.
Be sure to follow the updated ideas.
Do not forget to put a Stop loss for your positions (For every position you want to open).
Please follow your strategy and updates; this is just my Idea, and I will gladly see your ideas in this post.
Please do not forget the ✅' like '✅ button 🙏😊 & Share it with your friends; thanks, and Trade safe.

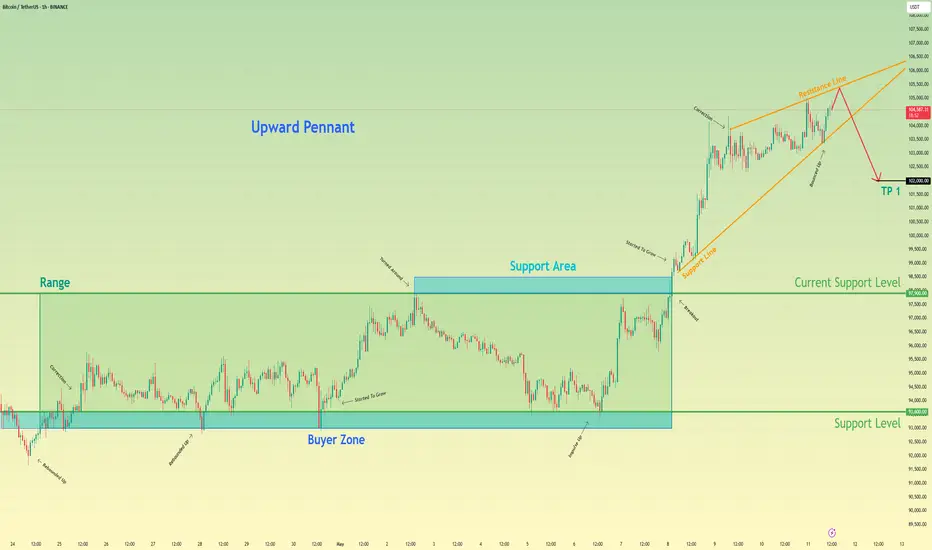
Bitcoin may drop to 102K points, exiting from pennantHello traders, I want share with you my opinion about Bitcoin. After breaking out of a multi-day range and launching a strong impulse from the buyer zone, the price has formed a clear upward pennant pattern. This technical formation often signals a potential slowdown in the bullish momentum, especially when it follows an aggressive move to the upside. The current price action shows that BTC has approached the resistance line of the pennant, but failed to generate further breakout strength. Each new impulse within the structure has weakened, and the market is starting to compress inside narrowing boundaries. The support area has been holding the structure temporarily, but the inability to push through the top of the pennant suggests growing exhaustion among buyers. This setup indicates that BTC may soon break downward from the pennant. So, I expect that it will make a correction that could drive the price down to the 102000 points, thereby exiting from pennant pattern. Please share this idea with your friends and click Boost 🚀
Bitcoin can drop from wedge to 100K pointsHello traders, I want share with you my opinion about Bitcoin. After consolidating for an extended period within a triangle pattern, the price eventually broke out with strong bullish momentum. The move was supported by a solid rebound from the buyer zone and a clean breakout above the 92800 - 94200 support area. This breakout initiated a steep climb, forming a new upward wedge structure, defined by narrowing trend lines and rising local highs. Currently, the price is trading near the resistance boundary of the wedge, around the 104000 - 105000 zone. This zone has already triggered one rejection and is showing signs of weakening bullish strength. Given the rising wedge geometry and the fading impulse strength, the risk of a correction is increasing. The current structure typically leads to a pullback, especially after such a steep rise. I expect that BTC may rise to the resistance line of the wedge and then drop below the support line, thereby exiting from this pattern. That's why I set my TP 1 at the 100K points. Please share this idea with your friends and click Boost 🚀

Your Guide to Token Trends & Market Action – With My AnalysisHey everyone! Hope you're all enjoying a great weekend !
If you'd like a Token analysis , please drop your request in the comments using the format below:
Request Format :
Project Name: Bitcoin
Token Symbol: BTC
Please Note:
I’ll be analyzing up to 10 tokens only .
One request per person — make it count!
Your analysis will be posted directly as a reply to your comment .
If you find this helpful, don’t forget to ✅ Like ✅ and Share it with your friends.
Wishing you health, wealth, and massive success!

TradeCityPro | Bitcoin Daily Analysis #94👋 Welcome to TradeCity Pro!
Let’s go over the Bitcoin analysis and major crypto indexes. As usual, I’ll cover the New York futures session triggers for you.
⏳ 1-Hour Timeframe
As you can see, yesterday the price was rejected from the 104204 level and formed a lower high compared to 104800. Currently, there's a strong chance the short trigger will activate, so let’s review those triggers.
🔽 For a short position, the area where the price is currently consolidating—102882—is a suitable trigger. If this level breaks, the price could drop to 101628.
📊 One note about this trigger: the zone between 102882 and 101628 is a major support range. Every time the price has entered it, it’s formed long wicks and exited with strong bullish candles.
✨ So, if we enter a position based on this trigger, the volatility of the candles increases the chance of getting stopped out. On the other hand, using a large stop loss isn’t ideal either, since these trades go against the main trend and work better with a tight stop to hit the target faster.
💥 The next trigger is the break of 101628, which seems more reasonable. Breaking this level confirms a deeper correction and opens the path toward levels like 99225.
✔️ For a long position, if the price prints a higher low above 101628, we can confirm a bullish bias with the break of 104204. A higher low indicates strong bullish momentum, allowing us to use a slightly riskier trigger.
⚡️ However, if the price falls to the bottom of the box and then returns to the top, the main long trigger becomes a breakout above 104800.
🔍 Today, most of the market volume is on the sell side, and red candles are getting solid volume, so a correction to the box bottom seems likely. Either way, we have to wait for the triggers to activate.
👑 BTC.D Analysis
Bitcoin Dominance continues its bullish move after breaking the descending trendline. Yesterday, it printed a higher low and broke 63.30, reaching 63.61, and is now consolidating below that level.
🔔 If this level is broken too, we’ll have the first confirmation of a trend reversal in dominance. Full confirmation will come after BTC.D holds above 63.95.
📅 Total2 Analysis
Let’s move to Total2. Yesterday, the 1.19 trigger activated, and the price dropped to 1.17. The reaction to 1.18 wasn’t strong or clean, so I’ve adjusted the support level to 1.17.
📉 Today, we can open a short position if 1.17 is broken. For a long, if the price moves above 1.19, we can go long on altcoins that trigger accordingly.
📅 USDT.D Analysis
Now looking at Tether Dominance. Yesterday, it reacted to 4.70 and is now forming a higher low, heading back toward that level.
☘️ I see strong bullish momentum on the chart, and I believe the probability of breaking 4.70 is high. If it breaks, USDT.D could move up to 4.82.
❌ Disclaimer ❌
Trading futures is highly risky and dangerous. If you're not an expert, these triggers may not be suitable for you. You should first learn risk and capital management. You can also use the educational content from this channel.
Finally, these triggers reflect my personal opinions on price action, and the market may move completely against this analysis. So, do your own research before opening any position.

Bitcoin at PRZ! Is This the Calm Before a Drop?As I expected in yesterday's idea , Bitcoin ( BINANCE:BTCUSDT ) started to rise from near the Support line and hit the Target .
Bitcoin is trading near the Potential Reversal Zone(PRZ) , the upper line of the ascending channel(minor) , and the Resistance line .
In terms of Elliott Wave theory , it seems that Bitcoin has successfully completed the microwave B of the main wave 4 in the ascending channel(minor). A break of the lower line of the ascending channel(minor) could be a sign of the completion of this wave. The corrective structure of the main wave 4 so far could be a Zigzag(ABC/5-3-5) .
I expect Bitcoin to drop to at least $100,923 AFTER breaking the lower line of the ascending channel(minor) and breaking the Support line, the next target could be the lower line of the ascending channel(major) .
Cumulative Short Liquidation Leverage: $106,943-$105,913
Cumulative Short Liquidation Leverage: $105,525-$104,500
Cumulative Long Liquidation Leverage: $100,763-$99,774
Note: If Bitcoin goes above $105,300, we can expect more pumps.
Note: If Bitcoin touches $99,400, we should expect further declines.
Please respect each other's ideas and express them politely if you agree or disagree.
Bitcoin Analyze (BTCUSDT), 1-hour time frame.
Be sure to follow the updated ideas.
Do not forget to put a Stop loss for your positions (For every position you want to open).
Please follow your strategy and updates; this is just my Idea, and I will gladly see your ideas in this post.
Please do not forget the ✅' like'✅ button 🙏😊 & Share it with your friends; thanks, and Trade safe.

BTC Bullish continuation in progressThis formation is one to keep close watch on. The market has printed a well-defined Inverse Head and Shoulders (ISHS) pattern with a clean breakout above the neckline. The breakout was followed by a classic bullish pennant, which perfectly retested the neckline zone—now acting as a strong support base.
The resulting bounce has been impressive, driving price toward the previous All-Time High (ATH). A confirmed breakout above that ATH will likely validate a powerful continuation phase, with the next key target projected around $138,000 and beyond as outlined on the chart.
The structure remains technically sound, and price action continues to favor bulls as long as the neckline holds.

BTC/USDT at Decision Point: Triangle Pattern Signals BreakoutHello guys!
Bitcoin is consolidating in a symmetrical triangle pattern near a key resistance zone after a strong uptrend within the ascending channel. The price is trading just below the triangle’s top line, indicating a potential breakout or breakdown setup.
✔ Key Scenarios:
👀 Scenario 1 – Bullish Breakout:
If BTC breaks above the top of the triangle, we could see a sharp move upward toward the $106K resistance zone and potentially higher.
This would signal trend continuation and strength in the bullish momentum.
👀 Scenario 2 – Temporary Pullback (Triangle Breakdown):
If BTC breaks the bottom of the triangle, the price might fall toward the $99,715 support level.
This zone is also aligned with a previous consolidation and could serve as a strong demand area.
A bullish reversal from this area is likely, providing another long opportunity targeting the same $106K resistance.
Conclusion:
Bitcoin is moving in a tightening range. A breakout from the triangle will dictate the next move. For clearer direction, traders should watch for a decisive move above or below the triangle structure.

BITCOIN → Consolidation in a triangle amid a BULLISH TRENDBINANCE:BTCUSDT is consolidating. A symmetrical triangle is forming against the backdrop of a bullish trend. Given the current technical nuances, we can bet that this consolidation is forming with the aim of continuing growth...
Fundamental nuances have gradually improved over the past few weeks, and the cryptocurrency market has revived slightly. Technically, I like the market structure on D1. After strong growth, the price is not going to fall, consolidation is forming. The market is bullish, after 2-3 weeks of consolidation, a bullish distribution is forming. The cycle has repeated itself twice. On D1, you can see how long tails are forming downward within the consolidation, indicating that whales are buying up all attempts to fall, keeping the market away from risk zones. Accordingly, at the moment, I would say that consolidation may continue for some time, and I do not rule out an attempt to retest the triangle support before growth, or entry into a deeper zone to retest the distant liquidity zones of 101400 and 100700 before continuing growth.
Resistance levels: 103.6, 104.4, 105.0
Support levels: 102.5, 101.4, 100.6
A decline can be considered if the price breaks the triangle support and sticks to 101400, forming a pre-breakdown consolidation (if there is no upward rebound).
However, at the moment, intraday trading can be considered, i.e., from the consolidation boundaries. A signal to exit the consolidation upwards and continue growth will be consolidation between 103.5 and 105.0 and compression towards the upper boundary.
Best regards, R. Linda!

HelenP. I Bitcoin will continue to grow inside upward channelHi folks today I'm prepared for you Bitcoin analytics. The price has recently shown another confident bullish impulse, pushing higher within a clean ascending channel. The key moment was the breakout above the resistance zone, which had previously acted as a ceiling for the price. This breakout marked the continuation of a higher-high, higher-low sequence that confirms the strength of the ongoing trend. Then the market returned to retest this former resistance, now acting as support, and immediately bounced, reinforcing buyer control and validating the area as a foundation for the next move. Now BTC is holding firm in the upper half of the channel, maintaining its position above the trend line with little sign of weakness. This combination of sustained bullish structure, well-respected technical levels, and steady volume behavior suggests that the market is still preparing for higher levels. With the current structure and momentum, I expect BTCUSDT will continue its upward path within the channel. My goal is 108700 points, which aligns almost with the resistance line of the upward channel. If you like my analytics you may support me with your like/comment ❤️

Bitcoin’s Path to ATH: Final Wave or Just a Pause? Bitcoin ( BINANCE:BTCUSDT ) pumped about +2% after the " The United States has dropped its tariffs on Chinese goods to 30%, down from a brutal 145%, while China is slashing its own duties on US imports to just 10%, temporarily, for the next 90 days. " news, but then started to decline again. Do you think Bitcoin can see the new All-Time High(ATH)?
Bitcoin is moving near the Support zone($102,200-$101,680) and Support line .
In terms of Elliott wave theory , Bitcoin appears to have completed microwave 3 of the main wave 5 and is currently completing microwave 4 of the main wave 5 .
Given the momentum of the decline a few hours ago , I expect Bitcoin to either touch the previous low or create a new low in the 1-hour timeframe .
I expect Bitcoin to attack the Support zone($102,200-$101,680) once again and possibly touch the Support line and then attack towards the Resistance zone($109,588-$105,865) with the two scenarios I outlined on the chart .
Cumulative Short Liquidation Leverage: $106,943-$105,913
Cumulative Short Liquidation Leverage: $105,313-$104,787
Cumulative Long Liquidation Leverage: $102,198-$101,697
Note: If Bitcoin can move above $104,500 without correction, we can expect more pumping.
Note: If Bitcoin falls below $101,500, we can expect more declines.
Please respect each other's ideas and express them politely if you agree or disagree.
Bitcoin Analyze (BTCUSDT), 1-hour time frame.
Be sure to follow the updated ideas.
Do not forget to put a Stop loss for your positions (For every position you want to open).
Please follow your strategy and updates; this is just my Idea, and I will gladly see your ideas in this post.
Please do not forget the ✅' like '✅ button 🙏😊 & Share it with your friends; thanks, and Trade safe.

BTC/USDT: 2Potential Long Scenarios Within the Ascending ChannelHello guys!
There are two scenarios here:
Scenario 1: Breakout Continuation (Aggressive Long Entry)
Entry Zone: Around the current price (~$103,000–$104,000)
Reasoning: Price has bounced from the lower boundary of the channel and is now pushing higher with strong momentum. An aggressive long position can be considered with expectations that BTC will continue climbing toward the upper resistance line of the channel.
Target Zone: $110,000–$114,000 (marked in the yellow box)
Scenario 2: Pullback to Support (Conservative Long Entry)
Entry Zone: Between $96,000–$99,715
Reasoning: If BTC faces rejection near current levels or the midline of the channel, a healthy correction could bring the price back to a key demand zone, aligning with the lower trendline and horizontal support levels.
Target Zone: Same upper boundary of the channel ($110,000–$114,000)

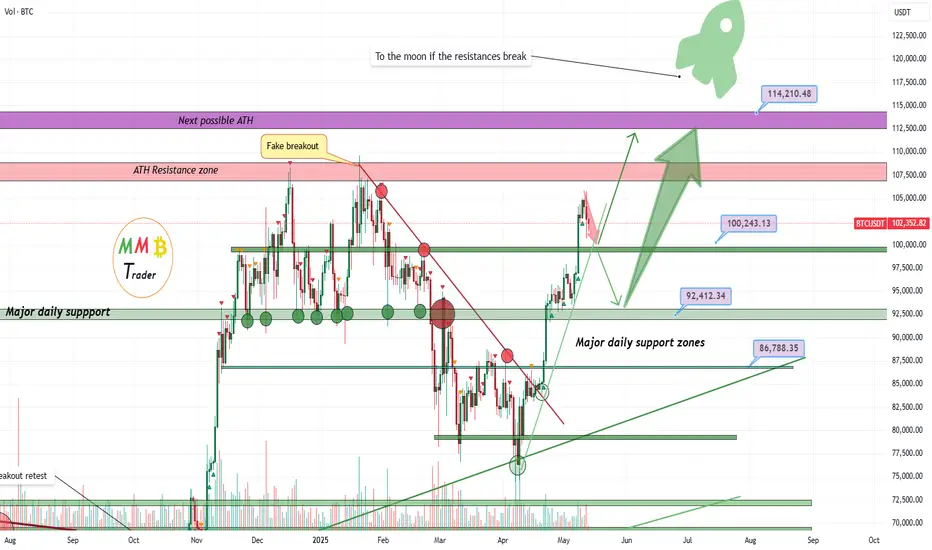
BTCUSDT major daily support zones will pump it again to new ATHAs we can see on the chart now price had a huge amount of pump from our daily low and this pump will continue to new ATH soon but for now we may have range and short-term correction first like the red arrow and then again more gain is ahead like green arrows.
DISCLAIMER: ((trade based on your own decision))
<<press like👍 if you enjoy💚