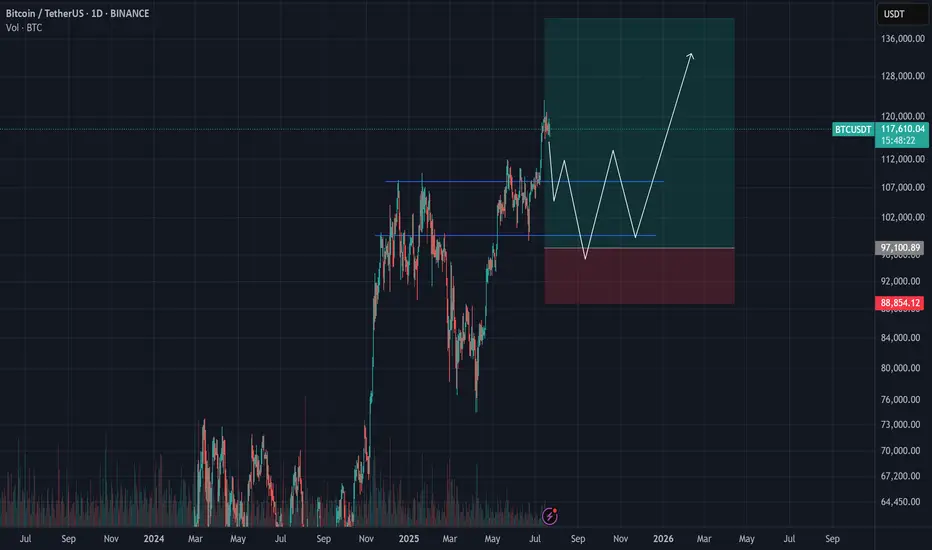
A bearish 12 Month candle could be in the cardsBitcoin made an yearly high of 20% after 6 months in on the yearly candle
This does not make me feel great about the rest of the year
a clear sell signal would be an higher timeframe close under 100k after an upthrust to new ath around 110k - 120k
around 50k-54k for me is an good buy level to build an longterm position:
0.382 fib retracement for an primary 1-2 wave
0.500 fib retracement from the 25k low
0.886 fib retracement from 49k low
50% pullback from current high to projected low
where will bitcoin go ? i don't know, but i do know where i want to buy and when i want to sell
BTCUSDT trade ideas

BTC Liquidity Grab + BounceBitcoin just completed a liquidity sweep below the recent low, grabbing stop-losses before reversing sharply. This move often signals smart money accumulation, as shown by the strong bullish reaction off the demand zone. Aiming for the Buy-Side Liquidity (BSL) above $123K. Volume spike and RSI divergence further validate the bullish narrative.

BITCOIN Indicates Consolidating Moves Before StronBitcoin (BTC) Market Analysis Report
Summary and Conclusion
Bitcoin (BTC) is currently trading around $117,000 to $118,000, showing a slight pullback from its recent all-time high near $123,000. The market sentiment is moderately bullish but cautious, with technical indicators signaling some overbought conditions and short-term consolidation. Institutional interest appears to be cooling off slightly, as evidenced by recent outflows from Bitcoin ETFs, while accumulation continues across various investor tiers, including whales and retail holders.
Key resistance is near $119,400-$120,000, and support lies around $117,200-$116,900. The market is in a "perfect accumulation" phase, with strong buying support despite some profit-taking. The Fear & Greed Index is at 70, indicating greed but not extreme euphoria.
Recent news highlights a mixed picture: Bitcoin remains dominant and stable, but altcoins are gaining some momentum. Institutional flows are shifting somewhat from Bitcoin to Ethereum and other altcoins. Experts predict potential for Bitcoin to reach $200,000 to $250,000 later this year, driven by macroeconomic factors like credit expansion and fiat inflation.
Detailed Analysis
1. Price and Market Data
Market Type Last Price (USD) 24h Change 24h High 24h Low 24h Volume (USD) Funding Rate (Contract)
Spot 116,959.8 -1.65% 119,498.4 116,946.6 1.43B N/A
Contract 116,962.7 -1.65% 119,492.9 116,935.5 8.91B 0.0001
Bitcoin is consolidating below $120,000 after reaching a peak of $123,218 on July 14.
Trading volume remains robust, indicating active market participation.
2. Technical Indicators
Bullish Signals: No strong bullish technical indicators currently detected.
Bearish Signals: RSI indicates overbought conditions, suggesting short-term caution.
Support and Resistance:
Resistance: ~$119,416.6
Support: ~$117,227.4
MACD and other momentum indicators show indecisiveness, implying possible sideways movement or minor corrections before the next major move.
3. Market Sentiment
Fear & Greed Index: 70 (Greed)
Investor sentiment is bullish but tempered by profit-taking and cautious positioning.
ETF flows show a recent reversal with $68 million outflows from Bitcoin ETFs, ending a 13-day inflow streak.
Ethereum and altcoins are attracting more inflows, signaling a rotation in institutional interest.
4. Recent News Highlights
Bitcoin remains dominant but has been mostly stagnant below $120K, while altcoins struggle for momentum.
Institutional investors are shifting some capital from Bitcoin to Ethereum and other altcoins.
Bitcoin is in a "perfect accumulation" phase, with all investor tiers building positions despite some whale transfers.
Experts like Arthur Hayes predict Bitcoin could reach $250,000 by year-end, driven by credit expansion and macroeconomic factors.
Network activity shows a slight dip in active addresses, indicating a short-term pause.
Support levels around $116,952 and $114,354 are critical to watch for downside risk.
Bitcoin's dominance remains strong at around 61%.
5. Outlook
Short-term: Bitcoin may continue to consolidate between $117,000 and $120,000, with potential minor pullbacks due to overbought RSI.
Medium to Long-term: Positive macro factors and accumulation trends suggest potential for new highs, possibly targeting $150,000 to $250,000.
Watch for a breakout above $120,000 to confirm bullish momentum continuation.
Monitor ETF flows and on-chain activity for signs of renewed institutional interest or caution.
Recommendations for Traders and Investors
Traders: Consider cautious trading around current levels, watching for RSI and MACD signals for entry/exit points. Be mindful of resistance near $120,000.
Investors: Accumulation phase suggests good opportunities for long-term holding, especially if Bitcoin holds above $117,000.
Risk Management: Keep stop-loss orders near support levels to mitigate downside risk in case of a correction.

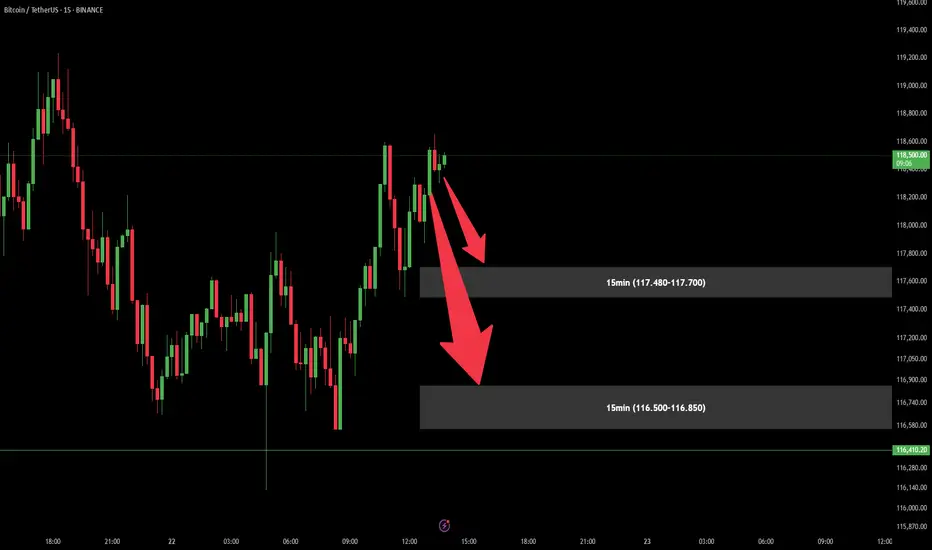
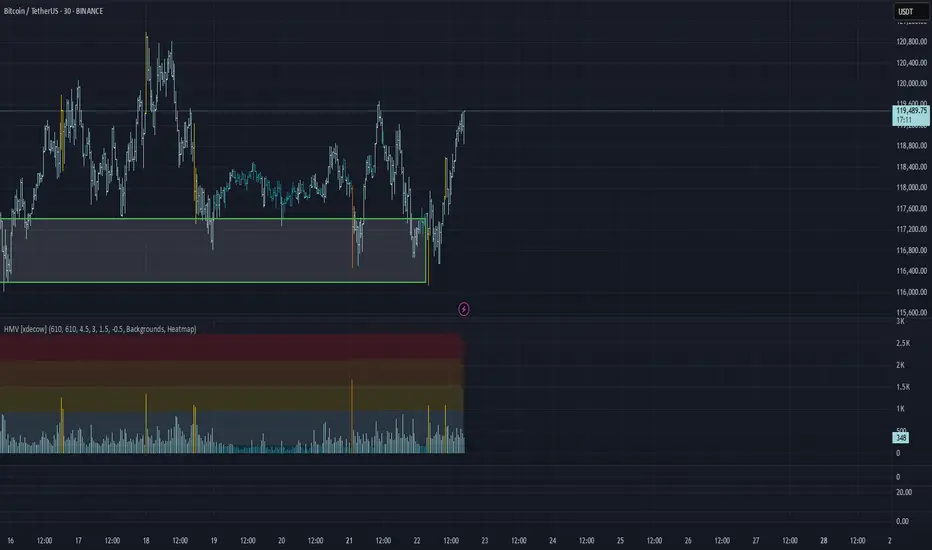
2 Possible Scalps for BITCOINThere are 2 Demand areas which have specified on the chart,
Both could be good for some scalps.
As long as price keeps 116.400 area UpTrend is on the card.
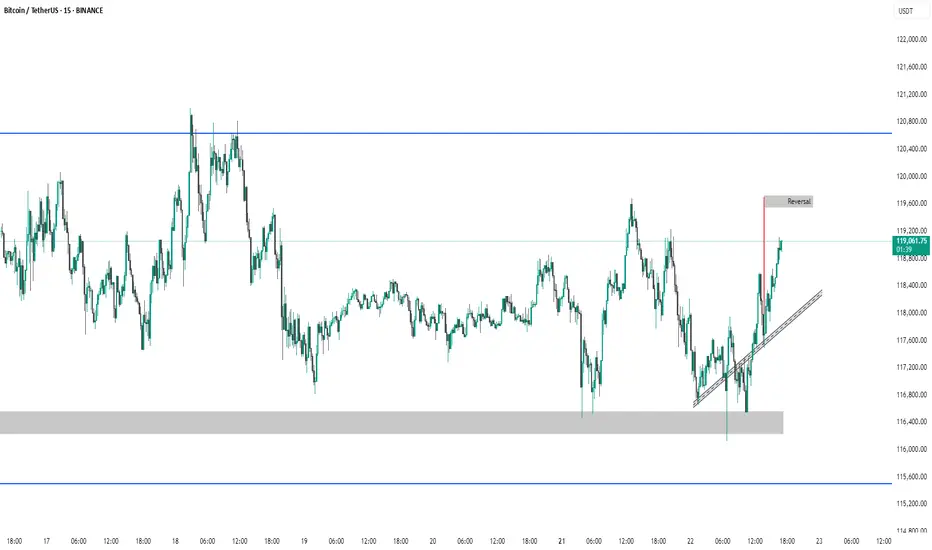
BTC #Bitcoin 15-minute BTC/USDT chart (Updated ChartThis 15-minute BTC/USDT chart (Binance) shows Bitcoin rebounding from a demand zone near 116,000–116,750 USDT and forming higher lows along a short-term ascending trendline. Price is currently around 118,446 USDT, aiming toward a marked supply zone near 119,500 USDT, suggesting a potential short-term bullish move. A rejection at this supply zone could signal a pullback, while a breakout may indicate continued upward momentum. Key support and resistance zones are clearly defined.
thanking you
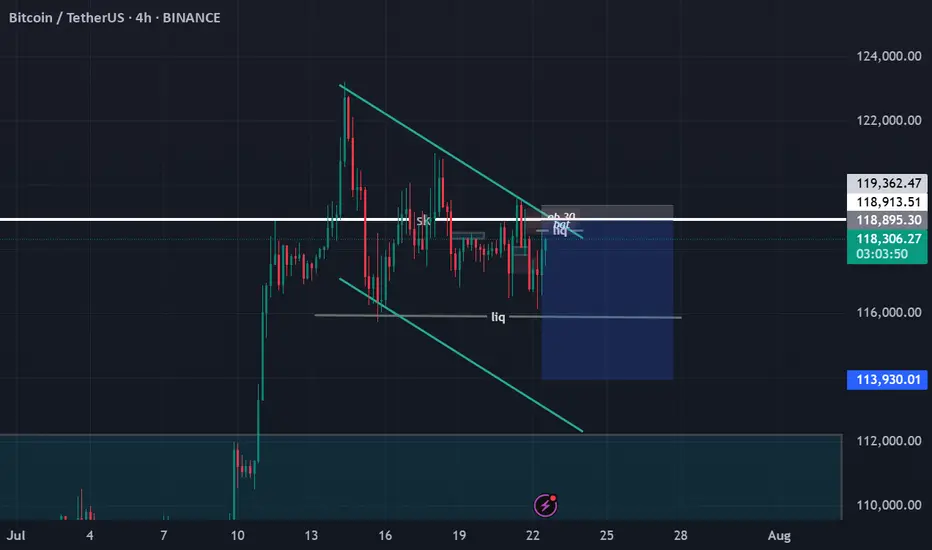
BTCUSDT IDEAAlthough Bitcoin is currently in an uptrend, it broke the bottom at 116.684, which caused the new top at 123.200. Therefore, I see that it has formed a bearish consolidation currently. Also, huge liquidity is concentrated at 115.930, so I expect it to fall to 113.849.
Bitcoin (BTC) Analysis – July 21, 2025We’ve previously discussed the significance of the $110,000 level — a zone where long-term holders typically take partial profits.
After multiple pullbacks from that region, a new wave of short-term investors stepped in around $97,000, managing to push the price as high as $123,000.
⚠️ I know many traders are tracking Bitcoin dominance and expecting a correction from this zone — and I partly agree.
However, issuing a sell signal here feels premature and potentially risky.
✅ Instead, I’d suggest looking for a re-entry opportunity around $95,000, where market structure and buyer activity may offer a much better risk-reward ratio.
Bitcoin longLong from 115k region.
Sweep 4h lows and then i think it will show some strength to the upside.
BTCUSDTAccording to previous analysis and its short-term target, Bitcoin has made a correction, and the correction areas, namely $114,000 and $112,000, were the important support areas it saw. However, considering the time, it can be said that the next Bitcoin ceiling will be reached in the period from August 18 to September 22, approximately 35 days.This is a medium-term timeframe on a weekly basis and Bitcoin is expected to reach $144,000 to $148,000 in price. Good luck and be victorious.

Shark harmonic pattern
---
### 🦈 What Is the Shark Harmonic Pattern?
- **Discovered by**: Scott Carney in 2011
- **Foundation**: Combines **Fibonacci ratios** with **Elliott Wave Theory**
- **Purpose**: Identifies potential **trend reversals** using precise geometric price structures
- **Structure**: Five points labeled **O, X, A, B, C** (not the usual XABCD)
- **Key Feature**: Relies heavily on the **88.6% Fibonacci retracement** and **113% extension**
---
### 📐 Pattern Geometry & Ratios
| Leg | Description | Fibonacci Ratio Range |
|------------|--------------------------------------------------|-------------------------------|
| XA | Initial impulse leg | No specific ratio |
| AB | Extension beyond X | 113% to 161.8% of XA |
| BC | Completion leg | 88.6% to 113% of OX |
| | | 161.8% to 224% of AB |
- **Point B** must **exceed point X**, forming an **Extreme Harmonic Impulse Wave**
- **Point C** is the **Potential Reversal Zone (PRZ)**
---
### 🛒 Buy Setup (Bullish Shark)
1. **No fixed retracement for A**
2. **B extends 113%–161.8% of XA**
3. **C completes at**:
- 88.6%–113% of OX
- 161.8%–224% of AB
📍 **Entry**: Near point C
📍 **Stop Loss**: Below point C
📍 **Target**: Retracement levels of BC (e.g., 50%, 61.8%), or back to point A/B
---
### 📉 Sell Setup (Bearish Shark)
1. **No fixed retracement for A**
2. **B extends 113%–161.8% of XA**
3. **C completes at**:
- 88.6%–113% of OX
- 161.8%–224% of AB
📍 **Entry**: Near point C
📍 **Stop Loss**: Above point C
📍 **Target**: Retracement levels of BC, or back to point A/B
---
### 📊 Real Trade Example & Educational Resources
In the comment

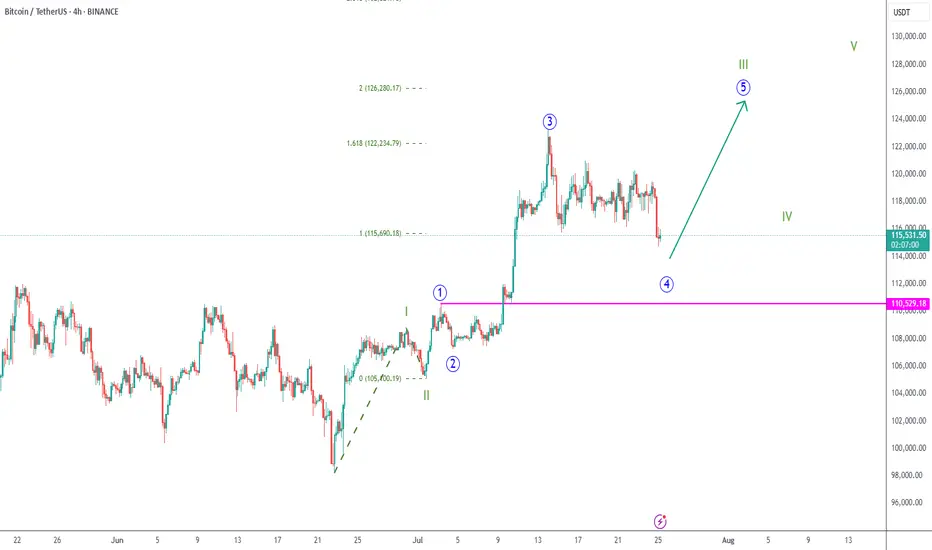
BTC 4H Chart Uptrend
➡️ My wave count considers we're now in blue wave 4, and this corrections should finish soon.
➡️ The 125k round number is an interesting target for green wave III.
➡️ This scenario is valid as long as we stay above blue 1 top (at 110.529).
BTC USDT ANALYSIS CRYPTOCAP:BTC is currently correcting after a long bull ride and knowing your entry level as a trader is very important. Look at this chart and make informed decision

BTC SHORT IDEA114500 is TP1
113 is TP2
BTC is in Price Discovery Mode...
New ATH was created recently.
500M Shorts were Liquidated at 122k Region.
All the dips are healthy.

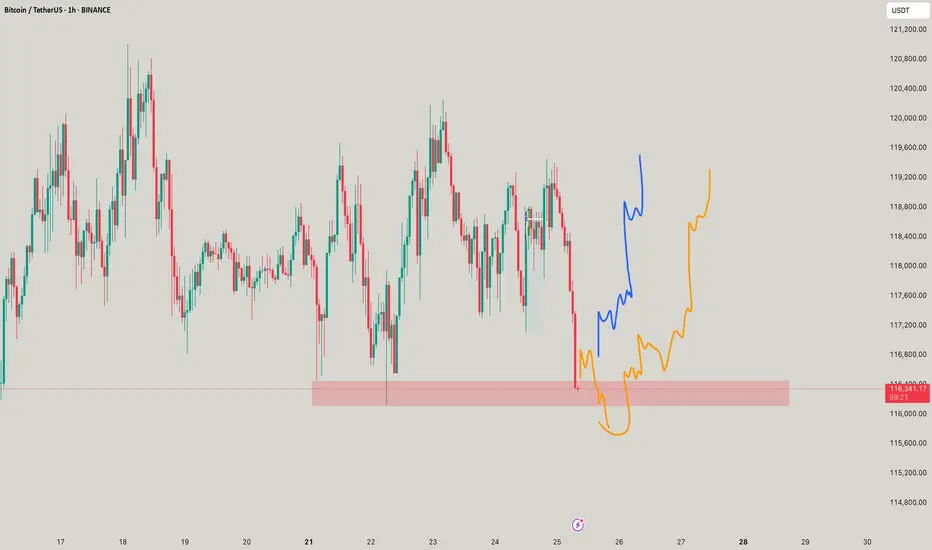
BTC - Nuke down to 104k?Hahhaa noo, but payttern shall commence in orange for a good move altogether!
Bitcoin (BTC): Liquidity Hunting + Buyside Dominance | Bullish!What a week we have had so far; it has moved this whole week so far like one big rollercoaster, but nevertheless we are still above the $116K zone so we are bullish.
While we see slight buyside dominance,, we also see huge order limits sitting at $115K,, which means we might still see some kind of "last liquidity hunting."
That being said, we are keeping an eye on $116K and $115K zones.
Swallow Academy

Trading plan for BitcoinLast week, Bitcoin established a new ATH at $123k before entering a corrective phase. The price action has since developed into a clear consolidation pattern and currently trades below the weekly pivot point.
Key Observations:
Proximity to last week's low increases probability of a full ABC correction targeting $113k
Break above noted resistance could invalidate bearish scenario and suggest ATH retest
Critical Levels:
Resistance: $119,500
Support: $113,000 (ABC target)
Trade the range until the market declares its next direction.

BTC/USDT Analysis: Rotation Continues
Hello everyone! This is a daily analysis from a trader-analyst at CryptoRobotics.
Yesterday, Bitcoin continued to rotate within a narrow sideways range, and so far, there has been no breakout. We retested the lower boundary of the range and once again saw absorption of market selling at that level.
At the moment, the scenario remains valid — we expect a breakout to the upside. Several factors support this outlook: strong defense at the lows, delta absorption across the entire range, and buyer control on the most recent local upward wave.
A less likely scenario is a dip into the lower buy zone, a liquidity grab, and another attempt to move higher.
Buy Zones:
~$115,000 (zone of initiating/pushing volumes)
$110,000–$107,000 (accumulated volumes)
This publication is not financial advice.
The 3-Step Rocket Booster Strategy Bitcoin Edition🚀 3 Key Features of Bitcoin
Decentralized Network – No central authority like a bank or government controls Bitcoin.
Limited Supply – Only 21 million bitcoins will ever exist, making it scarce and valuable.
Borderless Transactions – Send or receive money globally without needing permission or intermediaries.
✅ 3 Benefits of Using Bitcoin
Freedom from Inflation – Bitcoin resists inflation because of its fixed supply.
Fast & Low-Cost Transfers – Especially useful for international payments.
Financial Inclusion – You don’t need a bank to own or use Bitcoin—just a smartphone and internet.
⚠️ 3 Problems with Bitcoin
Price Volatility – The price can change rapidly in short timeframes.
Scams & Fraud – Many fake crypto projects use Bitcoin’s name to deceive people.
Technical Learning Curve – Beginners may find it hard to understand wallets, keys, and security.
🤔 3 Common Objections
“Bitcoin is too volatile—I might lose money!”
“It’s too complicated for me to use.”
“Governments will ban it eventually.”
💡 3 Ways to Overcome Objections
Use only what you can afford to lose. Start small and grow with knowledge and confidence.
Use beginner-friendly apps like Binance, Trust Wallet, or Paxful. These platforms make Bitcoin easier than ever.
Bitcoin is legal in most countries, and major companies are adopting it—its use is expanding, not shrinking.
🛒 Take Action Now!
Don’t wait for the price to explode again. Learn, test with small amounts, and start your Bitcoin journey today.
👉 Buy Bitcoin now and take control of your financial future!
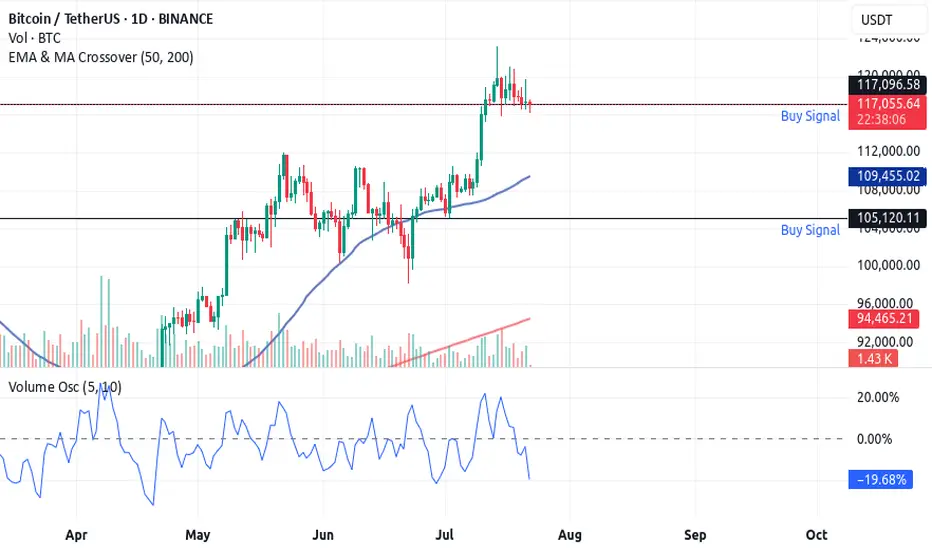
🚀 The 3-Step Rocket Booster Strategy
🔍 Step 1: Price Above the 50 EMA
What it means: The price is trending upward in the short-to-medium term.
Why it matters: This shows strength and upward momentum—price is above its recent average.
🔍 Step 2: Price Above the 200 EMA
What it means: The long-term trend is also bullish.
Why it matters: This confirms that the overall market direction is up, reducing the risk of fakeouts.
🔍 Step 3: Volume Oscillator Surge (Volume "Booster")
What it means: There is a spike in volume (measured using a volume oscillator).
Why it matters: Volume confirms that big players are involved. Price moves backed by high volume are more reliable and likely to continue.
✅ Optional Extra Filter: Check if the price has gapped up or if there's a bullish candlestick pattern (e.g. Marubozu, Engulfing, Morning Star) to increase confidence.
Rocket boost this content to learn more.
Disclaimer:Trading is risky please use a simulation trading account before you trade with real money.Also learn risk management and profit taking strategies.
EP 01: BTC correction near completionAfter the impulse to last ATH we got a 3 wave correction, last wave being formed by 5 waves, so all together coming to completion. We should visit the liquidation area under last low and swipe that liquidity and aim closer to last ATH if not exceeding it. When the market gives us more information we will go for episode 02.
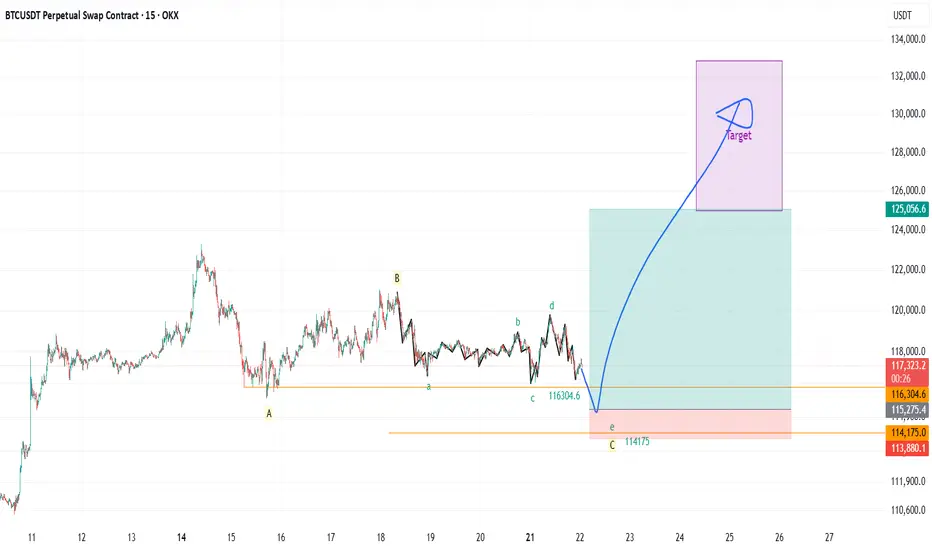
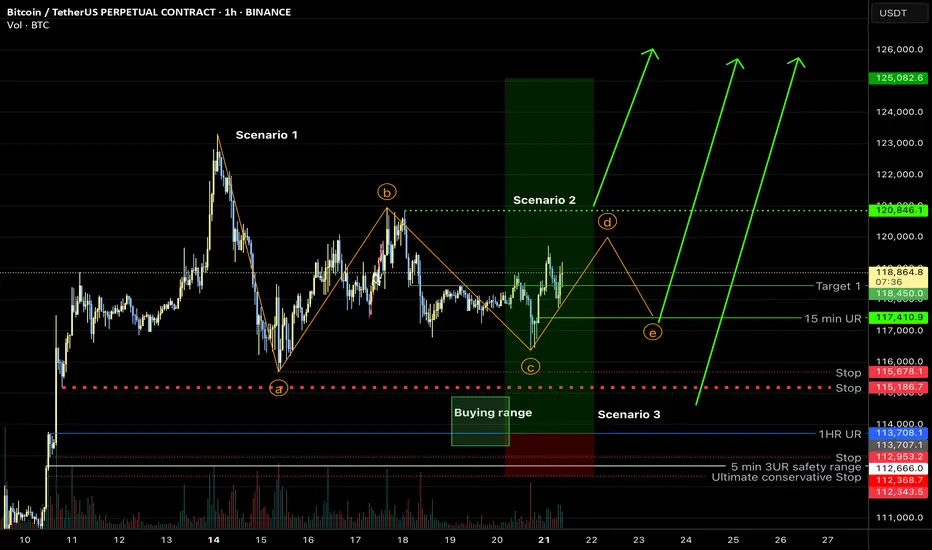
Bitcoin overall: sideways range, new ATH soonMy previous hypothesis of a sharp correction (scenario 3) looks to be incorrect. I believe the most likely corrective structure is a contracting triangle at this point (scenario 1), and the last leg should be bought for new ATH, however, it is also possible we had the last major low for this correction and new ATH are imminent (scenario 2)—which will be on the table if the indicated line gets taken out. In any case, new ATH should occur shortly!
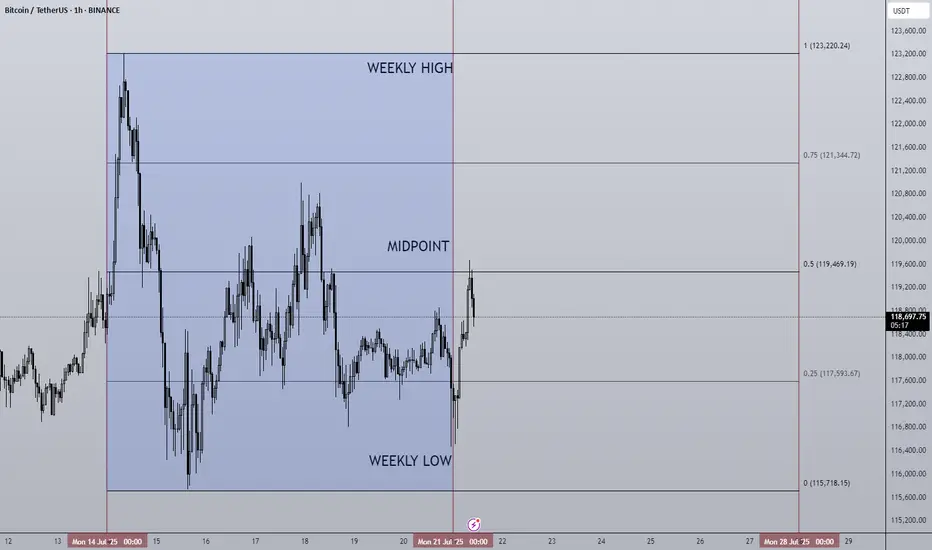
21/07/25 Weekly OutlookLast weeks high: $123,220.24
Last weeks low: $115,718.15
Midpoint: $119,469.19
New BTC ($123,220) & SPX ($6,315) ATH last week! We're really seeing progress being made on all fronts now, bitcoin saw its sixth week of net inflows into BTC ETFs ($2.39B).
The week began strong hitting the new ATH very early and then settled into a tight range to cool off. Altcoins however surged in relation to BTC to break out of HTF downtrends and begin to make up lost ground. One of the beneficiary's of this price movement has been ETH, breaking out from a multi year downtrend against BTC and hitting $3,800 in its USD pair.
For this week I do expect much of the same for BTC as momentum is with altcoins for now. However, as those altcoins reach HTF resistance levels it becomes very important for Bitcoins chop to be accumulation for the next leg up and not distribution for the way down. With so few pullbacks the threat of a sudden correction is present but the probability drops should BTC look to press higher with strong demand.
The ECB Interest rate decision takes place on Thursday but no changes to the 2.15% rate is forecast. In terms of news there are no planned upsets that I can see.
Good luck this week everybody!

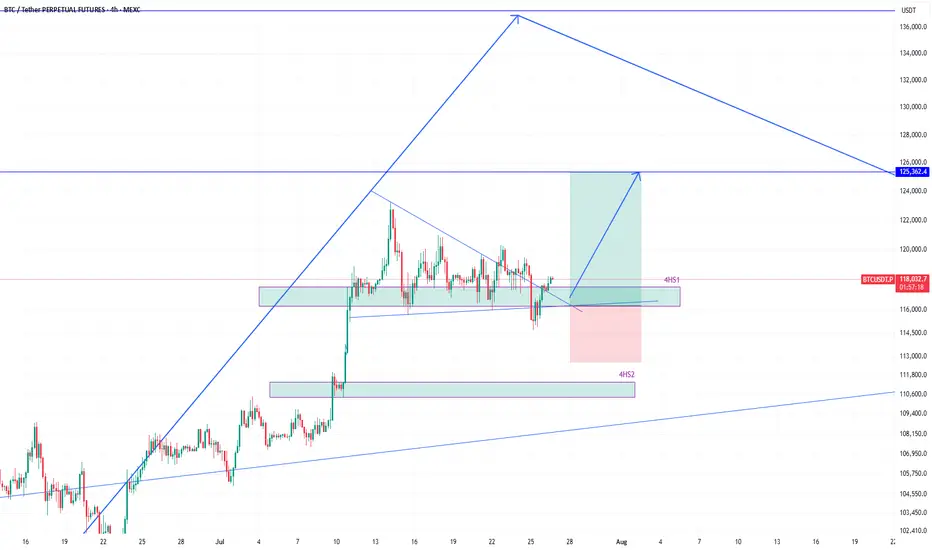
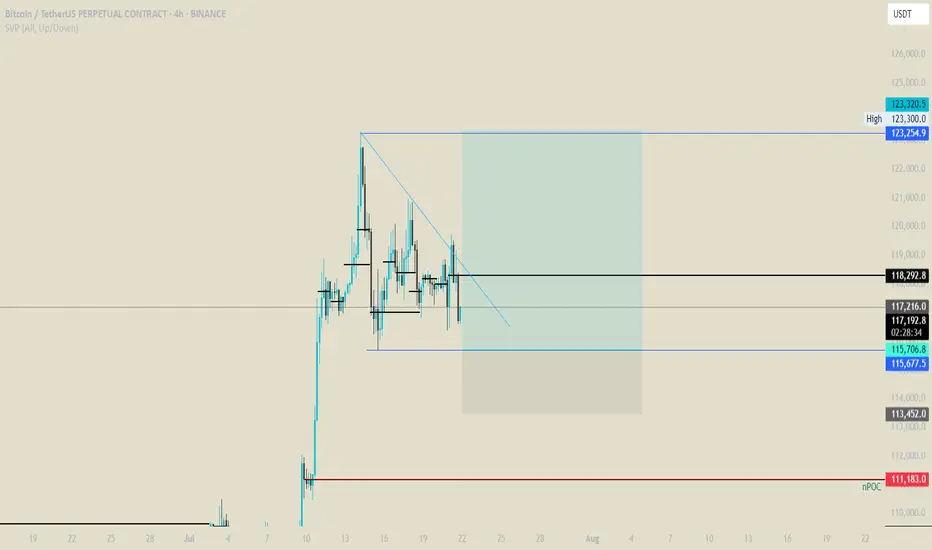
BTCUSDT eyeing 125k next after bounce from 116k zoneEarlier I shared the high time frame view of #BTCUSDT. We know that its heading higher and that helps in holding spot positions.
However, the move to the high frame target will not happen in a straight line, instead with various push to the upside and then subsequent corrections to the down side.
Therefore, as a trader, we must profit from those movements as we see some good high probability setups.
And there is one right now which is a long position.
The price broke 4h support 4HS1, but quickly reclaimed it. That is a sign of demand and strength required to move higher.
Therefore, this presents a long opportunity where the target of this long position should be 125k.
As the price enters into 4HS1 zone, I will scale into long position.
It is quite likely that the price will bounce hard once it taps into 4HS1 zone.
I am talking this long position targeting 125k. What about you? Share with me what you think.