BTC Buy / Long SetupWait for the entry till London Session, and Hold the trade, Must use SL with proper risk management.
BTCUSDT trade ideas

BITCOIN TRADING IS 100% PROBABILITY,ANY KEY LEVEL IN THIS CHART CAN FAIL,pls manage your risk and build a strong mindset.
bitcoin is showing a bullish drive. If i retest the 123k level again and gets rejected we are selling down ,the structure has given us a clue on 135k and above possible upswing on sentiment ,this level represents the ascending trendline and a supply roof.
#btc #bitcoin #crypto #eth #sol

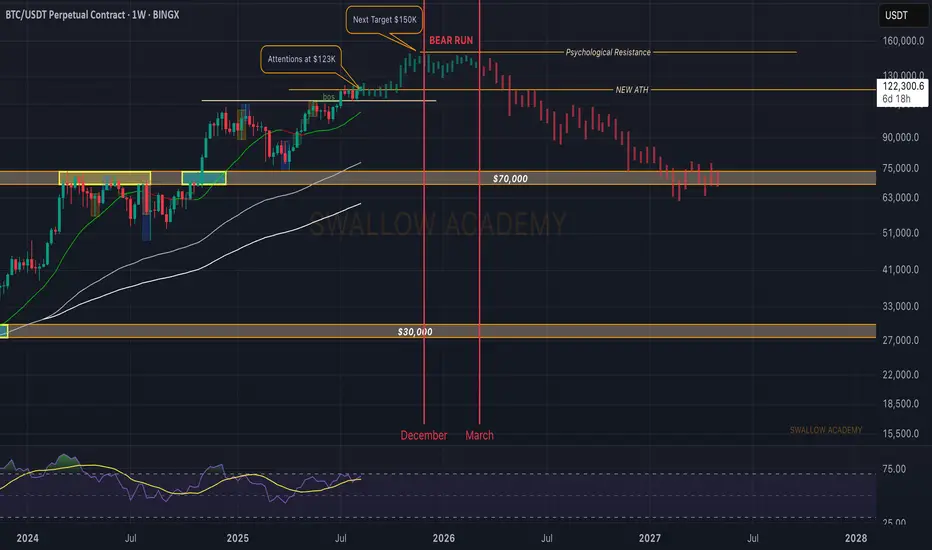
Bitcoin (BTC): Approaching ATH | Marking Potential Cycle TopBitcoin on the weekly timeframe is showing a strong start to the week, where the price is looking for a potential breakout, which then could result in yet another ALL-TIME-HIGH.
Now markets have been very volatile lately, so being close to ATH makes the situation pretty dangerous, so for better opportunities to trade, wait for that proper breakout (which most likely will be an aggressive one).
Now as we approach the end of 2026, we are also thinking that the bull cycle is in the ending phase and 2026 should mark itself as the start of a bear market, so let's get ready and prepare ourselves for it.
We still have time before that so alts still have their chance!
Swallow Academy
Bitcoin Go 140kBit is moving towards liquidating sellers and there is generally high liquidity.
Pls careful
Liquidity zone 130,000 __144000
⚠️⚠️⚠️⚠️⚠️⚠️☠️☠️☠️

BTC 4H Ascending Support Break, Can Momentum Push Higher?BTC broke its prior downtrend and is now riding an ascending support line. Price remains above the 200 EMA and has reclaimed a key support zone. MACD histogram has flipped positive, showing building bullish momentum. A sustained hold above the trendline could open the path toward higher levels, but a break back below support would weaken the structure. Monitoring reaction near $118.5K for confirmation.

btc signalThe analysis went well, but put the breakeven and would you like me to put more signals? I would be happy to hear your comments.Two signals and two profits. Thank you for your attention.

Bitcoin inverted HEAD & SHOULDERSIf this is an inverted HEAD & shoulders pattern for bitcoin, then the neckline is already broken and bitcoin is Back testing that now, well the target is $160k as well

Why I'm bullish on Bitcoin!While everyone starts questioning if its over for Bitcoin, I'm bullish
Inverse head and shoulder going into 2 bull flags so far. Target is 149k'ish.
Unless I see some movements that cancel out these patterns I'm forever bullish.
Support on 112k is important to stay above if we break below and close below forget about this idea.

Short Probably!Hello all. before all I wanna tell you that I am not a crypto trader and it is unknown market to me but if it works as Forex market, market will go down from here. be happy(wink)

I just got filled for a long hereAs an alert I just got filled with a small limit order long and intend to add to it within this range with more frequency in the bottom half with (again) very small orders as I want to average down my entry price before we ideally pump up next if it works out that way. And if not (so in the case we gradually keep grinding down in price) I can continue to add longs until we get a bounce which may provide the opportunity to get out at break even or a small profit. But I am happy with the value of the areas I have focused on and not chasing pumps. Enjoy!

Possible run to 130 in the cardsEasily invalidated.
We are using the patterns from the price action post threshold break (redline in bottom pane)
These breaks are unseen on this time frame
The volume instabilities are between the 15 minute and the 1 hour. I would look for breaks under 15 minutes, too much noise at that level. Go ahead and test it yourself. See my script posted on trading view for details.

Using PAR looking at Daily than lower time framesUsing PAR looking at Daily than lower time frames to find the best entry.

BTC ~ will it make new lows!?Ideally its following the pattern i drew, and latter after NY session, it would claim the lows ideally after the buying activity I am antiiipating now!

04/08/25 Weekly OutlookLast weeks high: $119,809.82
Last weeks low: $111,917.76
Midpoint: $115,863.79
First net outflow for BTC in seven weeks (-$643m) following the FOMC data release and also month end. Yet again no change by the FED but the chances of Septembers FOMC giving us a rate cut has drastically increased, currently at a 78.5% chance of a 25Bps cut.
Month end usually gives us a pullback/sell-off as larger institutions window dress which often includes de-risking somewhat. We saw this last Thursday combined with the weekends typical lower volume has resulted in quite a significant correction for BTC. Altcoins have down the same as many assets reject from HTF resistance areas, the correction has been on the cards and isn't too worrying on the face of it.
What I would say is August seasonality is generally not a bullish month and so expecting price to rebound and extend the rally would go against historical trends. I could see more of a ranging environment taking place for several weeks before any next leg up is possible.
This week I would like to see where altcoins find support and establish a trading range where some rotational setups tend to present themselves.

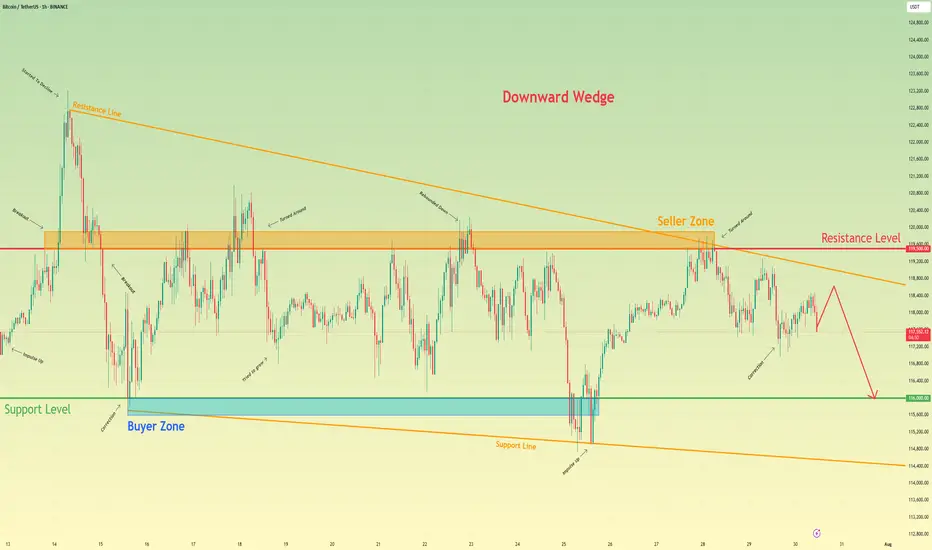
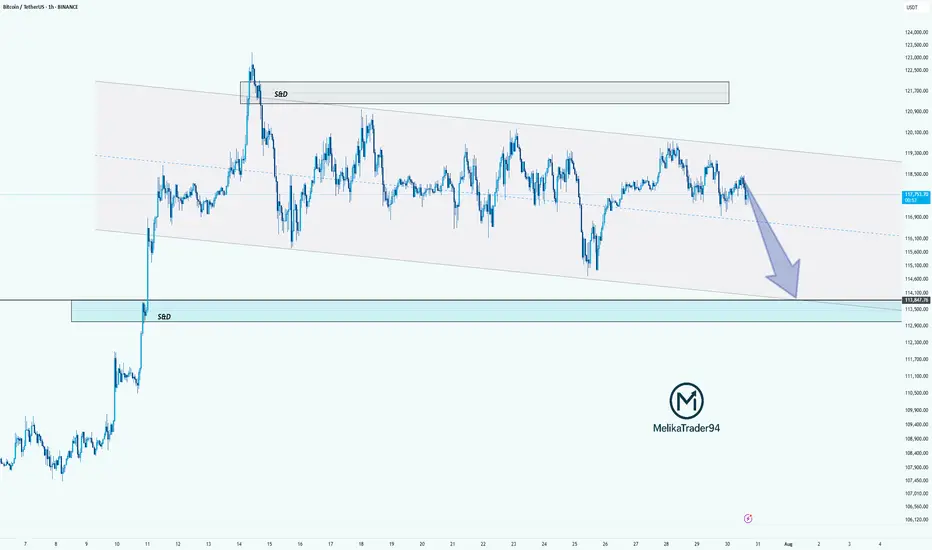
Bitcoin will continue to decline to support levelHello traders, I want share with you my opinion about Bitcoin. Following a period of a broad downward trend, bitcoin's price action has been channeled into a large downward wedge, a pattern that signifies converging volatility and a period of consolidation before an eventual decisive move. This market action is taking place between two critical, well-established zones: a major seller zone capping rallies around the 119500 resistance level and a significant buyer zone providing support near 116000. Recently, an upward rebound attempted to test the upper boundary of this wedge but was met with strong selling pressure from the seller zone, confirming its validity as a formidable barrier. The price is now correcting downwards after this rejection. The primary working hypothesis is a short scenario, anticipating that the bearish momentum from this recent failure will continue to drive the price lower. While a minor bounce or retest of local resistance is possible, the path of least resistance within the pattern's structure is now towards its lower boundary. Therefore, the TP is strategically set at the 116000 level. Please share this idea with your friends and click Boost 🚀
Disclaimer: As part of ThinkMarkets’ Influencer Program, I am sponsored to share and publish their charts in my analysis.
Bitcoin & strong supportBitcoin is holding above 50MA and 61% of Fibonacci, it also has bullish divergence on RSI with bullish engulfing candle. upside movement is coming soon
BTC: in a new drop?!Hello guys!
btc is running in a descending channel!
However, the upper level is broken up, but it could reach the upper level after a drop here!
I am not sure about this analysis!
What do you think about it?
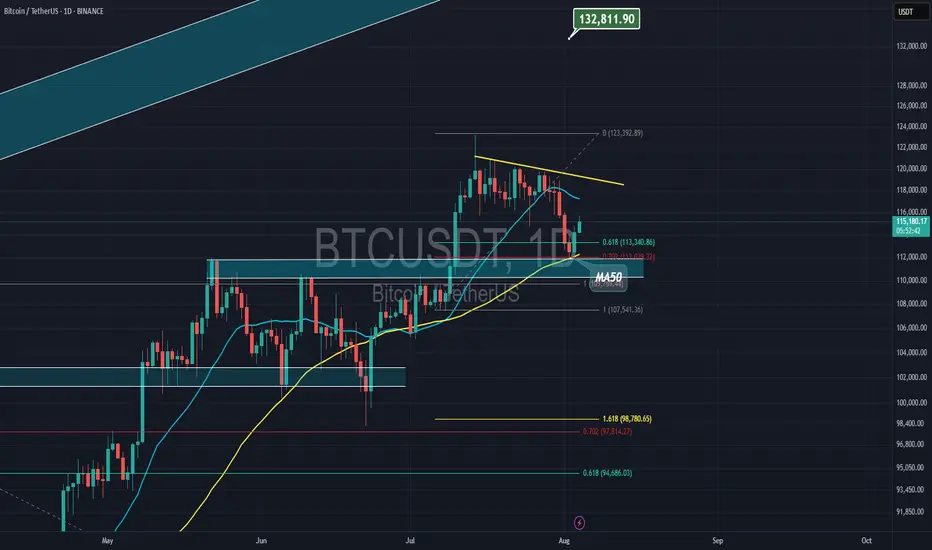
BTC Next Move Toward $150K?Bitcoin recently broke out above a long-standing resistance zone ($110K–$115K), supported by a clean move through the volume profile high node. After testing local highs, BTC is now pulling back to retest the breakout area, a critical level that could act as new support.
Key Points:
Breakout Retest: Price has pulled back into the breakout zone around $114K, aligning with strong previous resistance that may now flip to support.
Volume Profile: A strong high-volume node is visible below ($105K–$110K), which reinforces this area as a major demand zone.
EMA Confluence: The 50-day and 100-day EMAs are trending upward and aligning near the retest area, providing additional support.
If this level holds, BTC could resume its bullish leg toward the $150K level.
Cheers
Hexa


BTC | Bitcoin - Weekly Recap & Gameplan - 03/08/25📈 Market Context:
Traders are currently anticipating a potential 0.25% rate cut at the September FOMC meeting, which continues to support the broader bullish outlook.
While the market pulled back following weaker-than-expected Non-Farm Payroll data, overall sentiment remains optimistic.
Greed has cooled off into a more neutral stance. Historically, August often brings some consolidation or pullbacks — but the structural bias for Bitcoin remains bullish.
🧾 Weekly Recap:
• After printing new all-time highs, BTC began a healthy retracement.
• Price action closely mirrored the Nasdaq's (NQ) pullback during the week.
• We saw a small bounce mid-week, but no strong reversal confirmation yet.
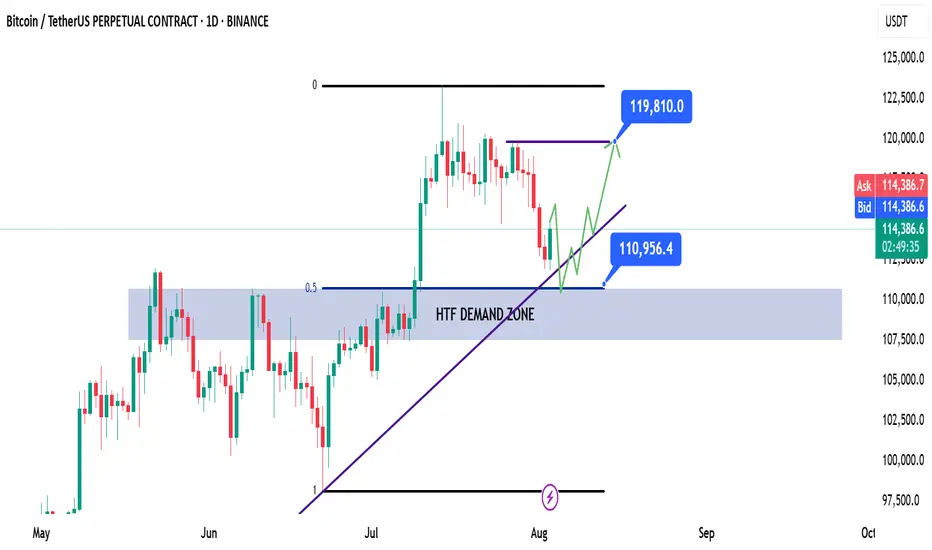
📌 Technical Outlook & Game Plan:
→ I’m watching for price to revisit the long-term bullish trendline.
→ A slight deviation into the HTF demand zone would be ideal for long entries.
→ Bonus confluence: This area also aligns with the 0.5 Fibonacci retracement (Equilibrium level), providing a key discount zone.
🎯 Setup Trigger:
I’ll be watching for a confirmed bullish break of structure (BOS) on the 1H–4H timeframes to signal a reversal.
On confirmation, I’ll look to enter a swing long position.
📋 Trade Management:
• Stoploss: Below the 1H–4H demand swing low
• Take Profit:
→ I’ll trail stops and lock in profits aggressively
→ Main target: $119,820
💬 Like, follow, and comment if this breakdown supports your trading! More setups and market insights coming soon — stay connected!
Is Bitcoin Pulling Back to the 100,000 Area?If we consider the $124,000 level as Bitcoin's high, Bitcoin should correct to the 0.5 Fibonacci level. Write your comment.

Is it time to buy BITCOIN now?My previous analysis of reaching $112,000 was correct and now Bitcoin is around $113,000. Is it time to buy now? The answer is no because the price has not yet stabilized and other news may push the price below 112,000. Also, the NEW RSI indicator has not yet crossed its moving average.

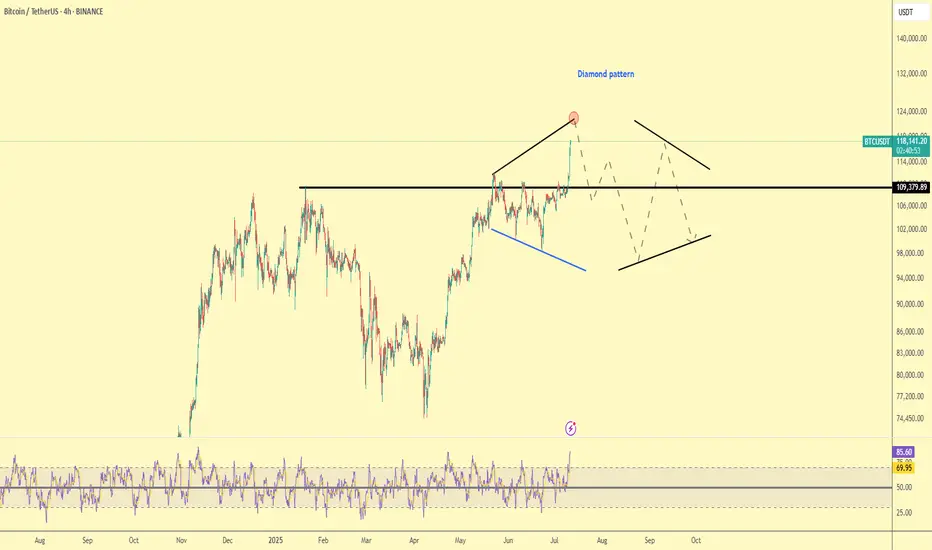
BTC TRADE PLAN 11/07/2025 - Diamond PatternDear traders,
Technical Analysis of BTCUSDT (Bitcoin/USDT) – July 11, 2025
🕐 Timeframe: 4H
Price has broken above the major resistance at $110,000 and is now trading around $118,000, forming a Diamond Top pattern — a classic reversal formation that may signal an upcoming downtrend or correction.
🔻 Key Highlights:
Major Resistance: $118,000 – current top and potential reversal point.
Key Support: $110,000 – if broken, next targets may lie around $95,000–$100,000.
Diamond Pattern: Typically a bearish reversal signal after a strong uptrend.
RSI Indicator: Currently in overbought territory (above 85), suggesting buyer exhaustion.
📉 Possible Scenario:
Price may reverse from $118,000 -120,000 and test the $110,000 support. A break below that could lead to a deeper correction in the coming weeks.
Regards,
Alireza!