BTC_TRADING IDEA 08/01/25So we had a nice retracement. I’m now patiently waiting in a discount zone, aiming for a MTF LQ.
I have plenty of reasons to wait here:
– FVG
– OB
– OTE
If it doesn’t play out, I’ll look for another PD Array.
Let’s see!
BTCUSDT trade ideas

BTC New Upodate (4H)This analysis is an update of the analysis you see in the "Related publications" section
We previously stated that Bitcoin lacks the strength to move upward, and we expect the price to soon reach the green zone (114K-112K).
The price is now dropping toward this zone, which is the rebuy area.
The process of reaching the green zone has been and still is somewhat time-consuming, and during this time, it may repeatedly mislead beginners.
For risk management, please don't forget stop loss and capital management
Comment if you have any questions
Thank You

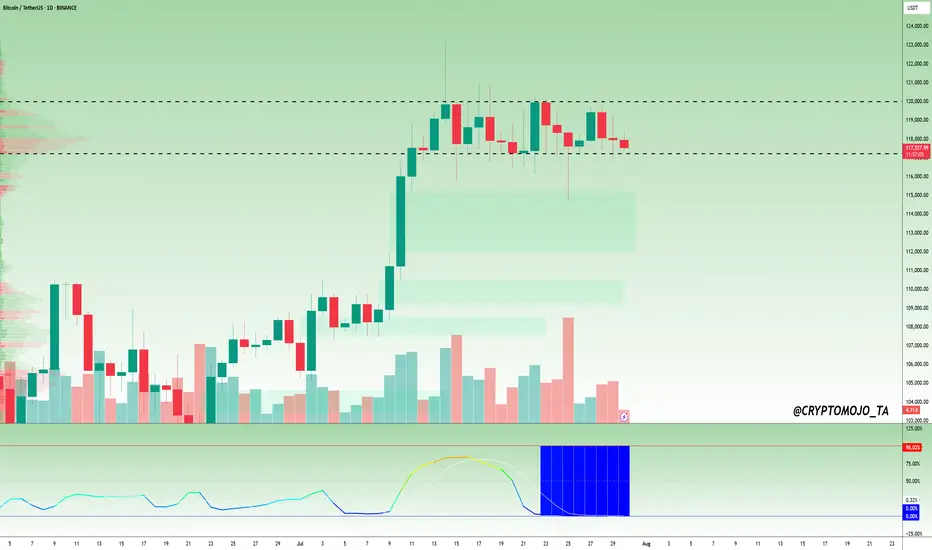
$BTC Daily Timeframe Update! #Bitcoin ( CRYPTOCAP:BTC ) is still moving sideways, consolidating in a tight range between ~$117,400 and $120,100, just below recent local highs. The market is showing clear signs of compression, and the BBWP (Bandwidth Width Percentile) is flashing a deep blue near 0%, which signals extremely low volatility.
Historically, this kind of BBWP reading comes before big price moves. However, the direction is still uncertain as BTC trades between key resistance and minor support.
Key Levels to Watch:
Resistance: ~$120,100
Support: ~$117,400
BBWP: ~0% tight volatility coil
If BTC breaks above $120K, it could lead to strong upside continuation. But if it drops below $117.4K, we might see a deeper correction.
📌 Tip: Wait for volume and BBWP expansion to confirm the next move. The spring is tightly wound, a big breakout is likely coming soon.
DYOR, NFA
BTCUSD : Long levelHere is a great entry point for those who scalp this instrument or pips. The level is marked with a green arrow. It will be active until I report. It may become inactive over time.
Watch out for trading on the news.

$BTCXAG - BITCOIN TO SILVER - BULLMARKET IS NOT OVER!I bet you haven't seen this chart anywhere! The Bitcoin to Silver chart is preparing for another explosion!
And yes, BULLMARKET IS NOT OVER!

White House Crypto Report Incoming: Will BTC Pump from Support? One of the important news for Bitcoin ( BINANCE:BTCUSDT ) that was released today was that " White House confirms first Bitcoin and crypto report will be released TOMORROW ". Bitcoin is likely to rise with the release of the White House report .
What do you think? At least a temporary pump may be in store for Bitcoin.
Bitcoin fell to the Support zone($116,900-$115,730) and filled the New CME Gap( $119,500-$118,295) as I expected in the previous idea .
Bitcoin is currently moving near the Support zone($116,900-$115,730) , Cumulative Long Liquidation Leverage($116,828-$115,710) and Potential Reversal Zone(PRZ) .
I expect Bitcoin to rise from the Support zone($116,900-$115,730) to at least $118,680(First Taregt) .
Second target: Upper line of the descending channel
Note: Stop Loss: $114,680 = Worst Stop Loss(SL)
CME Gap: $115,060-$114,947
Cumulative Short Liquidation Leverage: $118,827-$118,298
Cumulative Short Liquidation Leverage: $120,144-$119,200
Please respect each other's ideas and express them politely if you agree or disagree.
Bitcoin Analyze (BTCUSDT), 1-hour time frame.
Be sure to follow the updated ideas.
Do not forget to put a Stop loss for your positions (For every position you want to open).
Please follow your strategy and updates; this is just my Idea, and I will gladly see your ideas in this post.
Please do not forget the ✅' like '✅ button 🙏😊 & Share it with your friends; thanks, and Trade safe.

Bitcoin:Can Support at Point of Control Fuel a Move to New High?Bitcoin is currently consolidating at its local point of control, facing immediate resistance from a Fibonacci-aligned value area low. A critical reversal from here could pave the way to new all-time highs.
Bitcoin has entered a pivotal phase, trading at a key technical region that could determine its short-term direction. Over the past week, price action has hovered around the local point of control, showing signs of absorption and consolidation. With immediate resistance looming at a major confluence level, the next few daily candles may set the stage for either a breakout or a deeper retracement.
Key Technical Points:
- Local Point of Control: Bitcoin is ranging around this level, showing indecision
- Value Area Low + 0.618 Fib: Immediate resistance forms strong technical confluence
- Swing Low Critical: A break below the last swing low would invalidate bullish structure
Bitcoin’s current position around the local point of control reflects a phase of market equilibrium. This level represents the area of highest traded volume over the recent range, acting as both support and resistance at different times. The fact that price has revisited and hovered here for multiple days suggests active positioning from both bulls and bears.
Just above lies the value area low, which is in direct confluence with the 0.618 Fibonacci retracement from the recent swing high to swing low. This dual-layered resistance is significant — if Bitcoin is able to break above and reclaim this zone, it could unlock the next leg higher.
However, traders must remain cautious. The most recent swing low, formed during the last pullback, now acts as the final line of defense for bulls. A loss of this low would shift market structure to bearish and potentially initiate a correction deeper into the prior range.
So far, the lack of high-volume breakdowns suggests sellers have not yet gained control. But without a decisive bounce and follow-through above resistance, the risk of a failed reversal increases.
What to Expect in the Coming Price Action:
If Bitcoin holds above the point of control and mounts a successful challenge of the value area low, a rotation toward a new all-time high becomes increasingly likely. However, failure to defend the swing low would invalidate the setup and favor further downside. All eyes remain on the current consolidation for clues on the next major move.
BTCUSDT.PThe best area to buy MARKETSCOM:BITCOIN is $119,000 and wait for the pullback to be complete.
But for selling and shorting, be sure to wait for $115,000 to break down.
⚠️Please control risk managements.

127-128k incoming ( altcoins round ? )Hi, Bitcoin seems to have completed its short term Elliott wave 4 correction and the price action analysis also confirms that this time Bitcoin will be able to break the 120-119 resistance, I predict Bitcoin to make a new high around 127-128. Altcoins have not grown that much yet and if the price can make a reliable consolidation above 120k, altcoins will start to rise.

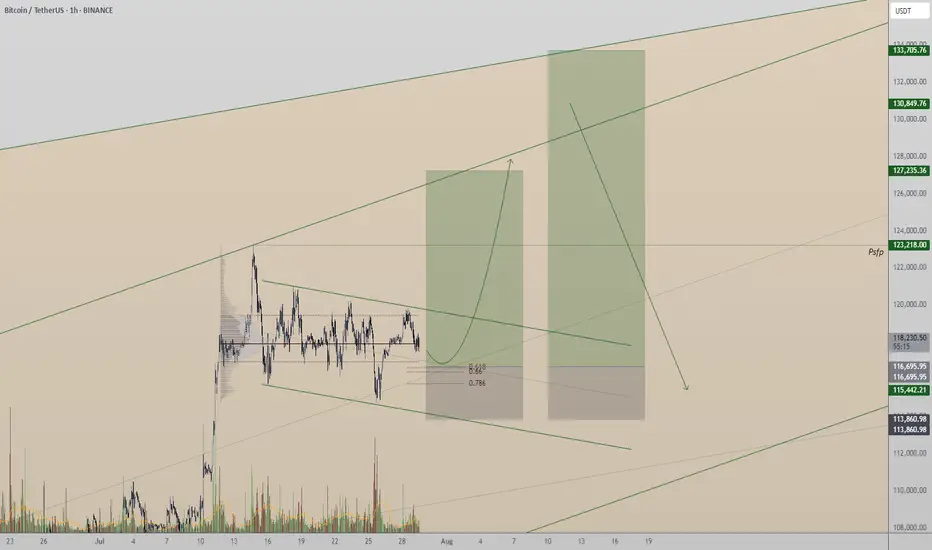
Bitcoin Price Outlook: Bull Flag Pattern Hints at Potential BreaBTC price Outlook: Bull Flag Pattern Hints at Potential Breakout Toward $129K
The local format of the corridor is interrupted by a wide, stronger one, based on which one can conclude about a rebound, and it is quite possible that this will happen tomorrow, during the opening of markets and trading
Also on the local BTC chart, this figure forms an incompletely formed "Bullish Flag" pattern, which also indicates growth
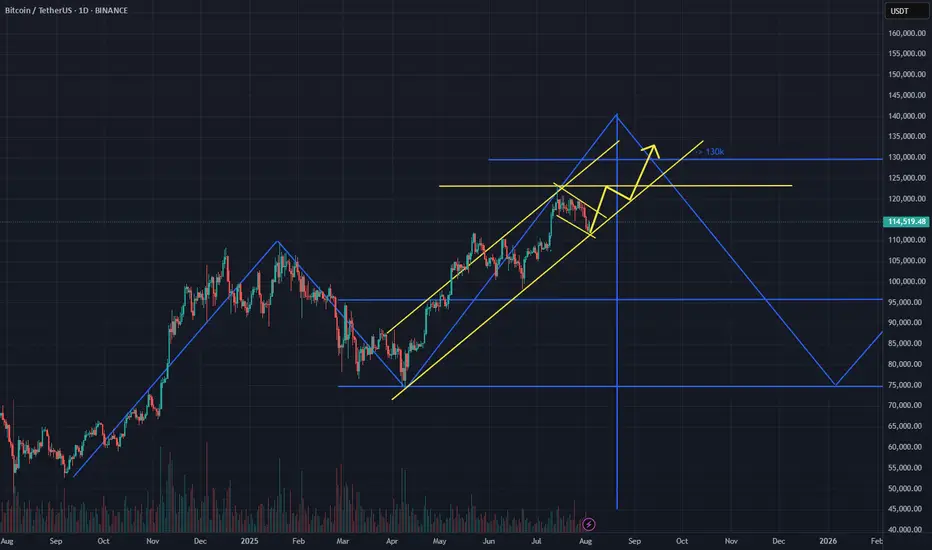
Also, this scenario does not contradict my previous analysis, where a global "Head and Shoulders" pattern is emerging on a 5-year time frame
Current price: $114.227
Expected according to the local scenario $123k and the price according to the global "Head and Shoulders" pattern remains within the same limits of $124k or $129k
Low probability of breaking through the $112k level, since this mark is the bottom of the ascending corridor
This analysis is based on the technical pattern and also incorporates AI to provide more accurate results.
BTC Long Setup (Post-Liquidation Reclaim)Hey Candle Fam,
The weak hands just got flushed harder than a memecoin rug—perfect. While retail panicked on the dip, smart money was quietly filling bags near $114k. Now it’s our turn to strike with precision.
🔥 BTC Long Setup (Post-Liquidation Reclaim)
🎯 Entry: $114,390–$113,800
🛡️ Stop Loss: $111,900
💰 Targets: $121k / $130k / $140k
📊 Strategy: Liquidity Grab + Weekly Demand Tap
– HTF bias: Still bullish, above key $115k zone
– LTF confluence: Sweep of lows + CHoCH forming on 12H/1H
– Footprint data: Volume absorption + delta flip confirm buyer interest
⚠️ Caution:
Breakdown below $110k would invalidate this setup and likely trigger a strong bearish leg. This is not a “to the moon” YOLO.
Stick to your system, manage risk, and remove emotion.
🧠 Final Note:
We don’t chase dreams—we execute plans.
All the hours we spend studying this game? It’s not for fun. It’s for freedom.
Financial independence is the goal—this is the craft.
Candle Craft | Signal. Structure. Execution.

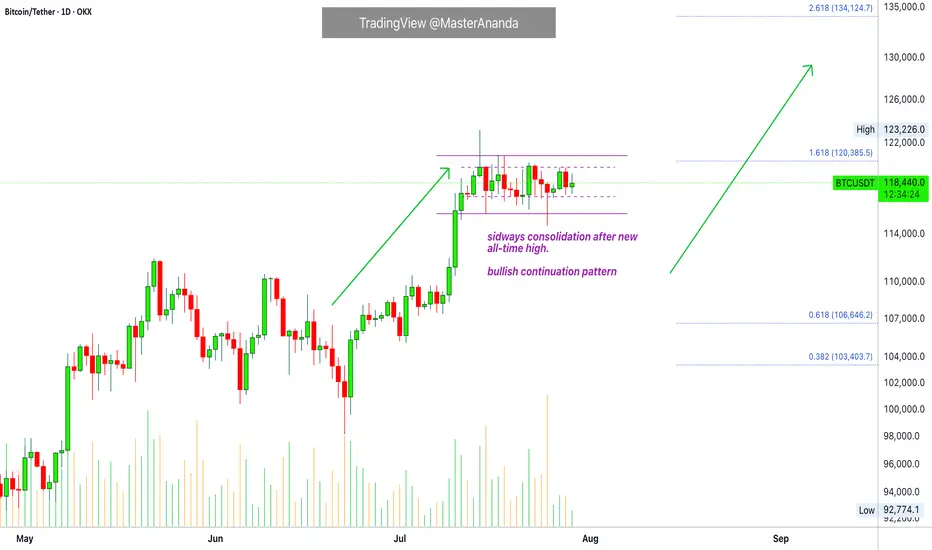
Bitcoin & The Altcoins —Name Your AltcoinBitcoin is sideways right now and is moving in a very tight and narrow range. All the action has been happening between $117,000 and $120,000 based on candle close since 11-July. This is bullish, think about it.
Bitcoin hits a new all-time high and next thing you know it turns sideways very close to resistance. The only drop was short-lived and everything sold was quickly bought. Why is Bitcoin consolidating so close to resistance? It is preparing to move ahead.
What happens when Bitcoin moves forward after so much recovery? Everything experiences a positive cycle. This is a very strong signal.
This chart allows for more whipsaw as you know nothing else is possible in a trading range. We predict the pattern to resolve bullish, but there can be swings to either side. A swing down just as it happened 25-July. A swing up just as it happened 14-July. This is always possible but the end result won't change. Bitcoin will continue sideways but when the sideways period is over, you will not see a move toward $110,000 or $100,000. The break of the trading range will confirm the advance toward $135,000 next month. Bitcoin is likely to continue in the same mode. While Bitcoin consolidates the new advance, the altcoins grow. In this way the entire market continues to recover and grow month after month after month.
Name Your Altcoin
Leave a comment with your favorite altcoin trading pair and I will do an analysis for you. I will reply in the comments section. Make sure to include any questions you might have beforehand.
If you see a comment with a pair you like, boost and reply so these can be done first.
Thanks a lot for your continued support.
Namaste.
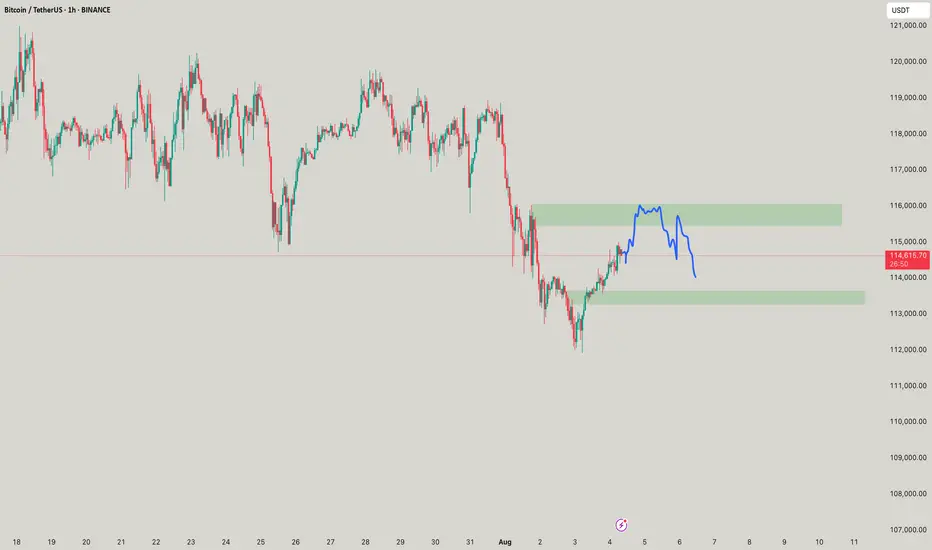
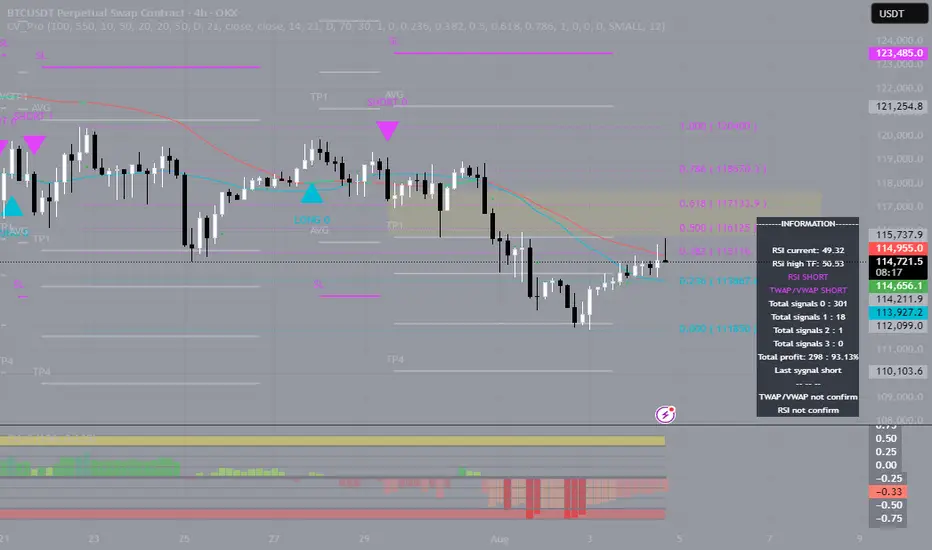
Bitcoin Turned Down — It Was Only a Matter of TimeBitcoin Turned Down — It Was Only a Matter of Time
When the price gets stuck at the top and can’t move higher, it’s always a reason to stop and think. BTC got stuck around $118,000, started to form long upper wicks, and the volume started to decline. All of this pointed to a classic case of fading bullish momentum.
At this point, my indicator gave several key signals: weakening buying power, a change in momentum, and the formation of a potential reversal zone. I refrained from opening long positions — and this decision turned out to be the right one. The price went down and is now trading around $114,000.
Next, I will wait for a retest of the imbalance zone and work from the reaction from this zone.
It is important to understand: this correction is not something unusual. This is a technically sound phase after a strong rally. The market gets rid of speculative positions, gets rid of excessive leverage and prepares for either a reset or a deeper correction.
The market has weakened predictably, and that's actually a good thing. When the structure becomes clear, we can trade with a plan rather than just following our gut instinct.
TradeCityPro | Bitcoin Daily Analysis #139Welcome to TradeCity Pro!
Let's go over Bitcoin's analysis. Today, Bitcoin is showing some signs regarding its next move, and today could be a critical day — especially considering that U.S. interest rate data is set to be released tomorrow.
4-Hour Timeframe
Today, there’s no need to switch to other timeframes — this 4-hour chart tells us everything.
Yesterday, the price was moving toward the 120041 area, which we intended to use as a long trigger, but that didn’t happen. The price failed to stabilize above this level, and RSI was rejected from the 61.67 zone.
Currently, the price has formed a lower high compared to 120041 and is now moving toward the support area around 116000.
Selling volume has significantly increased, which is not good for the bullish trend. If this support level breaks, deeper corrections to the 0.618 or even 0.786 Fibonacci levels could occur.
I’ll take profit on my long position that I opened from below 110000 if the price stabilizes below this zone, but I absolutely won’t open any short positions for now.
In my opinion, as long as the price is above 110000, any drop or correction is simply a better entry point for a long position. However, we shouldn’t buy during a falling market — we must wait for our triggers to activate.

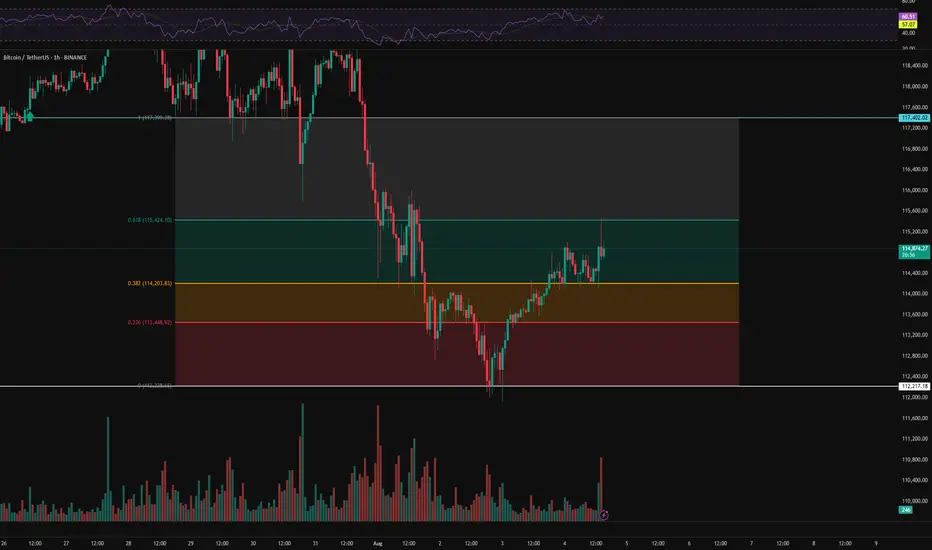
BTC Hourly Analysis – Day 1 | Trend Structure & Key Reactions⏱️ We’re analyzing Bitcoin on the 1-hour timeframe.
👀 After breaking below its support zone at 107,402, Bitcoin experienced a correction along with increasing sell pressure. The price then moved toward the 112,200 support area, where it formed a V-pattern — which has now been broken to the upside.
🎮 We’re using Fibonacci levels to identify key resistance zones and long-entry triggers. A higher low has formed above the 112,217 support and above the 0.382 Fib level, which could serve as a strong confirmation of the breakout .
⚙️ The RSI oscillator on the 1H chart is currently above 50. If buying volume increases, RSI may enter the Overbought zone. The critical level here is 70 — breaking above it can act as a confirmation for a long position .
☄️ A specific Fibonacci-based zone, linked to market maker sellers and supply pressure, was touched, triggering a reaction — around 177 BTC were sold following that touch .
🖥 Summary : As long as Bitcoin stays above its previous high, there’s no immediate concern for long positions. Based on the confirmations above, you may consider entering a long position upon a resistance breakout and taker-seller zone clearance .
📉 No short positions are planned until the 110,000 support level is clearly broken .
BTC/USDTPossible AMD setup forming. Entry only after clear confirmation.
If validated, the target is a move toward new ATHs.
However, if downside pressure continues, we could see a correction below the $110K level.
Stay reactive — not predictive.

EXPECTATION THAT BTC WILL FALL IS VERY HIGHThe area im looking to sell BINANCE:BTCUSDT.P from is a very strong resistance that would be very difficult for mr BITCOIN to pass through, so therefore, im expecting BTC to reject from there and fall to the down side. Sell BTC

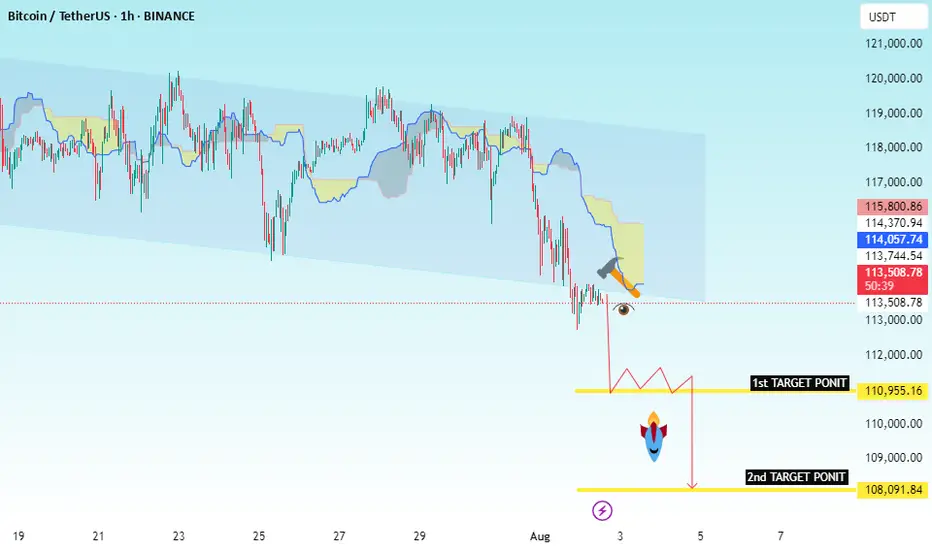
BTC/USDT Bearish Continuation SetupChart Identification:
Timeframe: Likely 1H or 4H
Pair: BTC/USDT
Indicators: Ichimoku Cloud
Pattern: Price broke down from cloud resistance and is retesting previous support
Setup: Bearish continuation with consolidation before next leg down
---
✅ Trade Setup (Sell):
🔹 Entry Point:
Sell Entry: Below 113,500.84
This level marks the neckline of a small consolidation zone.
Wait for clean candle close below this level.
---
🎯 Target Levels (Take Profit):
1. TP1: 110,955.16
Previous minor support
2. TP2: 108,091.84
Key support/demand area
---
🧠 Optional Confirmation:
You can wait for:
Bearish candlestick pattern at 112.1K zone
Rejection of retest near 113.7K–114.3K (top of cloud)
---
📌 Summary:
> BTC/USDT Short Setup
🟢 Entry: Below 113,500.84
🎯 Target 1: 110,955.16
🎯 Target 2: 108,091.84
Bearish bias as price remains below the Ichimoku cloud and shows signs of continuation.
BTC/USDT Technical Analysis Market Overview
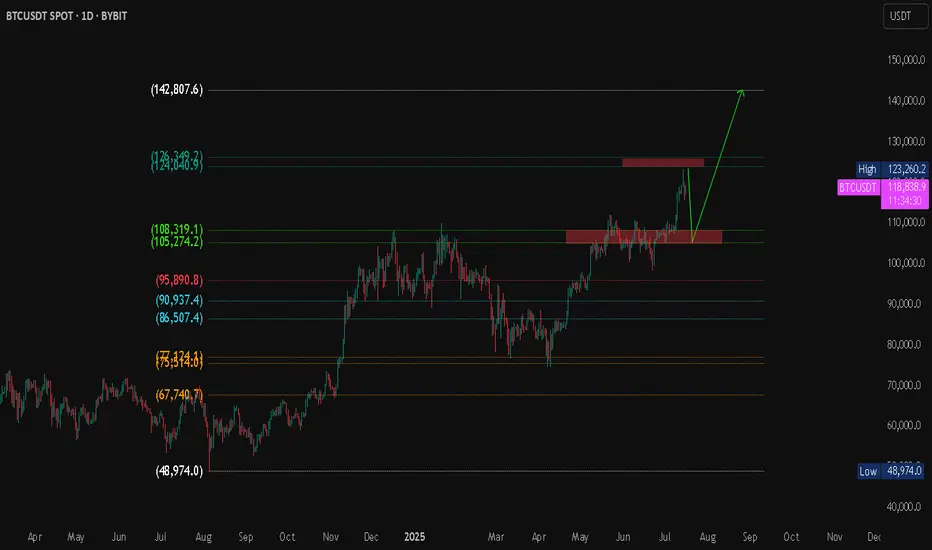
Bitcoin is currently trading at $118,788, with an intraday high of $119,311. The market has recently tested a major resistance zone and is showing signs of a potential pullback toward a key demand zone before a possible continuation to higher levels.
Projected Scenario (Bullish Bias)
Expected pullback to the support zone around $105K – $108K.
If price holds and shows a bullish reversal, a breakout above $124K is expected.
Primary upside target: $142,807 (Fibonacci projection / potential new high).
127k after small fall to 112k . buy altcoins in 112k
Hello. Wait for a small correction to the 112k range. There is still wave 5 left to end this bullish move, which I think will make a new record in the 127k range.

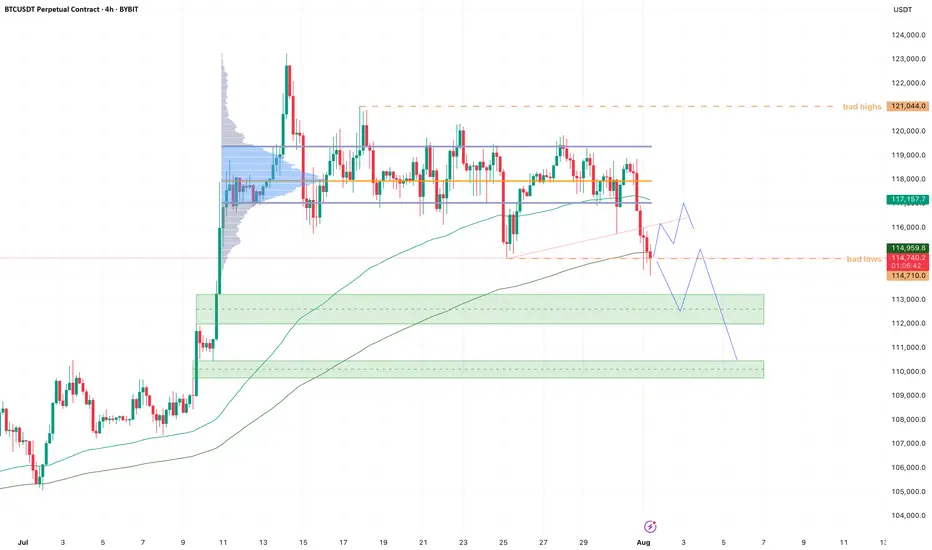
BTC - Cleaned up the lows!Bearish momentum is starting to stall here at the lows.
New month, and we started it by cleaning up the previous month's bad lows.
If we can hold here I'm looking for a trendline retest and VAL retest soon. Maybe we get one more sweep of the low, giving us a three drive pattern.
Reclaim VAL then it's back to VAH, maybe take out all the bad highs.
If we start bleeding into the lower demand zone (green box), I will start paying attention for a potential bearish retest into 110k, which we be our last area of imbalance to fill.
4RRI Think the likelihood that we may have finished moving down on bitcoin is over, however, even if that is not the case, This may be a nice trade!

BTC - Falling or Going up? Will it go 120k?BTC's move as said is something to be taken care off, while if it falls below from the point i drew needs to be seen