Golden Bitcoin Signal: A Great Investment Opportunity🔔 Our Bitcoin Investment Bot has issued an exclusive signal! This signal, backed by 15 years of historical data analysis, marks the perfect time to enter the market. 🎯 Take Profit Target: $120,975 (equivalent to a potential 50.5% profit)
⚖️ Professional Risk Management: This signal comes with a Stop Loss at $66,835 (16.8% risk), offering an ideal balance of profit and risk. Our bot, with its advanced and data-driven strategies, identifies the most valuable investment opportunities.
⏳ Opportunities don’t last forever! This signal could be the start of a significant move. Now is the best time to act and take advantage of this precise analysis. With our bot, you’re one step closer to sustainable profitability. 🌟
BTCUSDT trade ideas

Global liquidity downtrend cometh!During this current BTC cycle, major uptrends in global liquidity have corresponded to major uptrends in the market 72ish days later. The last major uptrend in liquidity is about to run its course, pause, and then downtrend. If this relationship holds, we are at or near at least a pause in the local up trend. I have my popcorn ready to see if this plays out.
Note: The global liquidity prediction pauses until December 11th and then downtrends, so if we see floating higher prices until that point and then a pause, the relationship would still be valid.
Second Note: I will publish the BGL (Bitcoin Global Liquidity) indicator very shortly. Please test it out and DM me if you see any issues or have suggestions.
--Da_Prof

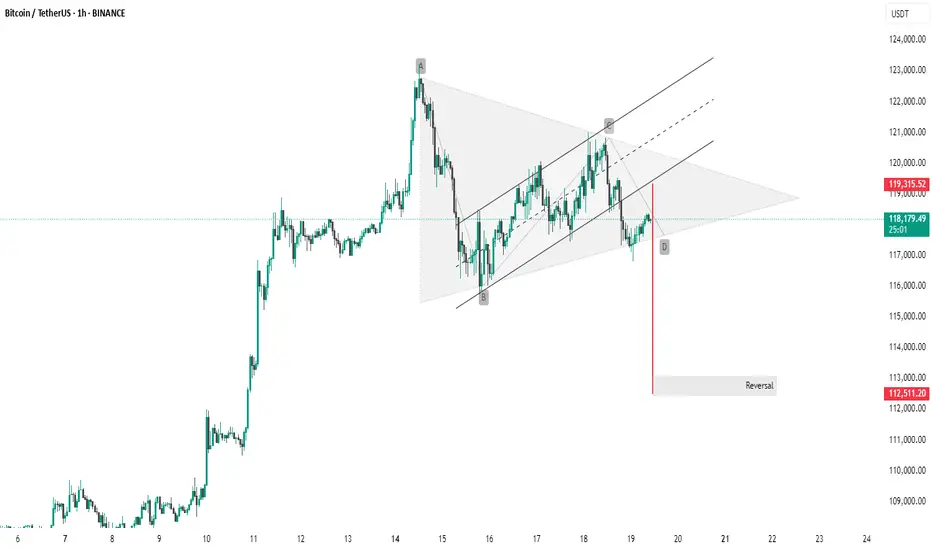
BTC #Bitcoin (BTC/USDT) 1-hour chartThis Bitcoin (BTC/USDT) 1-hour chart shows a bearish breakout from a symmetrical triangle or rising wedge pattern. The breakout is confirmed by a strong red candle below the lower trendline, suggesting downward momentum.
Pattern: Bearish wedge/triangle.
Breakout Level: ~118,000 USDT.
Target Zone: Around 112,511 USDT, marked as a potential reversal area.
Resistance: ~119,315 USDT.
This indicates bearish sentiment in the short term unless BTC quickly reclaims the upper trendline.
Thanking you
BTCUSDTHello Traders! 👋
What are your thoughts on BITCOIN?
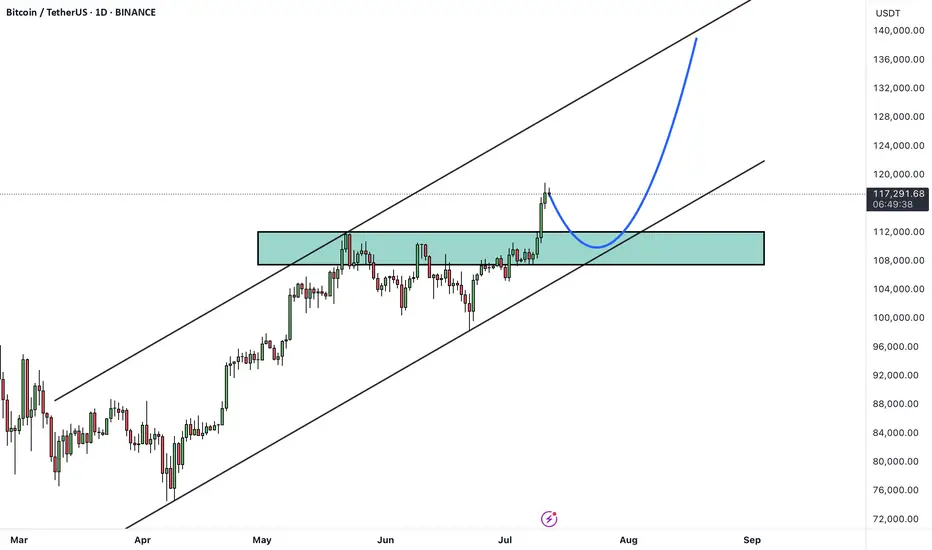
Bitcoin has recently broken above its all-time high and printed a new record high, signaling strong bullish momentum. Currently, the market has entered a consolidation phase, which is typical after such a major breakout.
A pullback toward the previous breakout level (the old all-time high) is expected, which now acts as new support.
After this consolidation and pullback, the price could resume its bullish trajectory and move toward higher targets, including the upper boundary of the current bullish channel.
As long as the price remains above the key support zone, the overall trend remains bullish and any dip could be seen as a buying opportunity within the broader uptrend.
Will this consolidation lead to the next leg up, or is a deeper correction ahead? Share your thoughts below! 🤔👇
Don’t forget to like and share your thoughts in the comments! ❤️
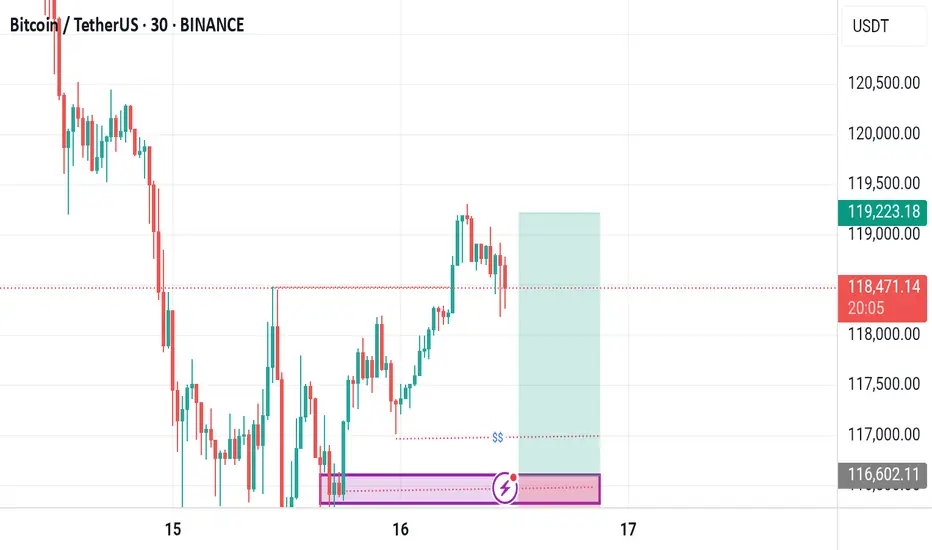
BTCUSDT. Current scenario range Current scenario range — can shift depending on how the market reacts next.
This analysis is based on the Initiative Analysis concept (IA).
Wishing you profitable trades!
BTC for long *The content on this analysis is subject to change at any time without notice, and is provided for the sole purpose of assisting traders to make independent investment decisions.

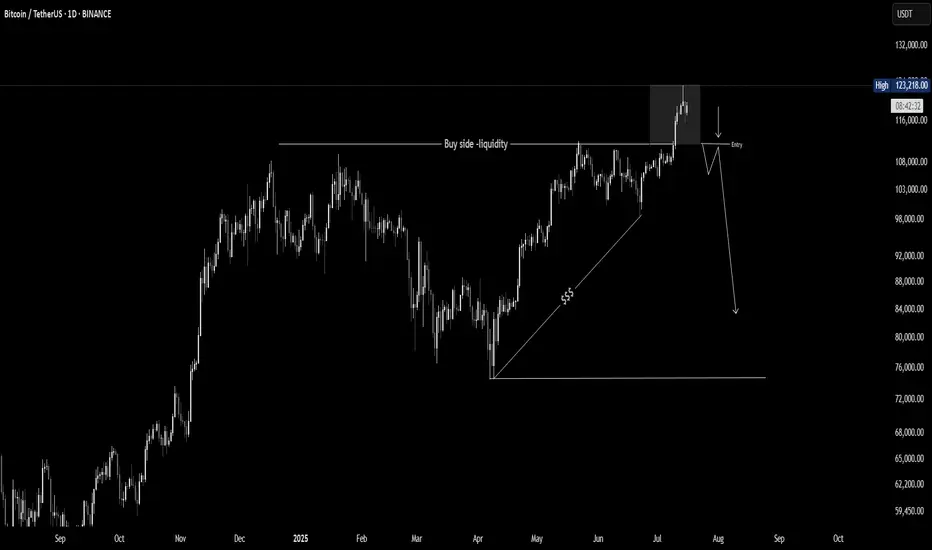
BTC Just Broke the High - But Don't get Trapped!Bitcoin just swept the recent high, triggering breakout euphoria. But this could be a classic liquidity grab, not a true breakout. If price fails to hold above the level and shifts structure, we may see a sharp bearish reversal BINANCE:BTCUSDT BINANCE:ETHUSDT 👀
HolderStat┆BTCUSD above $120BINANCE:BTCUSDT has surged past $129,000 following a breakout from long-term consolidation. The chart shows a clean continuation structure with the next resistance between $135,000–$137,000. Momentum remains on the side of bulls.

BTC TRADE PLAN 11/07/2025 - Diamond PatternDear traders,
Technical Analysis of BTCUSDT (Bitcoin/USDT) – July 11, 2025
🕐 Timeframe: 4H
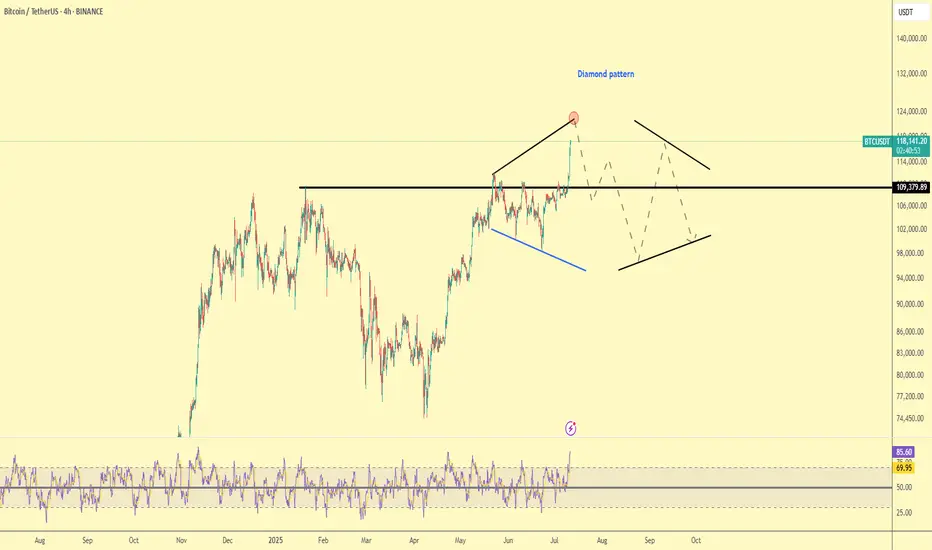
Price has broken above the major resistance at $110,000 and is now trading around $118,000, forming a Diamond Top pattern — a classic reversal formation that may signal an upcoming downtrend or correction.
🔻 Key Highlights:
Major Resistance: $118,000 – current top and potential reversal point.
Key Support: $110,000 – if broken, next targets may lie around $95,000–$100,000.
Diamond Pattern: Typically a bearish reversal signal after a strong uptrend.
RSI Indicator: Currently in overbought territory (above 85), suggesting buyer exhaustion.
📉 Possible Scenario:
Price may reverse from $118,000 -120,000 and test the $110,000 support. A break below that could lead to a deeper correction in the coming weeks.
Regards,
Alireza!
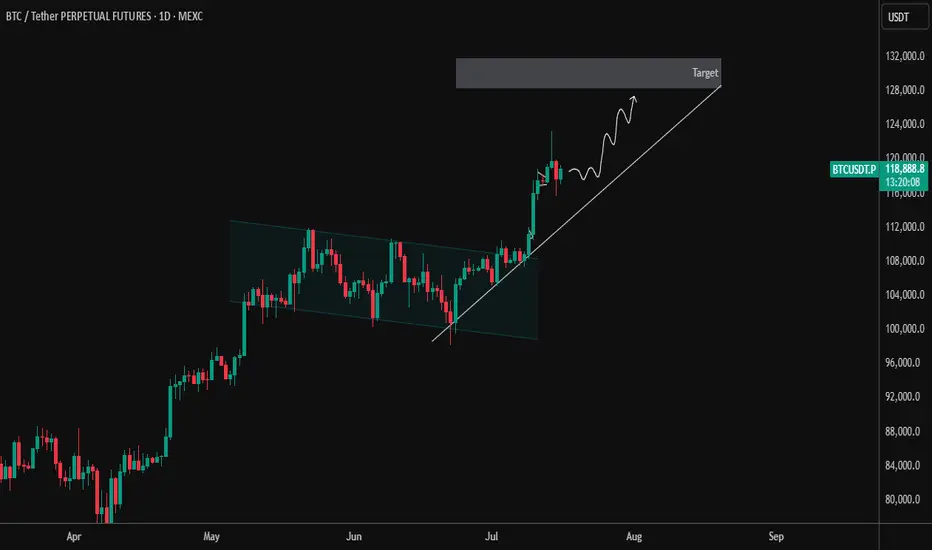
BTCUSDT 1 Day – Breakout and Retest Completed | Next TargetBTC has officially broken out of the descending parallel channel that dominated price action from mid-May to early July. After a successful breakout, price pulled back for a clean retest of the channel resistance, which has now flipped to support — a classic bullish continuation signal.
🔹 Key Technical Highlights:
✅ Breakout from descending channel structure
✅ Retest of breakout zone confirmed with strong bullish candles
🔼 Current Price: ~$118,971 (as of chart time)
📈 Short-Term Structure: Following a clean higher-low formation with ascending trendline support
🎯 Target Zone: $128,000–$130,000 (next key resistance area)
As long as BTC maintains this ascending support line, the momentum remains with the bulls. Any dips toward the trendline may offer good long opportunities with proper risk management.
📌 Watch for:
Rejection near the target zone
Bullish continuation patterns like flag/pennant on lower timeframes
Volume confirmation during breakout attempts
Let the trend be your friend. Trade safe! ⚡
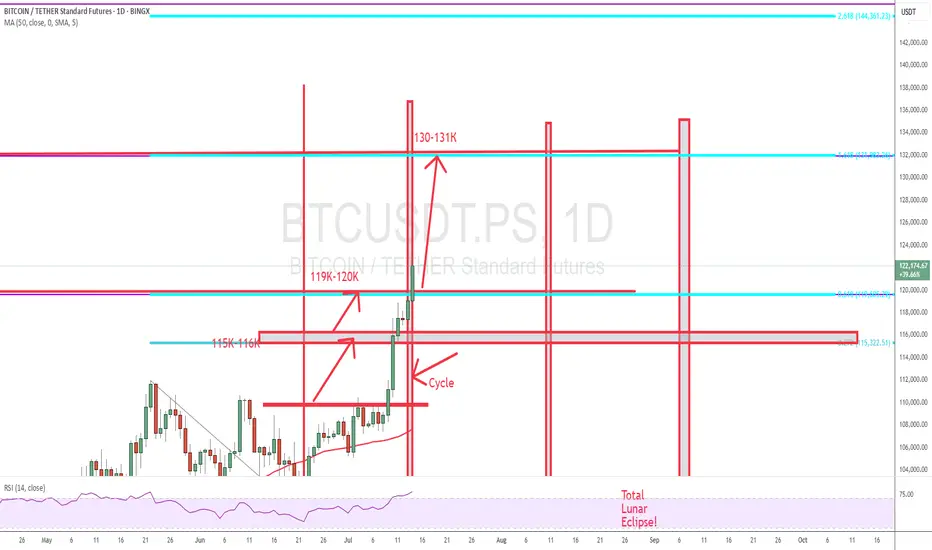
Still bullish on BTC, but this will be the LAST UP SWING!Take Profit around 130K.
Daily close above 133K will fail the analysis.
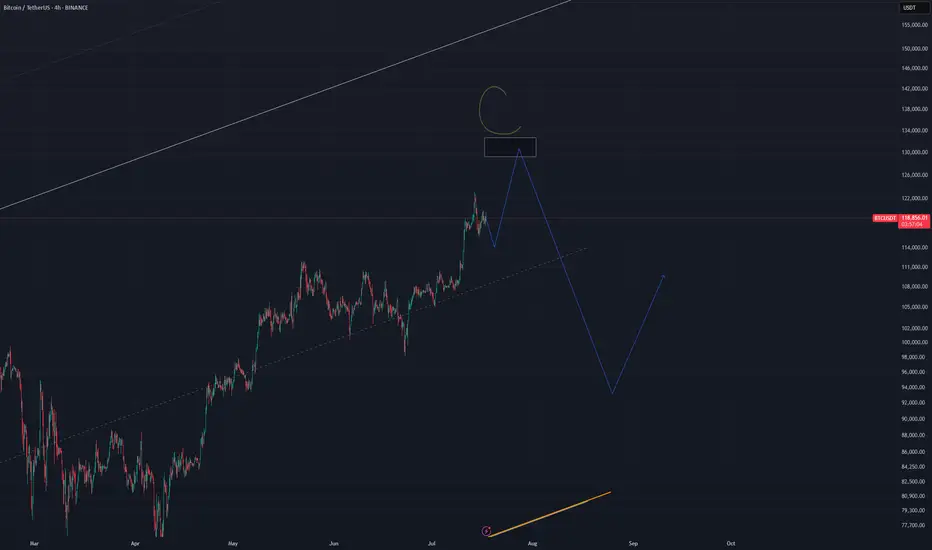
Support and resistance zones: 115854.56-116868.0
Hello, traders.
Please "Follow" to get the latest information quickly.
Have a nice day today.
-------------------------------------
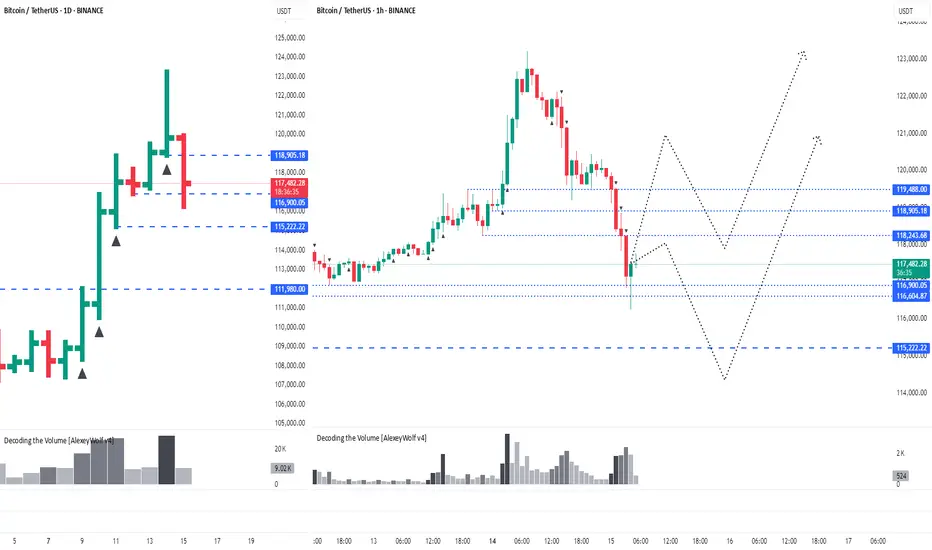
(BTCUSDT 1D chart)
This decline created a new trend line.
This added a period of volatility around July 31st.
If the HA-High indicator is generated at the 115854.56 point, the key is whether it can be supported and rise around that point.
If it falls below the HA-High indicator, there is a possibility of a downward trend.
Therefore, it is necessary to look at which support and resistance points the price is maintained at as it passes the volatility period around July 18 (July 17-19).
-
Since the StochRSI 80 indicator is formed at the 116868.0 point, it is important to be able to maintain the price above 116868.0 if possible.
Therefore, assuming that the HA-High indicator will be generated at the 115854.56 point, the key is whether there is support around 115854.56-116868.0.
Next, since the M-Signal indicator on the 1D chart is rising above 116696.20, we need to check if it is supported by the M-Signal indicator on the 1D chart or around 116696.21.
-
So far, we have talked about how to maintain an upward trend by breaking through a certain point or section.
That is,
- The K of the StochRSI indicator should be below the overbought section and should show an upward trend with K > D.
- The PVT-MACD oscillator indicator should show an upward trend. (If possible, it should be above the 0 point.)
- The OBV indicator of the Low Line ~ High Line channel should show an upward trend. (If possible, it should be maintained by rising above the High Line.)
I said that when the above conditions are met, there is a high possibility that the upward trend will continue.
On the other hand, in order to change to a downward trend,
- The DOM (60) indicator should be created and show resistance near the DOM (60) indicator.
- When the HA-High indicator is generated, it should show resistance near the HA-High indicator.
- When the K of the StochRSI indicator falls from the overbought zone, it should switch to a state where K < D and show a downward trend. (However, caution is required as volatility may occur when K reaches around the 50 point.)
- The PVT-MACD oscillator indicator should show a downward trend. (If possible, it is better if it is located below the 0 point.)
- The OBV indicator of the Low Line ~ High Line channel should show a downward trend. (However, it should show a downward trend in the state where OBV < OBV EMA is present.)
When the above conditions are satisfied, there is a high possibility of a downward trend.
Among these, the most intuitive thing to know is whether the DOM (60) indicator and the HA-High indicator are generated.
This is because, in order to first switch to a downward trend, a signal that the current price position is a high point must appear.
The DOM(60) indicator is an indicator that indicates the end of the high point.
Therefore, if the DOM(60) indicator is generated, it is likely to be a high point.
However, since it can be supported and rise near the HA-High indicator, you should check whether there is support in the HA-High ~ DOM(60) section and respond accordingly.
The HA-High indicator is an indicator created for trading on the Heikin-Ashi chart, and if it falls below the HA-High indicator, it is likely to be a point where a downtrend will begin.
-
Since the same principle applies to any time frame chart you trade, it is easier to understand the chart and determine the timing of the start and end of the transaction.
However, the basic trading method must be a split trading method.
The reason is that if it rises in the HA-High ~ DOM(60) section, it is likely to show a stepwise upward trend, and if it falls in the DOM(-60) ~ HA-Low section, it is likely to show a stepwise downward trend.
This basic trading method, that is, buying near the HA-Low indicator and selling near the HA-High indicator, will eventually make you familiar with day trading, which will have an effective influence on finding a buying point when making mid- to long-term investments.
It is wrong to say that you are good at mid- to long-term investments when you are not good at day trading.
You were just lucky.
Unfortunately, this kind of luck cannot last.
-
Thank you for reading to the end.
I hope you have a successful transaction.
--------------------------------------------------
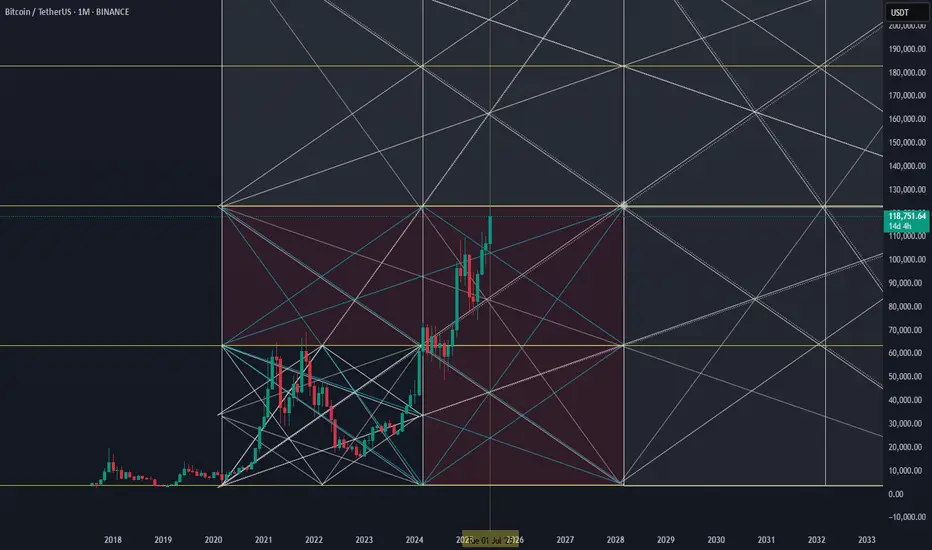
- This is an explanation of the big picture.
(3-year bull market, 1-year bear market pattern)
I will explain more details when the bear market starts.
------------------------------------------------------

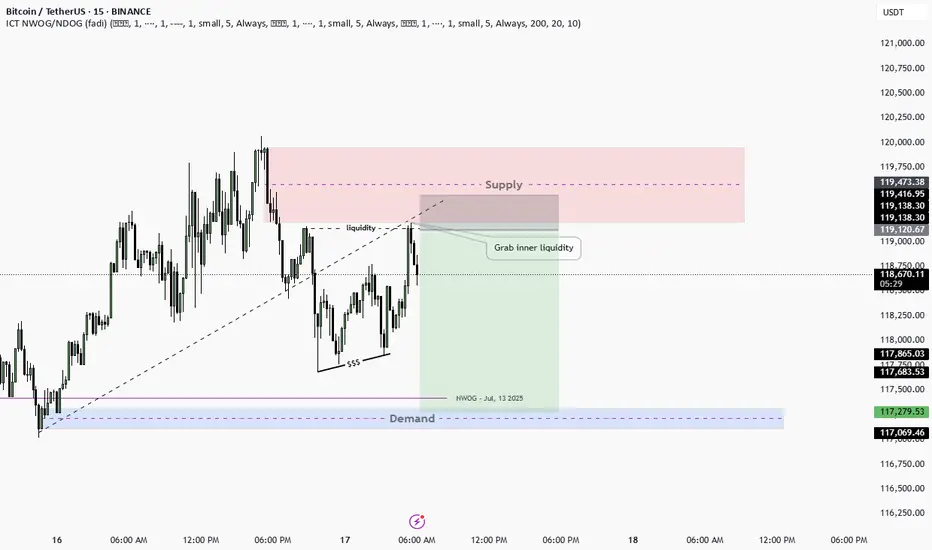
Daily Pan Trade NO.1SMC concept that actually work really nice after we take inner liquidity we going for demand zone
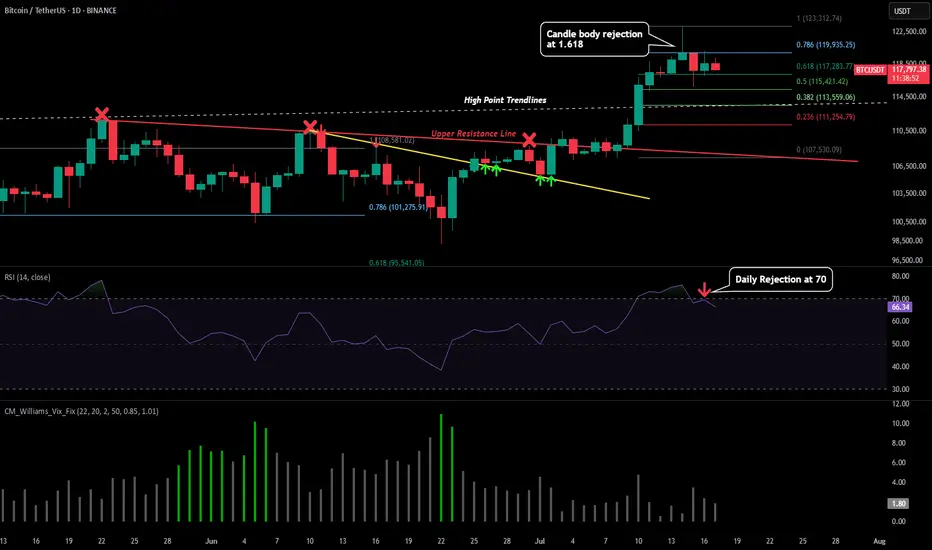
BTC - Signals of Cooloff IncomingPlease refer to our previous post:
To give additional detailed context of what to look for please look at our last post that is linked above. So far with recent price developments this idea is still intact.
What I have also outlined in todays post are some of the reason this short term retracement is still in place.
-Market has moved up very fast
-Lots of leverage from the highs need to be flushed
-Daily candle close below our first 1.618 extension target
-Daily RSI just got rejected from the 70
If we do see a retracement then all those price levels mentioned in our last post are valid. I have also add a predictive fib model that could outline important future price levels on the LTF.
Given this model does not have much price data to go off of the accuracy cannot be for certain but pay attention the the 0.382 around $113.6k and the predicted bottom around $107.5k if price drops that low.
The way price could avoid a LTF retracement is by the daily RSI reclaiming strength above the 70 level and negating the rejection. Will make an updated post if this is to occur.
BTC AI Prediction Dashboard - 6h Price Path (17.07.25)
Prediction made using Crypticorn AI Prediction Dashboard
Link in bio
BTCUSDT Forecast:
Crypticorn AI Prediction Dashboard Projects 6h Price Path (Forward-Only)
Forecast timestamp: ~10:30 UTC
Timeframe: 15m
Prediction horizon: 6 hours
Model output:
Central estimate (blue line): -119,394
Represents the AI’s best estimate of BTC’s near-term price direction.
80% confidence band (light blue): 118,475 – 119,566
The light blue zone marks the 80% confidence range — the most likely area for price to close
40% confidence band (dark blue): 117,621 – 120,336
The dark blue zone shows the narrower 40% confidence range, where price is expected to stay with higher concentration
Volume on signal bar: 121.96
This chart shows a short-term Bitcoin price forecast using AI-generated confidence zones.
Candlesticks reflect actual BTC/USDT price action in 15-minute intervals.
This helps visualize expected volatility and potential price zones in the short term.

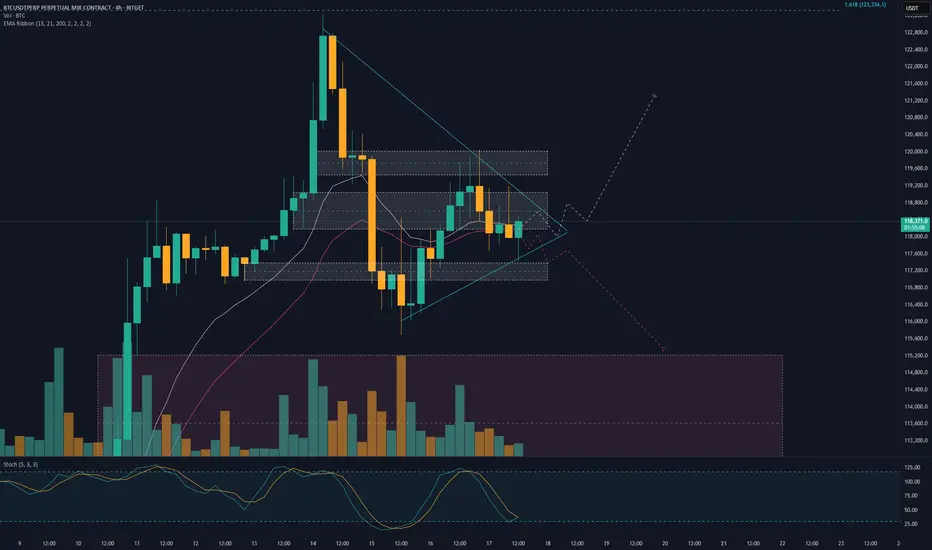
Potential path for BTC (no free lunch)
The market gets horny as PA moves into the weekly open again.
BTC pulls an F-you move and dumps into the Daily fair value gap
THEN continuation actually happens

BTC updateHere is the next upside Target. But - we're overbought, so better (for longs) wait for pullback. Also, better for safety.
Good Luck!
Bitcoin short from 121kLooking for shorts at these leveks.
Target aroind cme gap.
Also npoc level is down at that region.
Patiently waiting.

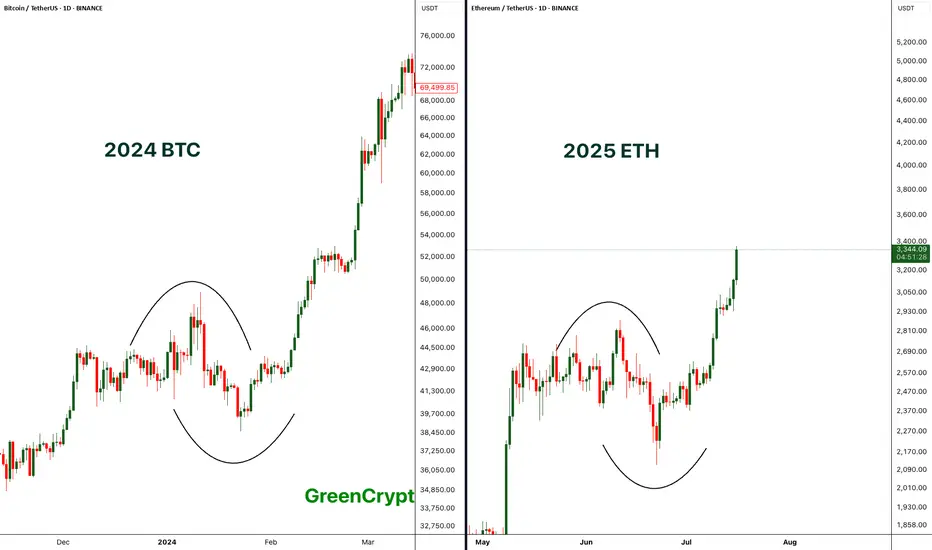
Comparing BTC 2024 with ETH 2025 - Perfect Match- If compare the chart pattern of BTC from 2024 with the current 2025 ETH pattern, wee see exactly similar chart patterns being formed here.
- Price started consolidating then it had fake breakout towards both the sides and finally the real breakout.
- BTC breakout push the price towards the new all time high above 69K, if we ETH follows similar trend then we can expect new all time high on ETH.
Let's see how it plays out.
Stay tuned for more updates.
Cheers
GreenCrypto
$BTC All Eyes on the FVG Zone. CRYPTOCAP:BTC broke out above key resistance and is now retesting the FVG zone near $112K–$115K.
Holding this level could trigger a fresh rally toward $127K–$132K.
DYRO, NFA

BTC buy signalBitcoin is ready to rally upward targeting the swing point that broke above the market structure, so we expect a pullback to the order block bellow the liquidity zone as our point of interest.