BTC Retest In Progress – Ready for Liftoff?🚀 Bitcoin has been respecting the long-term rising channel (blue) — moving in clear impulsive 📈 and corrective 📉 waves.
After each bullish leg (highlighted in pink), BTC dips into a correction (red), finds support at key demand zones 🟧, and then kicks off a new rally.
🔥 Currently, BTC is hovering near a strong demand zone around the $110,000–$113,000 area, forming a potential higher low within structure.
If this zone holds, the bulls 🐂 could regain control and push price toward the $130,000–$140,000 range — aligning with the upper boundary of the channel 📊.
💡 Continuation soon?
Let the market decide — we’re watching this zone closely for a bullish breakout confirmation ✅
💬 What’s your bias here? Are you bullish or waiting for a deeper pullback?
📚 Always follow your trading plan regarding entry, risk management, and trade management.
Good luck!
All Strategies Are Good; If Managed Properly!
~Richard Nasr
BTCUSDT trade ideas

TradeCityPro | Bitcoin Daily Analysis #149👋 Welcome to TradeCity Pro!
Let’s move on to Bitcoin’s analysis. Today, Bitcoin has once again moved toward a certain range, and we need to see whether it can break this zone this time or not.
⏳ 4-Hour Timeframe
On the 4-hour timeframe, Bitcoin has once again moved toward the 117000 zone today, faced a rejection candle from this level, and now it seems to be heading for a correction.
✔️ Considering tomorrow is also a holiday, the likelihood of ranging and correcting is much higher than continuing the trend, because for the uptrend to continue, the price needs volume inflow — and today and tomorrow, significant volume is unlikely to enter Bitcoin. That’s why the probability of correction and ranging is higher.
📊 If, during the correction, the price can hold above 115364, then with the start of the new week, the probability of a new bullish wave increases significantly. In that case, we can open a long position upon breaking the 117000 zone.
✨ However, if the price breaks below 115364, the correction could extend down to 112233. This still won’t change the overall trend, but it would fake the entire move made during the week — which is not a good sign for the bullish trend.
🔍 As long as the price remains above 112233, I am still only looking for long triggers and will not open any shorts for now.
❌ Disclaimer ❌
Trading futures is highly risky and dangerous. If you're not an expert, these triggers may not be suitable for you. You should first learn risk and capital management. You can also use the educational content from this channel.
Finally, these triggers reflect my personal opinions on price action, and the market may move completely against this analysis. So, do your own research before opening any position.

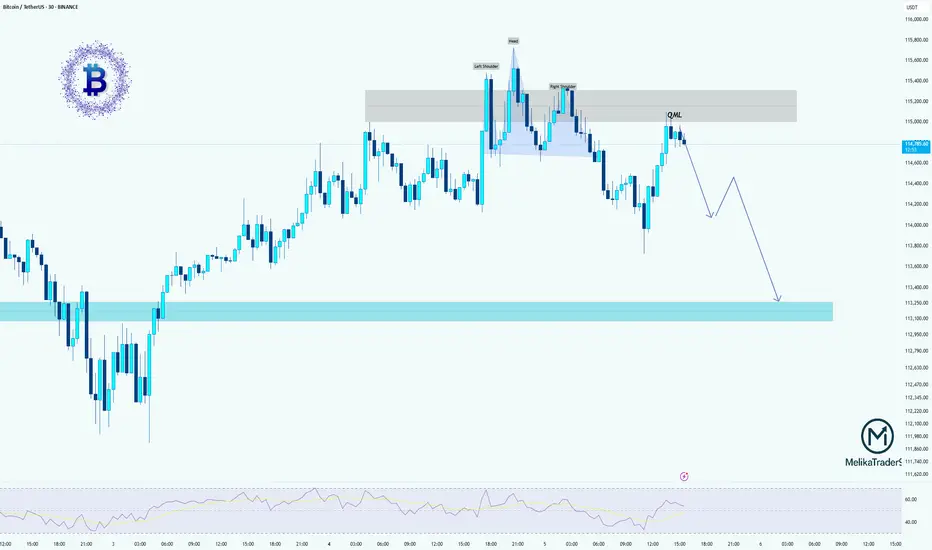
BTCUSDT: Head & Shoulders + QML SetupHello guys!
We have a clean Head & Shoulders pattern forming near a supply zone, with a nice QML (Quasimodo Level) rejection confirming the bearish bias. Price is struggling to break above 115K and has already reacted to the QML zone.
If this structure holds, we could see BTC start a new bearish leg 📉, first targeting 114K, and eventually reaching the demand zone around 112.8K–113.2K.
Watch for further confirmation with lower highs forming.

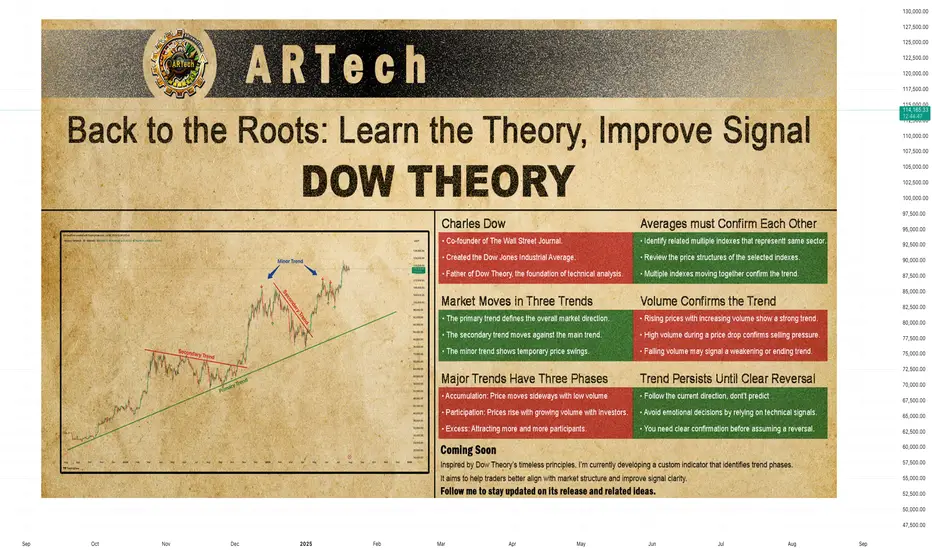
DOW THEORYBack to the Roots: Learn the Theory, Improve Signal
Charles Dow
Before we explore Dow Theory, let’s take a moment to understand who Charles Dow was — and why his ideas still matter today.
Charles Dow wasn’t a financial expert. He was a journalist with a sharp eye for market behavior. In the late 1800s, he began to write about how prices move, how trends form, and what they might mean. His goal was simple: to bring structure and logic to the chaotic world of stock prices.
More importantly, he believed that markets move in trends , and that these trends reflect the collective psychology of all investors. This basic idea became the starting point of technical analysis .
Dow created one of the first stock indexes, which helped investors see the bigger picture instead of focusing only on individual stocks. He also promoted transparency in financial data — long before it was required by law.
In 1889, Dow co-founded The Wall Street Journal, a newspaper that became the voice of financial markets. Through its pages, he published his observations on price behavior, setting the foundation for what would later be known as Dow Theory .
Dow Theory
At the heart of Dow Theory lies a simple but powerful idea:
The market discounts everything.
This means that all known information — earnings reports, interest rates, economic events, political changes, and even future expectations — is already reflected in the price. Price is not random. It is the result of collective investor behavior based on all available knowledge.
Charles Dow didn’t write this exact sentence, but his work clearly reflected this belief. He trusted that by analyzing price movements alone, one could understand the overall direction of the market — because price already includes all the important signals.
Dow and later analysts outlined a set of guiding principles. These are now known as the Six Core Principles of Dow Theory , and they continue to serve as a foundation for modern technical analysis.
The market discounts everything
The market moves in three trends
Major trends have three phases
Averages must confirm each other
Volume confirms the trend
A trend stays in place until it clearly reverses
🔸🔸🔸 The Market Moves in Three Trends 🔸🔸🔸
According to Dow Theory, market movements are not random. Prices move in three different dimensions and time frames: the primary trend , the secondary trend , and the minor (short-term) trend. These three types of movement often occur at the same time. It is very important for an investor to distinguish between them.
The primary trend shows the general direction of the market and can last for months or even years. It’s the major upward or downward movement.
The secondary trend refers to corrections or pullbacks that move in the opposite direction of the primary trend.
The minor trend typically consists of daily or weekly fluctuations and is often considered market “noise.” These short-term movements can occur in the same or opposite direction of the primary trend and may last from a few hours to two or three weeks.
Dow Theory emphasizes that understanding this three-layered structure can protect investors from many mistakes. The theory not only classifies trends but also offers valuable lessons about investor behavior.
It especially highlights the importance of three key principles:
Don’t go against the main trend
Short-term moves can easily confuse traders. Trading against the primary trend often leads to losses. That is why it is crucial to identify the main trend and follow it.
Diversify your exposure
In Dow’s time, technology wasn’t as advanced as it is today, but he still followed multiple indexes (like industrials and transport) to reduce risk. The same principle applies today: investors shouldn’t rely on a single asset — diversification remains a critical part of managing risk.
Define your holding period before entering a trade
Each type of trend comes with a different time expectation. The holding period you choose will play a key role in shaping your trading strategy and aligning it with your financial goals. Instead of debating how long each type of trend should last, it’s more important to define your intended holding period before entering a position.
Your answer to the question “Which holding period suits me?” reflects not only your trading style and lifestyle, but also determines which chart timeframes and indicator timeframes you should use.
🔸🔸🔸 Major Trends Have Three Phases 🔸🔸🔸
According to Dow Theory, major (primary) trends consist of three phases. This structure reflects how investor psychology changes over time and how those emotions are reflected in price action. Regardless of whether the trend is bullish or bearish, each major trend includes these three stages:
Accumulation Phase
The first stage of a bull market often looks like a small bounce during a bear trend. Most people still feel negative about the market. They are afraid to buy again after losing money. Trading volume is low, and prices move in a narrow range. The market stops making new lows, but investors are still unsure. Many have left the market or are very careful now. The price action becomes slow and sideways. It feels boring. But during this quiet time, smart investors slowly start buying. This is how a new trend begins — silently and with doubt.
However, there is no clear signal that a bull market has started. Buying now carries two big risks. First, the market may still go lower. Second, even if a bull trend is coming, no one knows when it will start. How long can you wait while the market does nothing? Holding positions in a flat market has costs — financial, emotional, and missed opportunities elsewhere. That’s why this phase is difficult for most traders to handle.
Public Participation Phase
The market begins to recover, and the broader investor base starts to notice positive changes. News improves, technical indicators give bullish signals. Prices rise, and trading volume increases. This is usually the strongest part of the trend. At this stage, more disciplined and research-driven investors — who follow the market closely — start buying in. They see confirmation in both price action and economic data. Their confidence supports the trend, and momentum grows. The market attracts more attention. Confidence replaces fear. Many investors who stayed out during the earlier phase now feel safer to enter.
Joining the market during this phase is important. The trend is already underway, but there’s still room to grow. Risk is lower than in the early phase, and potential rewards are still high. For many investors, this is the best time to take a position.
Excess Phase
The market enters a phase of excessive optimism. Prices have been rising for a long time, attracting more and more participants. However, during this stage, institutional investors and professional traders who entered earlier begin to gradually take profits.
Although prices remain high, momentum weakens, and the rate of increase slows down. Looking at the volume profile, prices may reach new highs but often without volume support. Technical indicators frequently show bearish divergences. These conditions generate early technical signals that the primary trend may be coming to an end.
🔸🔸🔸 Averages must Confirm Each Other 🔸🔸🔸
According to Dow Theory, a market trend is considered valid only when different indexes move in the same direction. The term “average” here refers to an index or the general direction of a price series. This principle is used to assess whether a price movement is supported by broad market participation.
A single index reaching a new high or low is not enough. For a real and sustainable trend to be confirmed, related indexes are expected to show similar movement and generate signals in the same direction. If this confirmation is missing, the current move may be considered weak or temporary.
How to Analyze It:
Identify related indexes
Choose multiple indexes that represent the same market, sector, or economic domain.
Compare trend direction
Review the price structures of the selected indexes. Are they all showing similar patterns? Did the new highs or lows form around the same time?
Look for confirmation
If multiple indexes form new structures in the same direction (e.g., all make new highs in an uptrend), this increases the validity of the trend.If only one index is moving while others are not participating, confirmation is lacking.
Be cautious without confirmation
When confirmation is missing, trading strategies should be more conservative, or additional signals should be awaited before taking action.
🔸🔸🔸 Volume Confirms the Trend 🔸🔸🔸
According to Dow Theory, the validity of a market trend depends not only on price movement but also on trading volume. For a trend to be considered strong and sustainable, price action should be supported by volume.
Why Is Volume Important?
In a rising market, increasing volume is expected. This indicates growing investor interest and broader participation in the trend.
In a falling market, if the decline happens with high volume, it suggests serious selling pressure and strengthens the trend.
Declining volume may signal a loss of momentum and suggest that the current trend is weakening or nearing its end.
How to Analyze It:
Observe the relationship between price and volume:
Price rising + volume increasing → Strong trend
Price rising + volume decreasing → Lack of confirmation; caution is advised
Check volume during breakouts:
If resistance or highs are broken with strong volume → Reliable signal
If breakouts happen on low volume → May indicate a false move (fakeout)
🔸🔸🔸 A Trend Persists Until a Clear Reversal Occurs 🔸🔸🔸
This core principle of Dow Theory is at the heart of all trend-following strategies.
It states that once a price begins moving in a certain direction, the trend is assumed to continue — until there is clear and technically confirmed evidence that it has ended.
Why Is This Principle Important?
Follow, don’t predict
Instead of guessing what the market will do next, traders stay with the current direction.
Reduces emotional decisions
Trades are based on technical signals, not assumptions like “the price is too high, it must fall.”
A weak trend is not the same as a reversal
Not every pullback means the trend is over. You need clear confirmation before assuming a reversal — such as a breakdown, volume shift, momentum loss, or structural change.
How to Apply It
First, identify the trend direction clearly, and trade in that direction.
Pullbacks are seen as normal movements within the trend — not as reversals.
Even when signs of a reversal appear, wait for confirmation before acting.
Confirmation signals may include:
Failure to form new highs or lows
A break of previous support or resistance
Sudden drop in volume or volume rising in the opposite direction
Weakness or divergence in momentum indicators
Strategic Benefit
This principle is especially useful in trend-following strategies. It helps avoid premature exits and allows traders to stay in profitable trends longer. By focusing on technical confirmation instead of speculation or panic, it encourages disciplined and systematic decision-making.
BTC – Bullish Breakout in SightBTC – Bullish Breakout in Sight
Bitcoin recently completed a bullish harmonic pattern near 112K, and the reaction was strong—showing that buyers stepped in around that level.
In just two days, BTC climbed by about 3.5%, reaching 115.7K—and it did so with relatively low trading volume, which highlights quiet but steady buying interest.
Right now, price is pausing between 113.7K and 115.7K, forming a possible accumulation zone.
If momentum picks up again, BTC could launch another bullish move toward:
🔹 116.8K
🔹 119K
You may find more details in the chart!
Thank you and Good Luck!
PS: Please support with a like or comment if you find this analysis useful for your trading day

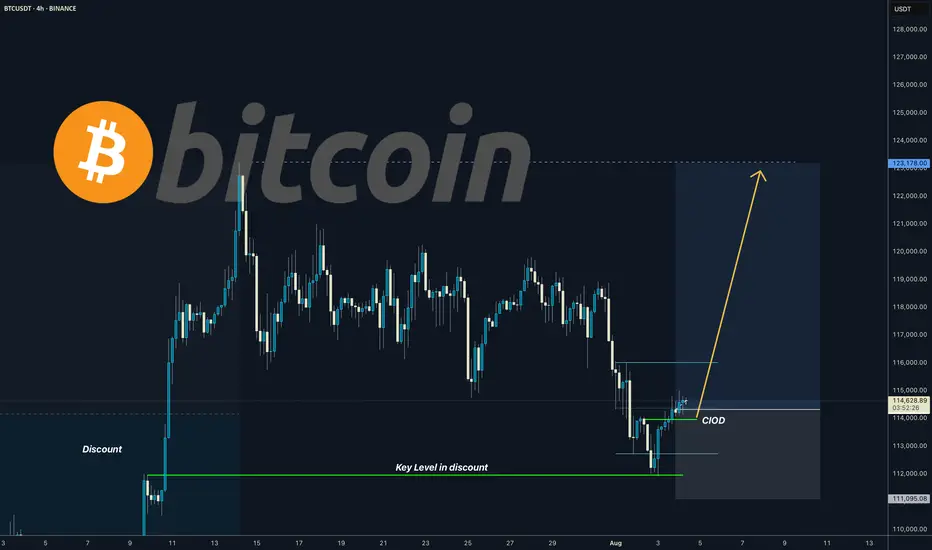
BITCOIN I Daily CLS I KL OB in the discount - ATH comingYo Market Warriors ⚔️
Fresh outlook drop — if you’ve been riding with me, you already know:
🎯My system is 100% mechanical. No emotions. No trend lines. No subjective guessing. Just precision, structure, and sniper entries.
🧠 What’s CLS?
It’s the real smart money. The invisible hand behind $7T/day — banks, algos, central players.
📍Model 1:
HTF bias based on the daily and weekly candles closes,
Wait for CLS candle to be created and manipulated. Switch to correct LTF and spot CIOD. Enter and target 50% of the CLS candle.
For high probability include Dealing Ranges, Weekly Profiles and CLS Timing.
“Adapt what is useful. Reject whats useless and add whats is specifically yours.”
David Perk aka Dave FX Hunter
💬 Don't hesitate to ask any questions or share your opinions
TradeCityPro | Bitcoin Daily Analysis #148👋 Welcome to TradeCity Pro!
Let’s move on to Bitcoin’s analysis. Yesterday, Bitcoin made an upward move, but now it’s back around the same levels and has essentially faked most of that move. Let’s see what its next move could be.
⏳ 4-Hour Timeframe
Two changes have been made to the chart. First, I turned off the Fibonacci tool because the key levels in this corrective phase have already been identified, so there’s no need to use Fibonacci levels right now.
✔️ The second change is that I moved the Maker Buyer zone slightly higher because I think this placement is more accurate and the price has reacted better to it.
✨ With this updated zone, we can see that yesterday the price reached it, got rejected, and is now moving down.
📊 Volume during this correction has been decreasing, which is a positive sign for buyers. However, RSI faked the 61.67 zone, which isn’t great from a momentum perspective, but since the market doesn’t have a clear trend right now, it’s not very important for us.
💥 In my view, as long as the price stays above 115364, this correction is logical and doesn’t harm the bullish leg. But if the correction deepens, the probability of a drop back to 112233 increases.
💫 Confirmation of a bullish move will come after breaking the current zone. For the start of longer-term bullish legs, the 120041 and 122733 triggers are very important.
⏳ 1-Hour Timeframe
In the 1-hour timeframe yesterday, we could have opened a position using a candle setup, which could have given us a 2:1 risk-to-reward. But if you didn’t take profit, you likely hit the stop-loss by now.
🔔 I personally opened this position on my sub-account, while on my main account, I currently hold long-term Bitcoin positions with wider stops.
📈 At the moment, for opening a new position on Bitcoin, we can enter on a break of 116829. However, I’ll personally wait for the price to test this zone multiple times, form a clear main trigger, and then enter upon its breakout.
🔽 As for shorts, there’s no short trigger as long as Bitcoin is above 115364.
❌ Disclaimer ❌
Trading futures is highly risky and dangerous. If you're not an expert, these triggers may not be suitable for you. You should first learn risk and capital management. You can also use the educational content from this channel.
Finally, these triggers reflect my personal opinions on price action, and the market may move completely against this analysis. So, do your own research before opening any position.

Lingrid | BTCUSDT Trendline Breakout - Upside Surge Potential The price perfectly fulfilled my previous idea . BINANCE:BTCUSDT is pushing higher after reclaiming the 120,000 support zone and breaking out of the corrective structure. The trend shows higher lows, maintaining the integrity of the upward channel and pointing toward the 130,000 resistance area. Holding above 120,000 strengthens bullish momentum and keeps the breakout potential alive. The next upside target aligns with the channel’s upper boundary.
📉 Key Levels
Buy trigger: Break and hold above 120,000
Buy zone: 116,000–120,000
Target: 130,000
Invalidation: Drop below 114,850
💡 Risks
Rejection at 122,000 could cause deeper pullback
Macro market weakness may reduce bullish momentum
Failure to hold 120,000 risks retesting lower channel support
If this idea resonates with you or you have your own opinion, traders, hit the comments. I’m excited to read your thoughts!

BTC/USD 1h chart Pateern.From this updated chart, "TARGET POINT" label more clearly.
The horizontal green box you marked is roughly between $122,000 and $123,000 (though this seems like a different scale—possibly a derivative or index, not direct BTC price in USD).
The price is breaking above the descending trendline and heading toward that high-volume resistance zone.
The main targets I see from your own chart markings are:
First target: around $118,991 (blue label) — likely the nearest resistance.
Second target: around $120,137 (yellow label) — next key high-volume node.
Final target (your green box): around $122,000–$123,000.
These seem to be based on volume profile gaps and resistance levels.

BTC/USDT: Key Levels to Watch Now!Bitcoin remains in a macro bullish structure, but recent price action shows consolidation after breaking through major resistance levels earlier this month. Similar to previous cycles, BTC tends to form short-term ranges after strong rallies before deciding the next move.
Currently, BTC is trading near $116,500–$117,000, just above a key support zone from $115,200 to $114,500. This area aligns with previous breakout levels and the 20 EMA on the 4H chart, making it critical for the short-term trend.
*Bullish Scenario: Holding above $115,200 and breaking $118,600 with strong buying volume could push BTC toward $120,500–$122,000 within days.
*Bearish Scenario: A close below $114,500 could trigger a correction toward $112,800–$111,900. Losing this level may extend the retracement to $110,200 (major demand zone).
Summary:
BTC is consolidating near key support. Past scenarios suggest a breakout above $118,600 could fuel the next bullish leg, but losing $114,500 risks a deeper pullback toward $112,800. The next 2–4 days should define short-term direction.

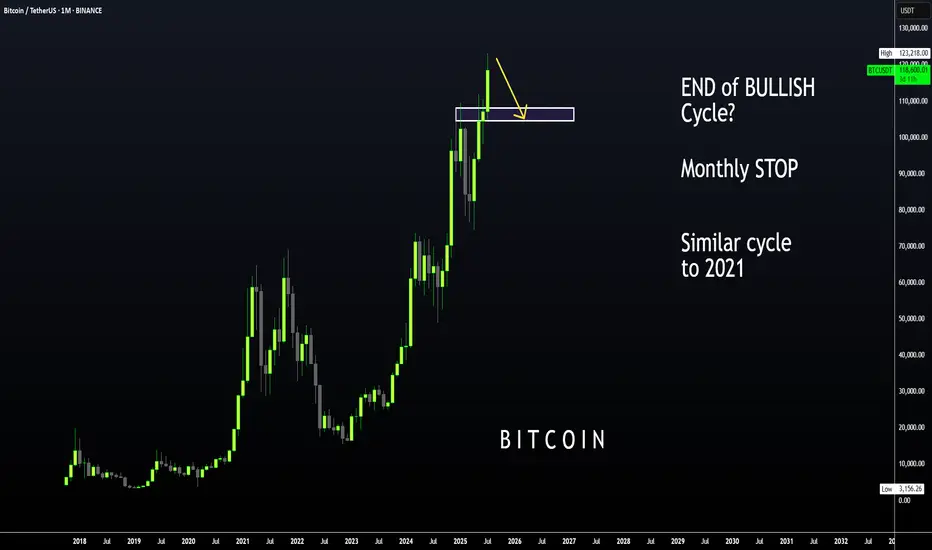
BTC | ALT Season, then BEARISH CYCLE BeginsBitcoin is likely moving in to the beginning of a bearish cycle.
I'm not saying this is immediate, we first need to see altseason - however, if BTC increases it may not go any higher than the last high of $123k. We could easily see the price hover around this zone with a few small increases and decreases for the next few weeks as alts make their respective moves.
I have been talking about the 2021 fractal for a couple of months, where BTC took its time to correct and then made another ATH which was only slightly higher.
We already see a similar pattern playing out in the monthly timeframe if we overlay bars pattern from 2021:
Although Bonce zone 3 may only be in several months, these are the major support zones where BTC could bounce from. Ideal for a swing:
____________________
BINANCE:BTCUSDT
Bitcoin Update Short-Term · Ignore Rejection At ResistanceQuick update and important. This will not change the broader market picture and our view. The market will continue growing long-term.
Here Bitcoin is showing a strong rejection on the daily timeframe coupled with a lower high and rising bearish volume. This can lead to some bearish action. This bearish action can be considered part of the consolidation period below resistance. As Bitcoin moves sideways, fluctuates, the altcoins market should continue to grow.
The bullish bias will be revealed based on the fact that day after day, many new altcoins will continue to break up.
The consolidation period for Bitcoin to break above $112,000 was 48 days. It's been 28 days since Bitcoin challenged $123,000. Do not be distracted, Bitcoin will continue to grow.
If you have any questions, feel free to leave a comment.
» If there is any altcoin you would like me to look at, just leave a comment with the trading pair ticker and I will do a full analysis for you.
Thanks a lot for your continued support.
Namaste.

TradeCityPro | Bitcoin Daily Analysis #150👋 Welcome to the 150th Bitcoin Analysis on TradingView by TradeCity Pro!
I am very happy that the number of daily Bitcoin analyses has reached 150. I hope the analyses have been useful so far and that you have been able to benefit from them. On this occasion, I want to present a complete and comprehensive analysis of Bitcoin.
📅 Weekly Timeframe
On the weekly timeframe, Bitcoin has been in a very strong uptrend since early 2023. After breaking the 24512 resistance, it made several sharp moves and, in multiple bullish waves, managed to register a new ATH in the 120000 zone.
✨ At the moment, it can be said that Bitcoin is in the seventh wave of its trend, which is quite a high number. The more waves a trend has and the more it shows signs of weakness, the higher the probability of a trend reversal.
📊 Regarding volume, there is not much to say because over time, Bitcoin’s trading volume on Binance has decreased. The reason is partly due to Binance exiting certain countries, and partly due to the growth of the DeFi space, where a significant percentage of trading now happens on DEXs, naturally reducing CEX volume.
⭐ However, if we compare the magnitude, slope, and candlestick size of the bullish waves, the trend weakness is clearly visible. But this does not mean the trend will reverse.
🧩 Many trends, even after showing weakness, continue for several more waves. If this happens for Bitcoin on the weekly timeframe, we can still take many long positions in futures during those waves.
💥 Therefore, this trend weakness is not a solid reason to avoid opening long positions for now. I still believe long positions in futures take priority over short positions.
🛒 For spot, if you have already bought Bitcoin, I suggest you keep holding for now. We can take profit after confirming the trend, but for now, it is better to hold.
🎲 However, for spot buying at current prices, I do not recommend it because it is not worth it. It is better to open futures positions to get a more reasonable profit.
🔔 Now that the 110000 resistance has been broken, the next targets are 128000 and 162000. If RSI enters the Overbought zone, these targets will be within reach.
📅 Daily Timeframe
In the last analysis I shared for this timeframe, the price was in a correction phase, and I mentioned that as long as the price is above 110183, the trend is bullish, and the probability of upward movement is higher than a drop.
🔑 That’s exactly what happened — the price formed a higher low above 110183, and RSI bounced from near the 38.21 support level and moved upward.
🔍 We had a Maker Seller zone between 120000 and 122000, and now the price has penetrated into it.
🔼 It seems to be getting rejected from the top of this zone and today failed to break it. Now we need to see what happens during the New York session.
✔️ In my opinion, it is unlikely that the price will break this top today. The market will probably wait for the U.S. inflation data release tomorrow before deciding on the next move.
📊 If inflation comes in higher than expected, the market will re-enter a correction phase, likely dropping back toward 110183.
📈 If inflation is lower than expected, Bitcoin can break the 122000 resistance and start a new bullish leg.
⏳ 4-Hour Timeframe
On this timeframe, Bitcoin finally broke through the Maker Seller zone it had formed, with a strong bullish candle. After RSI entered the Overbought zone, a Blow Off candle was printed near the 122733 resistance.
☘️ Currently, given the recent red candles, it appears that RSI’s entry into Overbought was a fake-out, and the price has pulled back to 120041.
⚡️ There is a possibility that the price could resume its upward movement from here, as the 120041 zone is an important level that can prevent further declines. In this scenario, the price would also have completed a pullback to the SMA7.
💥 If a deeper correction occurs, the next dynamic support is the SMA25, which is also an important momentum support.
📉 The lower static support levels for Bitcoin are currently 116829 and 115364.
❌ Disclaimer ❌
Trading futures is highly risky and dangerous. If you're not an expert, these triggers may not be suitable for you. You should first learn risk and capital management. You can also use the educational content from this channel.
Finally, these triggers reflect my personal opinions on price action, and the market may move completely against this analysis. So, do your own research before opening any position.

The next bull week gonna start soonWe had new ATH around 123K$ and market is now facing some correction and fall and i think soon we can expect end of this correction and also more gain this time will lead price to new ATH at least around 137K$.
it seems that red trendline is not broken yet and for confirmation of breakout we need price at least stay above 116K$ and close daily candle above there.
DISCLAIMER: ((trade based on your own decision))
<<press like👍 if you enjoy💚

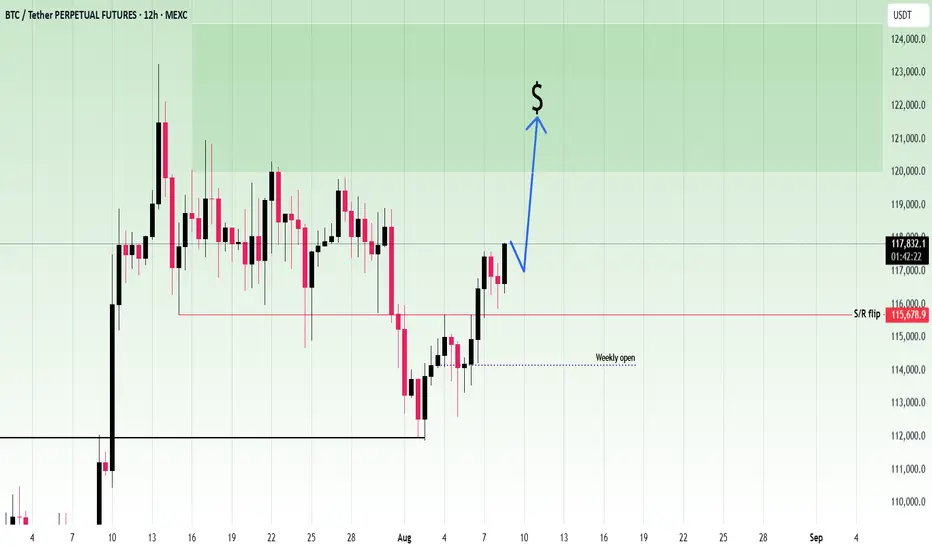
BTC-What is likely going to happen.BTC close back inside the range(S/R flip)
The liquidity above 119k is likely going to get tapped if BTC holds inside the range
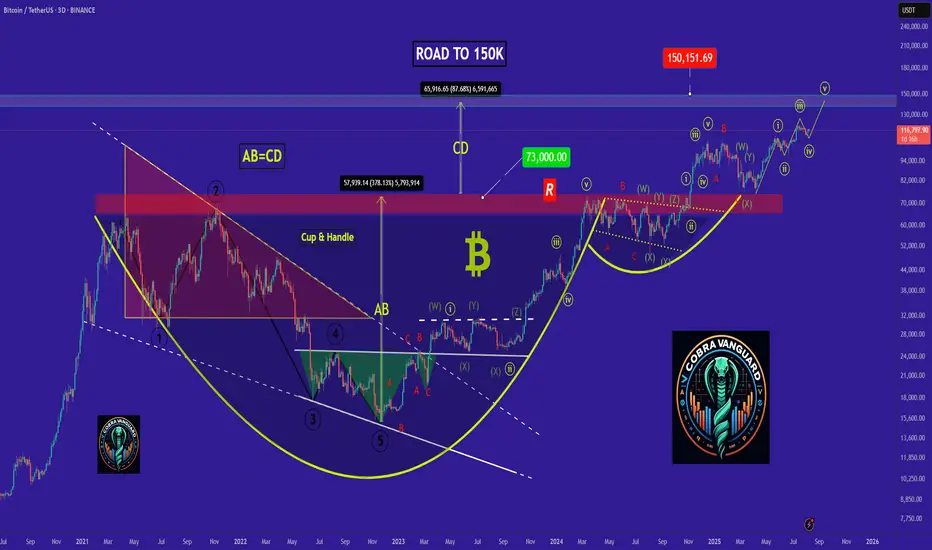
Bitcoin 3D · $137000 Next Target & The Altcoins Market & MercuryBitcoin continues to look awesome. The next target is $137,000 short to mid-term, let's say within 1-2 months. Certainly Bitcoin will continue growing after this target. It comes up and we know when this level is reached there will be a stop. Just as Bitcoin stopped after reaching $123,000. A small pause, a small retrace and then more growth.
We are now in the more growth phase, you are looking at 3D candles. Just today, 11-August 2025, a new 3D session started and as you can see, full green. Bitcoin is now trading at is highest price ever since the all-time high. At resistance, challenging resistance, ultra-bullish.
There are many signals that support a bull market, bullish growth, bullish continuation, bullish impulse, bullish resumption, bullish trend and long-term growth. One of the strongest signals comes from the altcoins.
When Bitcoin consolidates at a high price, it is hard to know if the next move is down or up, the market always goes into a frenzy and half go SHORT the other half go LONG.
You don't have to guess. If the altcoins are rising while Bitcoin is consolidating, this means that the consolidation will lead to additional growth. If the altcoins are dropping while Bitcoin is consolidating, this means that the consolidation phase will end as a breakdown with lower prices.
We see the altcoins growing; we saw the new multiple years high Ether (ETH) did. We know how the smaller altcoins are performing after looking at hundreds of charts. We know the market is not red. We know some are lagging behind or some are way ahead... We know, we know, we know... We know the market is painful when it is bearish; we know the market is quite generous when it is set to grow.
The market does not discriminate between down or up. When it is going down, it will activate all of your stop-loss and beyond. When it is going up, it will fill up all of your sell orders and then go higher... That's how the Cryptocurrency market works.
We are set for the final stage of the bull market, for Bitcoin. For some projects the bull market starts now and will go for years on end. There will be strong variations. Allow for strong variations. I already adapted and this will be a great development because opportunities will be available always. This is the turning point. Mercury stations direct today.
Namaste.

BITCOIN PREDICTION: a SECRET PATTERN is FORMING (watch out)!!!Yello paradisers! In this Bitcoin prediction, I'm updating you about the crash we predicted earlier in previous videos. I'm showing you on a high timeframe chart the ABC corrective mode wave; we are now forming the C wave. The C wave subdivides itself into five smaller waves because it's a motive mode wave. We are taking a look at the volume. We understand that bears are still in power, so we are waiting for some nice volume from bulls. We are spectating a bullish divergence on the MACD indicator. On RSI, there is exaggerated bullish divergence, and in stochastic RSI, we are in an oversold area.
Then, we are shifting our focus to a medium timeframe. We are zooming into the fourth wave, where we are making our sub-waves right now. On the medium timeframe, we are also spectating bearish divergence. We are waiting for the second booby that will basically increase the probabilities of absorption.
As we have seen previously, that helped us to predict that Bitcoin will be crashing. We are also taking a look at our head and shoulders target, which is at $109,000.
Then we are shifting our focus to a lower timeframe, where we are seeing the secret pattern, triple three. Right now, we are creating a sub-wave XX, which is forming itself as a possible zigzag. Paradisers, make sure that you are trading professionally, focus on long-term growth, and avoid get-rich-quick schemes. Any shortage in trading usually ends up sooner or later in bankruptcy.
Remember, don’t trade without confirmations. Wait for them before creating a trade. Be disciplined, patient, and emotionally controlled. Only trade the highest probability setups with the greatest risk to reward ratio. This will ensure that you become a long-term profitable professional trader.
Don't be a gambler. Don't try to get rich quick. Make sure that your trading is professionally based on proper strategies and trade tactics.

Why BTC Remains Bullish and Its Next Potential Move !bitcoin has completed and broken the ascending triangle in the daily timeframe, The price is currently supported well, which can increase the price. I expect the price to rise to around 119k .
Stay Awesome , CobraVanguard
bitcoin - Time to buy again!The price seems to have completed the fourth corrective wave, and from now on, it's time for a price increase, which will continue up to around $150k .
previous analysis
Bitcoin is super bullish (4H)This analysis is an update of the analysis you see in the "Related publications" section
If you’ve been following our previous analyses, we had a bullish outlook on Bitcoin from the lower green zone.
An important level on the Bitcoin chart has been reclaimed, and it is expected to move toward the next targets if it consolidates above the red box.
The targets are marked on the chart.
A daily candle closing below the invalidation level will nullify this analysis.

Bitcoin soon above 123K again enter long near 0.61% Fib support The price can pump without touching our entry because market is gonna start next phase pump ASAP but we put our short-term signal on one of the major support which is 0.61 Fib retracement level and also trade is 1:3(Risk: Reward).
for long-term view and CRYPTOCAP:BTC target which is 137K$ in my mind take a look at daily chart linked below.
DISCLAIMER: ((trade based on your own decision))
<<press like👍 if you enjoy💚

Next Volatility Period: Around August 13th (August 12th-14th)
Hello, fellow traders!
Follow us to get the latest information quickly.
Have a great day!
-------------------------------------
(USDT 12M Chart)
A lot of money has been flowing into the coin market through USDT.
A decline in USDT indicates capital outflow from the coin market.
(USDT.D 12M chart)
As USDT continues to rise, its dominance naturally rises.
However, if USDT is used to purchase coins (tokens) in the coin market, its dominance will decline.
USDT dominance peaked in 2022 and is showing a downward trend.
This indicates that a significant amount of capital flowing into the coin market was used to purchase coins (tokens).
USDT dominance is expected to fall to around 2.84 this year before beginning an upward trend, marking the end of its three-year bull market.
I believe this trend will inject new vitality into the coin market.
For the coin market to maintain an upward trend, USDT dominance must remain below 4.91 or show a downward trend.
If this fails and the price rises above 4.91, the coin market is likely already in a downward trend.
A decline occurred on May 8, 2025, creating a reverse trend.
To maintain this reverse trend, we need to see if it can fall below 4.24.
If USDT dominance declines, the coin market is likely to show an upward trend.
------------------------------------------------------
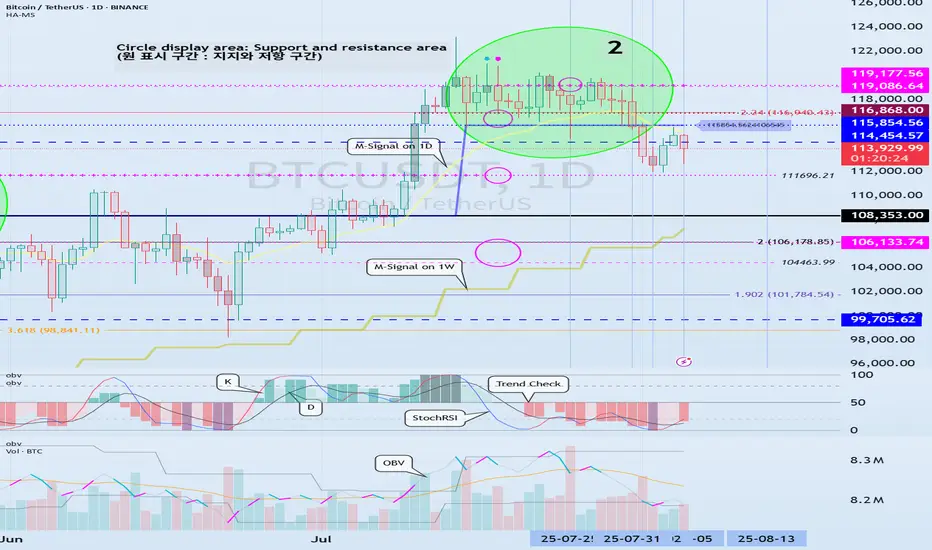
(BTCUSDT 1D chart)
As the new week begins, the HA-High indicator on the 1W chart is showing signs of forming a new level at 114454.57.
Accordingly, the key question is whether the price can rise after finding support in the 114454.57-115854.56 range.
The formation of the HA-High indicator means that the price has fallen from its high.
This also means that further declines are highly likely.
Therefore, if possible, the price should rise above the 114454.57-115854.56 range and maintain its upward momentum.
This period of volatility is expected to last until August 6th.
Therefore, the key question is whether the price can rise above the 114454.57-115854.56 range after the volatility period.
If not, we assume the price will decline until it meets the HA-Low indicator and consider countermeasures accordingly.
This is because the HA-Low and HA-High indicators are paired.
As the price declines, indicators such as the HA-Low or DOM(-60) may appear.
Therefore, if the price declines, you should monitor for the emergence of indicators such as the HA-Low or DOM(-60).
The basic trading strategy is to buy between the DOM(-60) and HA-Low ranges and sell between the HA-High and DOM(60) ranges.
-
If the price falls below the M-Signal indicator on the 1D chart, it is highly likely that the trend will be re-established upon meeting the M-Signal indicator on the 1W chart.
Therefore, if the price fails to rise to the 114454.57-115854.56 range, it is highly likely that the price will eventually meet the M-Signal indicator on the 1W chart.
At this time, a key support and resistance level is expected to be around 108353.0.
When new support and resistance levels are formed, they must remain horizontal for at least three candlesticks to function as support and resistance.
In other words, the HA-High indicator on the 1W chart is showing signs of forming, but it hasn't yet.
Therefore, if the current price holds this week, it will form next week.
Therefore, for the HA-High indicator to function properly as support and resistance, it must remain horizontal for three candlesticks, or three weeks.
This rule must be acquired through significant time and observation.
-
If you sold partially in the 115854.56-119177.56 range according to your basic trading strategy, you will find it easier to observe the current movement. If not, you will likely become anxious.
The key to trading is maintaining a stable psychological state.
If you begin to feel anxious, you should consider how to stabilize your psychological state.
Otherwise, you'll end up making the wrong trades.
-
Thank you for reading to the end.
I wish you successful trading.
--------------------------------------------------
- Here's an explanation of the big picture.
(3-year bull market, 1-year bear market pattern)
I'll explain more in detail when the bear market begins.
------------------------------------------------------