BTC/USD 1h chart Pateern.From this updated chart, "TARGET POINT" label more clearly.
The horizontal green box you marked is roughly between $122,000 and $123,000 (though this seems like a different scale—possibly a derivative or index, not direct BTC price in USD).
The price is breaking above the descending trendline and heading toward that high-volume resistance zone.
The main targets I see from your own chart markings are:
First target: around $118,991 (blue label) — likely the nearest resistance.
Second target: around $120,137 (yellow label) — next key high-volume node.
Final target (your green box): around $122,000–$123,000.
These seem to be based on volume profile gaps and resistance levels.
BTCUSDT trade ideas

BTCUSDT- Why I Took This Trade – Liquidity & Structure ExplainedSTEP 1 - First, I start by marking the higher timeframe structure. On the H4 chart, I saw a market structure shift — signaling that price could be ready to target the sell-side liquidity.
STEP 2 – Liquidity Mapping]
I mark out two key liquidity zones
Buy-side liquidity above the swing high
Sell-side liquidity below the recent lows
Smart money will often target one side before moving to the other.
STEP 3 – CHoCH Confirmation]
On the lower timeframe, we got a Change of Character (CHoCH) — price failed to push higher and started rejecting from the buy-side liquidity zone.
This tells me buyers are losing control.
STEP 4 – Entry Trigger
After the CHoCH, price retraced into a Fair Value Gap (FVG) that also aligned with a bullish order block turned resistance.
That’s my confluence to go short.
STEP 5 – Stop Loss & Target
Stop loss is placed above the swing high for safety.
My target? The sell-side liquidity, where price is likely to run stops before reversing.


Bitcoin (BTC): Looking Back At Last Analysis | Buyers DominateSince last time we looked at the 4-hour timeframe, we have had a good 7% upside movement, where price is now back in our sideways channel, giving us another opportunity for a potential breakout to happen and proper buyside movement to start!
So we wait out today, and if buyers maintain current zones, we are going to look from a different angle!
Swallow Academy

"BTCUSDT – Rounding Bottom Breakout with Demand Zone Support"Bitcoin is forming a strong rounding bottom pattern on the 4H chart, indicating a potential bullish continuation. Price has broken above the range and is now retesting near the demand zone at 118,000 – 116,000 USDT. If buyers hold this level, the next target sits near the weak high at 122,000 and potentially the major resistance at 128,000 USDT.
Key levels to watch:
Support: 114,000 – 116,000 USDT (demand zone)
Resistance: 122,000 and 128,000 USDT
Pattern: Rounding Bottom, bullish structure after ChoCH confirmation.
This is a technical analysis idea, not financial advice. Please manage risk accordingly

BTC is in the 4th wave zone.BTC is in the 4th wave zone. Key support at 108.8K — as long as price holds above, targets at 123K and 130K remain in play. A break below cancels the scenario.
#BTCUSD #Bitcoin #ElliottWave

Bitcoin’s Coiled Spring — Direction Unknown
Today’s CPI Will Decide Which Way Bitcoin’s Coiled Spring Will Launch .
Just a Slightly Lower CPI Than Expected Could Be Enough to Unleash Bitcoin’s Coiled Spring, Sending It Exploding Upwards .
If CPI Comes in as Expected, the Market Is Unlikely to Show Any Surprises and Will Probably Repeat Its Usual Pattern . However , We Shouldn’t Expect an Early and Clean Break of the $123,000 Resistance Level .
If Inflation Prints Higher Than Expected, We May Need to Shift Our Medium-Term Outlook, as the Multi-Month Bull Run Could Come to a Halt
Suggestion: Given the Drop in Bitcoin Dominance Alongside Its Price Increase, If Any Altcoin Fits Your Strategy for Entry, Consider Opening a Position With a Proper Stop Before the CPI Announcement.
Disclaimer: The information provided reflects my personal analysis and opinion only. It should not be considered financial advice. Always conduct your own research before making any investment decisions.
#Bitcoin #BTC #Crypto #Altcoins #CPI #Inflation #Trading #MarketAnalysis #PriceAction #TechnicalAnalysis #BullRun #Resistance #Breakout #CryptoNews #Investing

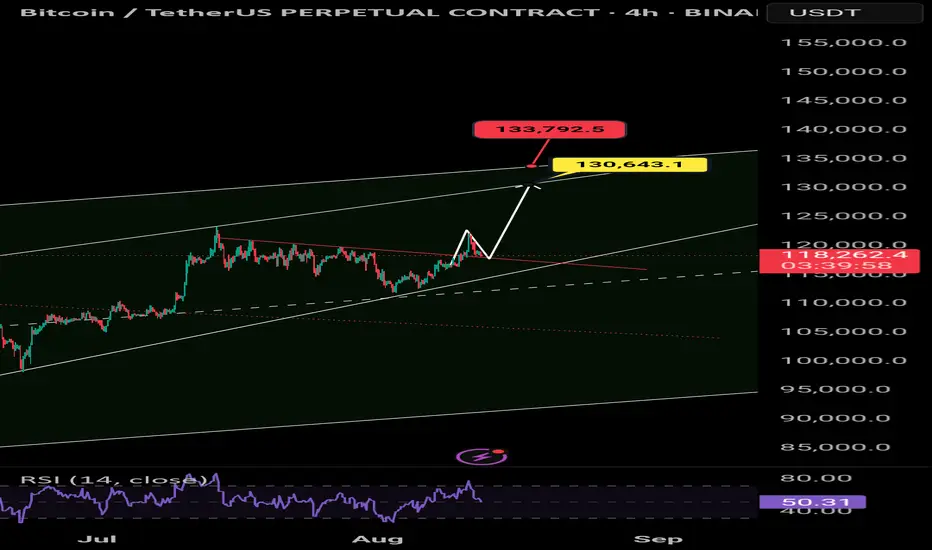
Bitcoin Go 130k Bitcoin is ready to move towards 130,000 after breaking the trend line
Tp1=125500
Tp2=129500
Tp3=130000
Tp4=133000
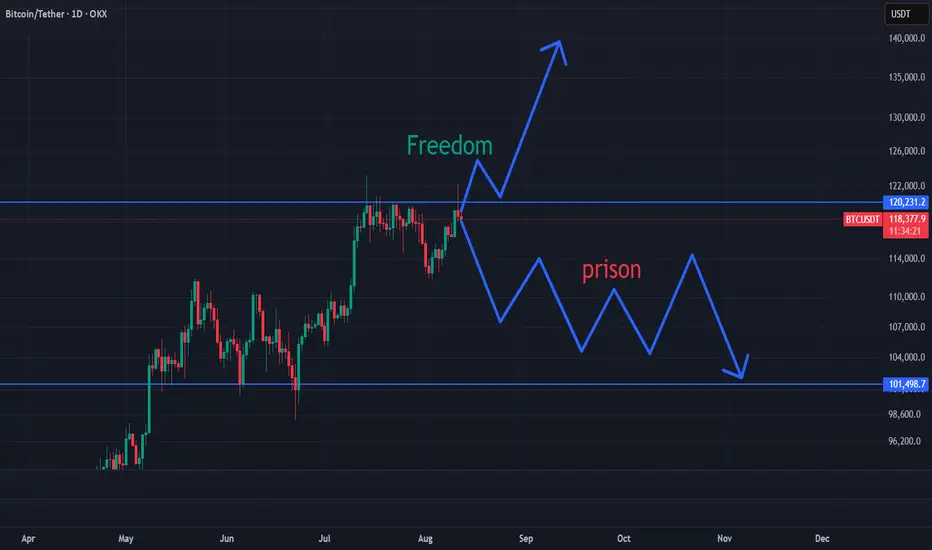
Bitcoin Update Short-Term · Ignore Rejection At ResistanceQuick update and important. This will not change the broader market picture and our view. The market will continue growing long-term.
Here Bitcoin is showing a strong rejection on the daily timeframe coupled with a lower high and rising bearish volume. This can lead to some bearish action. This bearish action can be considered part of the consolidation period below resistance. As Bitcoin moves sideways, fluctuates, the altcoins market should continue to grow.
The bullish bias will be revealed based on the fact that day after day, many new altcoins will continue to break up.
The consolidation period for Bitcoin to break above $112,000 was 48 days. It's been 28 days since Bitcoin challenged $123,000. Do not be distracted, Bitcoin will continue to grow.
If you have any questions, feel free to leave a comment.
» If there is any altcoin you would like me to look at, just leave a comment with the trading pair ticker and I will do a full analysis for you.
Thanks a lot for your continued support.
Namaste.

$BTChold this lots support below
NY should be fun with dominace breaking 60.55% close 2 candles on the h4 below it
bitty back at vwap
lets see what we get long here imo

BTCUSDT 4H BULLISH SETUP.BTCUSDT | 4H Bullish Setup
✅ Price broke above key structure and formed a clean FVG + Bullish Order Block below current price.
✅ SSL liquidity resting just above the demand zone.
🔍 Price is pulling back; possible mitigation expected in 117,000 – 116,500 zone.
📌 Trade Idea: Wait for price to tap into demand zone & confirm bullish signals before entry.
🎯 Potential continuation to the upside after liquidity sweep.

Today we have cpi news so be patient and look for opportunity HI everyone
I hope u all be well and sharp
Today we have CPI news and if its in favor of Risky markets we will all be having good days ahead so prepare and be ready i suggest to enter ur positions before the news come out.
i,m only focusing on Long and don't even think on Short its my strategy so i,m waiting for USDT.D and BTC.D to confirm my entrance.
I look for Alt coins which are strong against Bitcoin.

ICT BTC (2025\8\12)Accumulation Phase – Price consolidates, building liquidity on both sides.
Manipulation (Sweep) – A buy-side liquidity grab occurs, clearing stops above prior highs (Minor Buy Side sweep).
Retracement to Fair Value Gap + Breaker – After the sweep, price is expected to retrace into a confluence zone:
Fair Value Gap (FVG) from previous bullish swing
Breaker block formed from a prior failed high
Distribution to Expansion – After the retracement, bullish continuation toward major buy-side liquidity above 123K–126K.
Key Levels:
FVG + Breaker Zone: ~115,716 – 118,347
Buy-side liquidity targets: 120,998 → 123,218 → 124,302 → 126,000
Bias: Bullish after retracement — targeting liquidity above prior highs.
Notes:
This setup relies on the idea that market makers engineer liquidity grabs before delivering price to higher targets.
Confirmation can come from lower-timeframe structure shifts inside the breaker zone.

BTC ~ are you very bullish?BTC looks so dead, ideal buys goes to the range, means any good buys to hold, else its same you will get trapped anyways

possible BTC longBeen a minute since I posted, but this is the potential trade. I’m looking at at target equal high after the sweep of the Asia low. We’ll see what happens in these next few hours.

BTC Bitcoin Among My Top 10 Picks for 2025 | Price TargetIf you haven`t bought BTC Bitcoin before the recent breakout:
My price target for BTC in 2025 is $125K, driven by the following fundamental factors:
Regulatory Developments Favoring Adoption:
The anticipated regulatory shifts in the United States are expected to create a more favorable environment for cryptocurrencies. With the potential for pro-crypto policies under a new administration, including the establishment of Bitcoin as a strategic reserve asset by major nations, investor confidence is likely to increase significantly. Analysts suggest that such developments could drive the total cryptocurrency market capitalization from approximately $3.3 trillion to around $8 trillion by 2025, with Bitcoin poised to capture a substantial share of this growth.
Increased Institutional Demand through ETFs:
The launch of Bitcoin exchange-traded funds (ETFs) has already begun to transform the investment landscape for Bitcoin, making it more accessible to institutional and retail investors alike. Following the successful introduction of multiple Bitcoin ETFs in 2024, analysts project that inflows could exceed $15 billion in 2025, further boosting demand for Bitcoin. This increased accessibility is expected to drive prices higher as more investors seek exposure to the asset class.
Supply Constraints from Halving Events:
Bitcoin's supply dynamics are fundamentally bullish due to its halving events, which occur approximately every four years and reduce the rate at which new Bitcoins are created. The most recent halving in April 2024 has led to a significant reduction in supply inflation, creating scarcity that historically correlates with price increases. As demand continues to rise while supply becomes more constrained, this fundamental imbalance is likely to support higher prices.
Growing Adoption as a Store of Value"
As macroeconomic conditions evolve, including persistent inflationary pressures and potential monetary policy easing, Bitcoin is increasingly viewed as a viable store of value akin to gold. This perception is bolstered by its finite supply and decentralized nature, making it an attractive hedge against inflation. Analysts suggest that as more investors turn to Bitcoin for wealth preservation, its price could see substantial appreciation

Bitcoin 2 Buy OffersThere are two possibilities for bitcoin .
First is (118,000 - 119,400) area which is in it right now.
If price breaks this zone next step would be (115,800 - 117,200).
The reason that I have little doubt about the first area is that price has been reached near it once and had a re act. So it has less chance for another rise.

Bitcoin (BTCUSDT) Technical Analysis – August 11, 2025📊 Bitcoin (BTCUSDT) Technical Analysis – August 11, 2025
🔹 After breaking the downtrend line, Bitcoin rallied to the key resistance zone at $122,000 before starting a pullback.
📉 Bearish Scenario:
First support: $118,273 (confluence with the broken trendline)
Second support: $117,000
📈 Bullish Scenario:
If BTC bounces from these supports, the first target is $122,000
A strong breakout above this level opens the way to the next target at $129,000
⚠️ Note: Always wait for strong candlestick confirmation before entering any position.
#BitcoinAnalysis #BTCUSDT #Crypto #Bitcoin #TechnicalAnalysis #Cryptocurrency #Trading #PriceAction #CryptoTrading #BTC

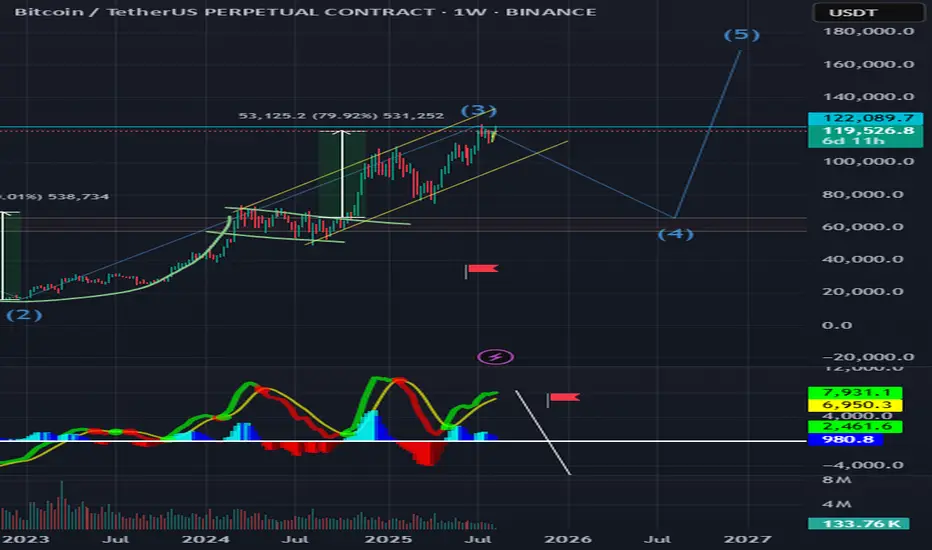
BTC - Cup & Handle Completed, Wave 4 is Coming...The long-term cup & handle pattern has played out, completing wave (3) around the $122K zone. According to Elliott Wave structure, BTC is now likely to enter wave (4), which could mean a deeper correction toward the $60K–$70K range before the final wave (5) push.
Wave 5 could target new all-time highs later, but for now, caution is key — this phase may shake out weak hands before the next rally.
Key Points:
Cup & handle breakout already done.
Wave 3 peak in place.
Wave 4 correction expected before Wave 5 to ATH.
Not financial advice.
BTC is bullish but correcting itself to balance the risk/rewardWe see here the chart, i dont recommed to short btc, but still i think we can expect a short down swing where we could buy some spot positions or call options to sizen up our position.
My data and chartbased analytics about this week:
110-112k - lower support
115-118k - medium support
I'm not lookout for new ATH this month such as 124-126k but its possible. I do look more for longterm ATH in oct. / nov. 2025 by around 145-180k
Feel free to share your opinion in the comments below!

11/08/25 Weekly OutlookLast weeks high: $119,322.97
Last weeks low: $112,665.39
Midpoint: $115,994.18
BTC takes back the spotlight as the week ends! Breaking through the previous weeks high just hours after weekly close and stopping just shy of ATH. This rally comes off the back of a successful bounce from $112,000 area and mirrors the previous weeks drawdown almost perfectly setting up an interesting week ahead.
I am still wary of August seasonality, yes BTC and the broader altcoin market especially ETH have seen great gains so far this month but history shows August is not kind to the bulls;
August '24: -8.74%
August '23: -11.27%
August '22: -13.99%
August '21: +13.42%
August '20: +2.74%
August '19: -4.84%
August '18: -9.0%
Now history doesn't necessarily repeat itself but it does rhyme. Should BTC SFP and accept below the weekly high I would say a $115,000/ Midpoint retest is a logical move. RSI has been posting bearish deviations on HTF (1W&1M) which can suggest a shift in trend is coming but further proof of this would be needed before then
This week CPI & PPI take place on Tuesday and Thursday respectively. With a September interest rate cut on the horizon this data release may be more important than it has been in recent months so I'm keeping a close eye on the result.
Previous: 2.7%
Forecast: 2.8% (+0.1%)
For altcoins many have had great rallies, ETH predominantly after breaking through $4000, again many indicators are showing a local top is due so I am looking at price action context for any clues of a pullback to come, until then the trend is your friend.
Good luck this week everybody!

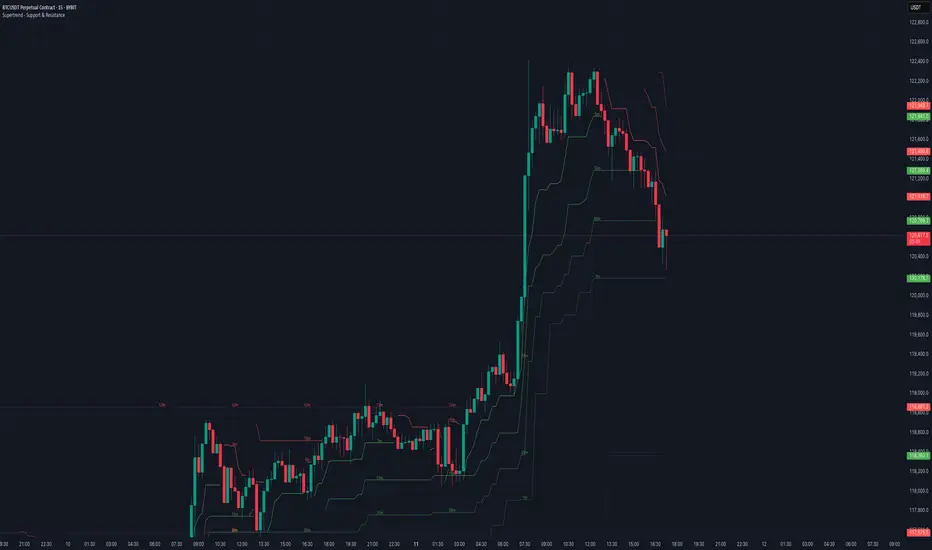
Supertrend – Multi-Timeframe Support & ResistanceSupertrend – Multi-Timeframe Support & Resistance
This script overlays multiple Supertrend bands from higher timeframes on a single chart and treats them as dynamic support and resistance. The goal is simple: see the bigger picture without leaving your current timeframe.
What it does
• Calculates Supertrend using the same ATR Length and Factor across 5m, 15m, 30m, 1h, 4h, 8h, 12h, and 1D.
• Pulls each timeframe via request.security(..., lookahead_off) so values only update on candle close. No look-ahead, no “teleporting” lines.
• Plots each timeframe’s Supertrend as an on-chart band with increasing transparency the higher you go, so you can visually separate short-term vs higher-timeframe structure.
• Colors indicate direction:
• Green = bearish band above price (acting as resistance)
• Red = bullish band below price (acting as support)
• Drops compact labels (5m, 15m, 30m, etc.) every 20 bars right on the corresponding Supertrend level, so you can quickly identify which line belongs to which timeframe.
Why this helps
Supertrend is great for trend definition and trailing stops. But one timeframe alone can whipsaw you. By stacking multiple timeframes:
• Confluence stands out. When several higher-TF bands cluster, price often reacts.
• You see where intraday pullbacks are likely to pause (lower TF bands) and where trend reversals are more meaningful (higher TF bands).
• It’s easier to align entries with the dominant trend while still timing them on your working timeframe.
How it works (quick refresher)
Supertrend uses ATR to offset a median price with a multiplier (Factor). When price crosses the band, direction flips and the trailing line switches sides. This script exposes:
• ATR Length (default 10): sensitivity of the ATR. Smaller = tighter band, more flips. Larger = smoother, fewer flips.
• Factor (default 3.0): multiplier applied to ATR. Larger = wider band, more conservative.
The same settings are used for all timeframes for clean, apples-to-apples comparisons.
How to use it
• Trend alignment: Prefer longs when most higher-TF lines are below price (red support). Prefer shorts when most are above price (green resistance).
• Pullback entries: In an uptrend, look for pullbacks into a lower-TF red band that lines up near a higher-TF red band. That overlap is your “zone.”
• Breakout confirmation: A strong break and close beyond a higher-TF band carries more weight than a lower-TF poke.
• Stops and targets: Use the nearest opposing band as a logic point. For example, in a long, if price loses the lower-TF red band and the next higher-TF band is close overhead, trim or tighten.
Signals you can read at a glance
• Stacking: Multiple red bands beneath price = strong bullish structure. Multiple green bands above price = strong bearish structure.
• Compression: Bands from different TFs squeezing together often precede expansion.
• Flip zones: When a higher-TF band flips side, treat that level as newly minted support/resistance.
Design choices in the code
• lookahead_off on all request.security calls avoids repainting from future data.
• Increasing transparency as the timeframe rises makes lower-TF context visible without drowning the chart.
• Labels every 20 bars keep the chart readable while still giving you frequent anchors.
Good to know (limits and tips)
• This is an overlay of closed-bar Supertrend values from higher TFs. Intrabar moves can still exceed a band before close; final signal prints at candle close of that timeframe.
• Using the same ATR/factor across TFs makes confluence easier to judge. If you need independent tuning per TF, you can clone the security calls and add separate inputs.
• On very low timeframes with many symbols, multiple request.security calls can be heavy. If performance drops, hide one or two higher TFs or increase the label spacing.
Risk note
This is a context tool, not an auto-trader. Combine it with structure (HH/HL vs LH/LL), volume, and your execution rules. Always test on your market and timeframe before committing real capital.