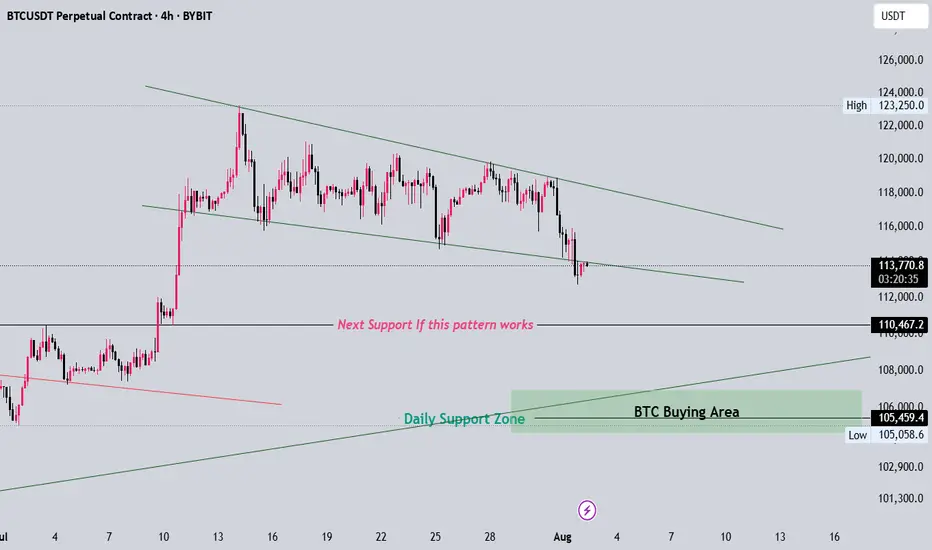
BTC Retests Broken Channel as Daily Support Holds📉 On the 4H chart, CRYPTOCAP:BTC has broken below its descending channel and is now testing the underside — a classic retest zone where bulls and bears collide 👀
📆 Meanwhile, the Daily timeframe shows price still holding above the key 11800 support level 🛡️
This zone remains pivotal — a bounce could reclaim momentum, while a failure might trigger deeper downside.
The next few candles will be critical for directional clarity.
Are we about to reclaim the structure or head lower from here?
Not financial advice.
BTCUSDT trade ideas

mBos 15mWe came to 4h OB, swiped some liquidity and received a reaction. Expectations for the price to return back to the wick and continue up to take the liquidity there. As there is no break on the HTF, it is a trade with higher risk.
Entry on the test of 15m wick. Stop below wick. Take on the swim of EQH

BTC LONGAfter major pullback Bitcoin takes Support. Our Algo-based Indicators also showing their first BUY-Signal with Alert.

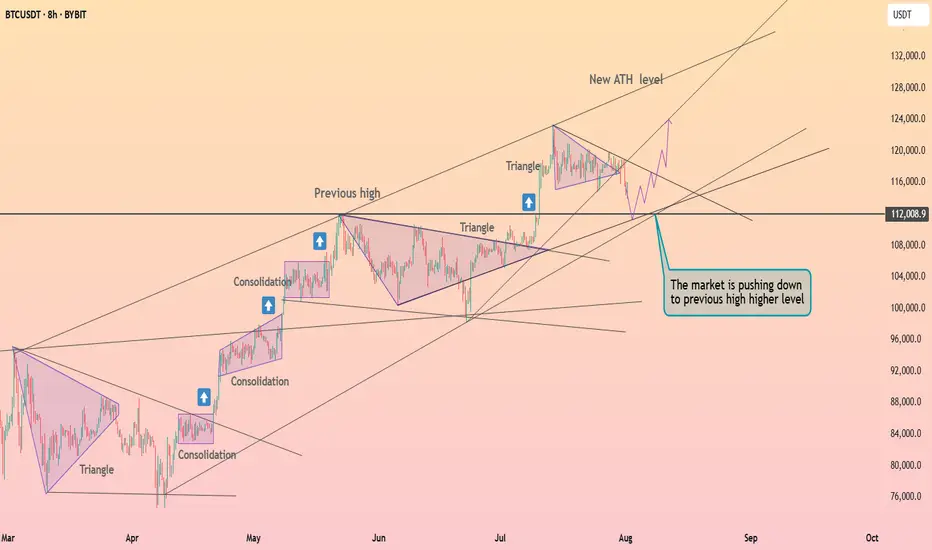
BTC next bull run after taking restAs is clear, BTC has made a new high, and we should wait for the next bullish entry after a retracement.
BTC- On a Crucial Testing PointBTC Seems to be testing a strong support point, if it bounce back , it's good opportunity to buy, otherwise sell.
BTC/USDT Long Setup - Dual entry position
🟢 BTC/USDT Long Setup – Dual Entry Position
I’m going to be positioned long on BTC with two entries:
Entry 1: 109K if don't holds
Entry 2: 101k
Stop-loss: 97K
Target: 148.5K
R/R: ~5.4:1
Reasoning:
Market structure remains bullish with clean higher highs and higher lows.
The recent selloff is seen as a healthy pullback into a demand zone — not a trend reversal.
Both entries are placed to catch either a shallow bounce or a deeper liquidity sweep without overexposing risk.
Setup remains valid unless we see a clean daily close below 97K.
Letting price play out — no mid-range noise, no overtrading. Focused on structure, trend, and reward.
---

BTC190000 soonthis is way to btc going to 190000 soon or late after that i say btc should have very massive sell
but befor that we nead to btc go to up 190000

AUDIO Uptrand Soon ✏️ Use less funds 5% - 10%
💥 Wait & Get The Best Entry
🦊Pair : AUDIO/USDT 🟢
🐢 SPOT
🏎️ Buy :
♻️ 0.0555
♻️ 0.0540
🎉️Sell -
💵 0.0664
💵0.0779
daily BTC analysis Bitcoin breaks the $115,000 level and approaches $112,000. Personally, I expect this level to be unsustainable and the next level is $110,000. This analysis is not financial advice in any way.Crypto Futures Trading Could Destroy All Your Money

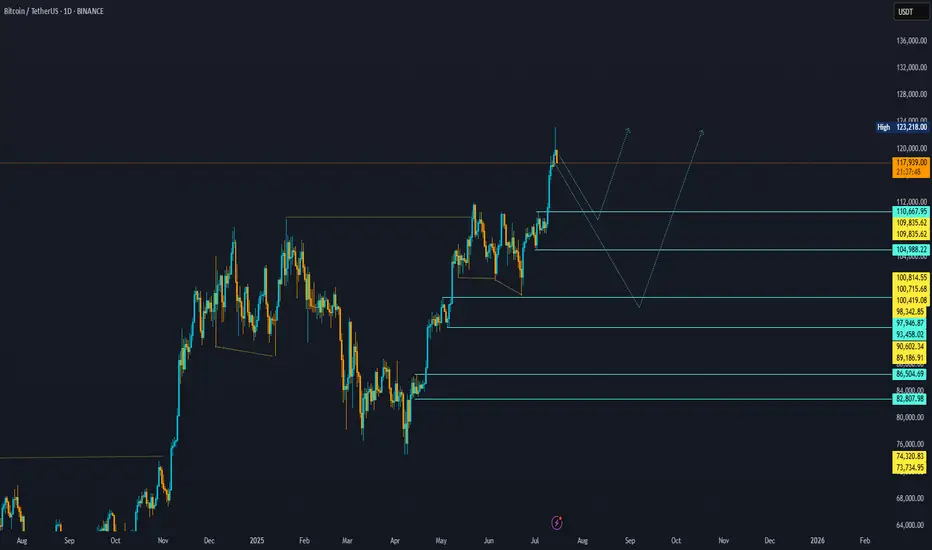
BTCUSDT 1D – Retesting Key Support, Will Bulls Hold the Line?Bitcoin is retesting a crucial structural support level around $112K after its recent local top near $120K. This zone previously acted as resistance and is now being tested as support — a textbook bullish continuation signal if it holds.
Historically, these flips (from resistance to support) have triggered strong upside momentum, as seen after the $78K breakout earlier this cycle. However, failure to hold this level could open the door for a deeper correction toward $100K or even the $90K region.
This chart outlines the major structural zones:
Long-term accumulation base near $70–78K
Resistance flip zone at $110–112K
Local resistance near $120K
📌 If bulls defend this zone and reclaim momentum, we could see another push toward cycle highs. If not, patience is key — the next high-conviction entry may come lower.
How are you positioning around this zone? Let me know in the comments 👇

btc short tradeon 1hr timeframe btc take the inducement and on 15m done MSS and now rice going to retest the 15m advanced oder block
entry 19131
stoploss 120990
target 1; 114685
target 2 ; 113650

#BTC Update #14 – Aug 02, 2025#BTC Update #14 – Aug 02, 2025
Unfortunately, Bitcoin has closed below its current channel and now appears to be retesting that level. If this retest confirms, I expect a pullback down to the $110,000 zone. However, if Bitcoin manages to re-enter the channel, its first target will be $118,800. Although it’s a descending channel, moving within it suggests a relatively stable market. Closing below it may not end well and could deepen the retracement. That's why I recommend caution with all coins right now.
Even though it seems like a distant possibility at the moment, don’t forget there’s also an imbalance zone around the $103,500 level. A sharp wick or a significant drop could bring Bitcoin back to revisit that area. The probability is currently low, but it can’t be ruled out completely. I don’t recommend rushing into any long or short positions at this stage.

BTC Clear Idea if this pattern worksFor now please observe some time if btc breaks down to next target which is arround 110k then btc will definetly move towards 105k becuase that is its daily trendline support
Is the #BTC pullback over?📊 Is the #BTC pullback over?
🧠From a structural perspective, a bearish structure has formed on both the 1-hour and 4-hour charts, so we should be wary of the risk of a further pullback.
➡️Resistance is the area formed by the two necklines (114675-115729).
Support is primarily the overlap between the yellow and green areas (110000-111688). If we can establish a bullish structure on the 1-hour chart here, we still have a chance of continuing the bullish trend.
🤜If you like my analysis, please like 💖 and share 💬 BITGET:BTCUSDT.P

_Bitcoin Update
Bitcoin broke below on our local PBr2 support at 115.7k range keylevel panda fam this is a sign of first mini bearish breakout, But bitcoin price is now sitting at H4 PBr1 support keylevel 113.4k range.
Two case scenario possible for bitcoin:
1.) White broken lines — a bounce back with new swing high confirmation for reclaim back on structure for possible next major trend resistance breakout | BULLISH BIAS 🐂
2. ) Red broken lines — retest at PBr2 as local resistance and possible drop until white box support at 111.2k range area | BEARISH 🐻
In this case while bitcoin is ondecision panda fam we need to consider both case scenario with a short term possibilities but the best thing here is we already know where are the importance keylevel S / R to observe not just a random keylevel. 💯
ℹ️ : @pandanambawan

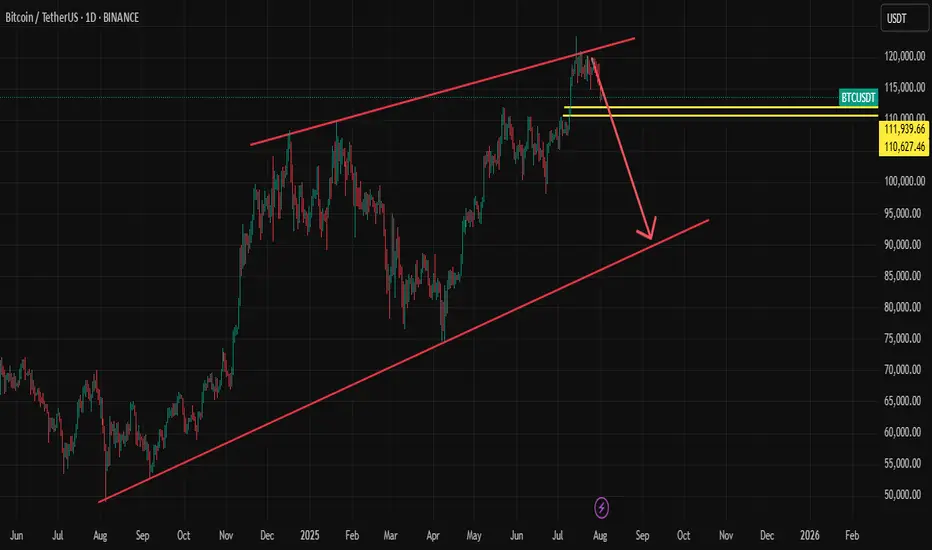
Reversal from Channel Bottom or a Real Breakdown? Identifying th
🎯 BTCUSDT - Analysis
🔹 Analysis Date: 1 August 2025
📉BTCUSDT:
Price is currently moving inside an ascending channel and has touched the bottom of the channel again, offering a potential buy opportunity.
However, for those seeking a low-risk entry, the zone around 118,000 could be ideal—if price returns to the channel and confirms support.
Although it seems the channel’s lower boundary might break, this could be a fake break to mislead traders before a rebound.
The support at 110,000 is a crucial short-term level; if it fails, a deeper correction toward 98,090 or even 94,000 is likely.
Our targets remain at the upper boundary of the channel.
⚠️ Risk Management Tip: Wait for confirmation near 118,000 if unsure, and always size positions based on overall volatility.

BTC ReaccumulationI'm watching here either for a local model 1 which forms a MTF accumulation model 2 or a model 1 which deviates the range one more time. There is a nice build up of liquidity to the upside but sadly no clear model 2 POI. The technical target if the model gets confirmed will be the range high but i would expect to see a new ATH. Let's see.

BTC CLS RANGEWaiting for the daily candle to close inside of the range as seen on the graph with the horizontal line.
Then I will be immediatly looking for an entry, either a FVG or a OB or an IFVG. (I will update the entry points asap)
Then I will target 50% of the range as seen on the graph market 0 .5 on the fibonacci retracement where I will take 75% of the position.
Then I will set my SL at my entry price and target the opposing range or LQ which is at 119500-120000K

BTC/USDT Analysis – Negative Sentiment Returns
Hello everyone! This is the daily analysis from the trader-analyst at CryptoRobotics.
Yesterday, Trump officially imposed tariffs on 68 countries, which are set to take effect on August 7. The legality of these tariffs is already being challenged in court. The market reacted extremely negatively to this development — despite the overall positive technical setup and volume distribution, Bitcoin dropped to $114,000, deeply testing the volume zone and local lows.
Despite all of this, the bullish scenario should not be ruled out. The price action during the decline has been weak: while selling pressure is high, it has not led to a full breakdown of the lows. At this stage, it’s better to avoid opening new positions. Consider long setups only after a test of the $117,600–$118,600 supply zone, and watch for a buyer’s reaction on the retest.
If negative momentum continues, the price could drop further to the next support zone.
Buy zones:
• $110,000–$107,000 (accumulated volumes)
Sell zones:
• $117,600–$118,600 (accumulated volumes)
This publication is not financial advice.

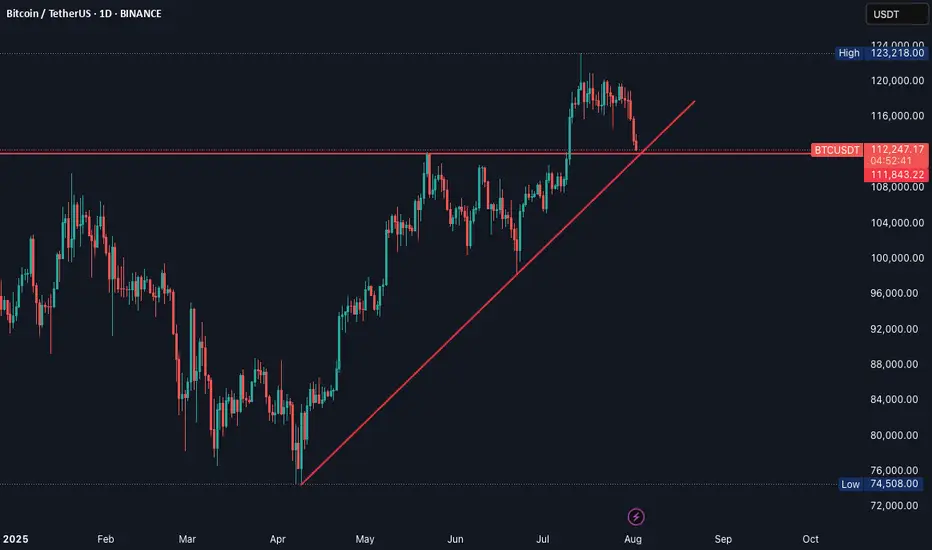
Bitcoin exited from the triangle ┆ HolderStatBINANCE:BTCUSDT is dipping to retest $112,000, the last breakout level. The price remains inside a large ascending triangle and may soon resume its uptrend. If this support holds, targets above $125,000 come back into play.
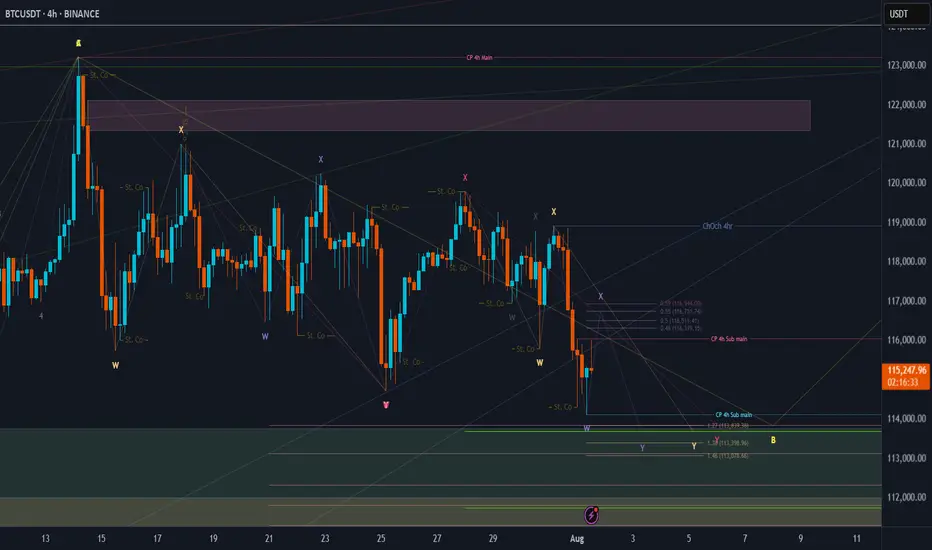
BTC Price Prediction and Elliott Wave AnalysisHello friends,
>> Thank you for joining me in my analysis. We have finished the pink X wave directly, then we have gone to the final pink Y wave, which consists of wxy in orange counting. Now we are moving into the final Orange Y wave.
>> our confirmations:
* 4Hr TF: Breaking 118990 for the next hours, we will end the whole Yellow B "correction" wave successfully. .
Keep liking and supporting me to continue. See you soon!
Thanks, Bros
BTC/USDT Analysis – Bullish Pennant Holds Key to $150,000 TargetBINANCE:BTCUSDT is holding just above $115,000, recovering from a 2.4% dip in the last 24 hours, with one technical setup dominating the conversation: a bullish pennant on the 3-day chart.
The pattern formed after a sharp 25% rally earlier this month, creating a classic pole-and-pennant structure. Multiple breakout attempts have failed so far, with long wicks signaling heavy volatility, but the pattern remains valid as long as the BINANCE:BTCUSDT price stays above the $114,000 support zone.
A confirmed 3-day candle close above $119,700—the top of recent failed breakouts—would likely trigger the next leg higher. A measured move from the pole projects an upside target near $150,000, aligning with long-term bullish expectations.
Supporting this setup, the Fund Flow Ratio has been making lower highs, suggesting fewer coins are heading to exchanges and potential sell pressure is easing. At the same time, Chaikin Money Flow (CMF) on the 3-day chart is forming higher highs, signaling quiet accumulation despite recent price dips.
Until either level breaks, BINANCE:BTCUSDT trades in a pivotal range. Bulls want a clean breakout above $119,700, while a drop below $114,000 would invalidate the pattern and open the door to further downside.
