Bitcoin (BTC): Either $108K or Back Above $117KBTC is in a volatile position, where purely on a chart we can't really tell whether we might be heading up or down from here.
What we noticed, though, is the order books orders near lower zones, where buyers have set few buys, possibly hinting to potential bullish movement to happen.
So what to keep in mind here?
1) Keep an eye on that bearish CME gap, which might be filled and marked as smaller target for short
2) Before we see either a breakout from the 117K area or a breakdown from the $108K zone, we should not enter into any early trades here on the current timeframe.
Swallow Academy
BTCUSDT trade ideas

Warning : BTC 69000 Soon!!!! The current Bitcoin price will not hold!!!!
I’m calling for a sharp and decisive fall toward 69K. This is not based on standard TA patterns — it’s from a broader view of market cycles, sentiment extremes, and the unsustainable nature of the current rally.
Too much leverage, overconfidence, and speculative positioning have built up. The conditions are set for a cascade that will catch most traders off guard. When it starts, it will move faster than most expect, and the narrative will shift from euphoria to panic.
My target is clear: 69K. This is not a warning of a small dip — this is a call for a major reversal.
Not financial advice. This is my forecast.

continue to increase in price, towards old ATH💎 BTC WEEKLY PLAN UPDATE (11/08)
1. Overall Trend:
BTC has completed a 5-wave Elliott impulse and is currently in a corrective phase after wave (5).
The main trend remains bullish, as the wave structure has not broken and price is still above key EMA lines.
2. Fibonacci Levels:
The current correction may retrace to the following Fibonacci support levels:
• 0.382 Fibo: ~118,800 USD (aligns with strong support)
• 0.5 Fibo: ~117,800 USD (close to EMA and trendline)
These are potential price zones where the market may rebound.
3. Support & Resistance Zones:
• Near-term Support: 118,000 – 117,500 USD (combination of Fibo + EMA + broken trendline).
• Near-term Resistance: 120,000 USD (previous high).
• Next Resistance: 122,000 – 123,000 USD (Fibo extension target 2.618).
4. Main Scenario:
BTC retraces to 118K – 117.5K → rebounds → breaks 120K → moves towards 122K – 123K.
5. Trading Notes:
• Prioritize entries when price reacts well at 118K – 117.5K support zone.
• Stop loss if H4 closes below 117K.
• Stay patient, as corrections are normal before the next upward move.
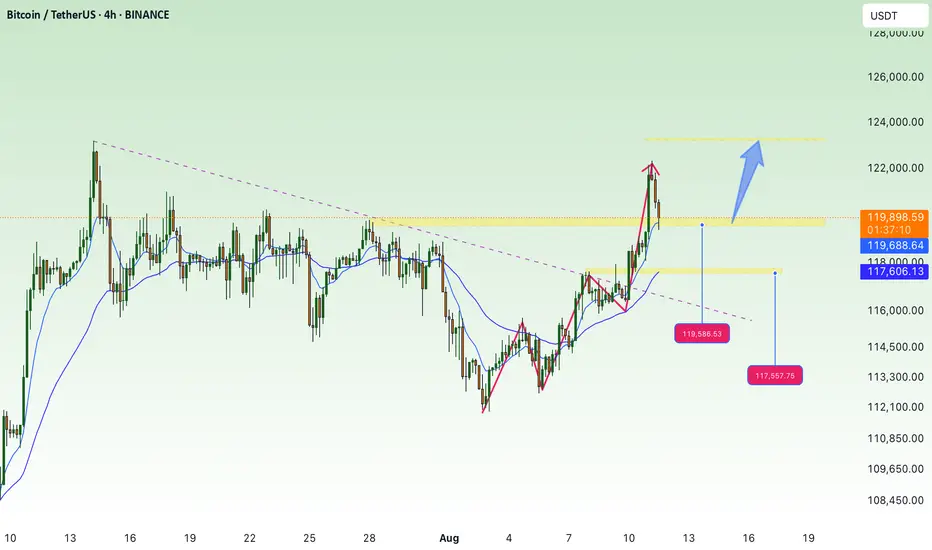
BTC-What is likely going to happen.BTC close back inside the range(S/R flip)
The liquidity above 119k is likely going to get tapped if BTC holds inside the range
What is likely going to happen.BTC close back inside the range(S/R flip)
The liquidity above 119k is likely going to get tapped if BTC holds inside the range.

LETS FRKN GO!!!!2 days ago I released a 'Make or Break' video
It is with GREAT joy that I say I'm made!
My high ideals of revolutionizing the trading game is materializing...there's no counter argument
THANK YOU for all of the amazing humans who have been apart of my journey.
LETS FRKN GO!!!!

Bitcoin above $116k ┆ HolderStatOKX:BTCUSDT reclaimed the 115k pivot after breaking a local channel that formed within a larger wedge. The surge from triangle consolidation, followed by a controlled pullback and higher‑low, suggests accumulation rather than distribution. As long as 113–115k holds, targets line up at 118.5k, 121k and the extension toward 124–126k along the rising trend fan. Only a decisive close below 112k would invalidate the immediate bullish bias and reopen 109–110k. For now, constructive momentum and structure favor continuation.

Buying Idea For BITCOIN
dont be aggresive dont be greedy
Trading is 80% of waiting 20% (open position, money management, etc)
Lets wait and see BINANCE:BTCUSDT

End of Bitcoin's Bull CycleEnd of Bitcoin's Bull Cycle: Is October 2025 the Final Peak?
"This is my personal opinion and does not constitute any investment advice."

Is a move towards $124,000 Bitcoin rose above $118,000 today, breaking its technical ascending channel. Meanwhile, the New RSI has increased and is showing signs of bullish momentum. Is a move towards $124,000
This analysis is not a financial recommendation. Crypto is a very risky market and you may lose some or all of your money in it. Especially futures trading.

BitcoinMy previous path was correct, now let's see if this is the right path to show me what I'm doing next.

$BTC Head and shoulders forming....elevator to 110kOver the last few days BTC has been in a downward channel and recently got a boost from the not so "free market" Trump's policies to open up highly volatile crypto to people looking to save and retire. One would expect a much bigger spike, but 117k resistance seems to be holding firm and retailers appear to be the exit liquidity for institutions. No crystal ball on where BTC will be, but there will be massive volatility along the way and in the short term 110k (or below) seems to be very much in the realm of possibilities. We're in a recession and all the lagging indicators are showing red flags. Enter BTC at your OWN RISK! If you're up, take your profit. If you're down, check out other strategies (like VIX strategies for downside protection).

BITCOIN LONG Bitcoin is currently trading in a up trend so looking at a continuation trade to the upside. Trendline is strong matched with a strong support level for a good looking entry.

$BTC bouncing over crucial support!CRYPTOCAP:BTC is currently pulling back from the $123K resistance area, heading toward a major confluence support zone between $107K–$110K, which aligns with:
✅ Previous breakout zone
✅ 0.5–0.618 Fibonacci retracement
✅ Lower bound of the ascending channel
✅ 200 EMA support
This level is expected to attract buyers and act as a strong base for the next bullish leg.
Price dips into the $107K–$110K support
Look for a bullish reversal (reaction candles or bullish divergence)
Target 1: $128K – retest of resistance
Target 2: $132K – upper boundary of the ascending channel
CRYPTOCAP:BTC remains within a healthy bullish structure.
This pullback is constructive, not bearish.
The $108K–$110K zone is a high-probability long setup — wait for bullish confirmation before entering.
A daily close below $106.8K would invalidate the structure and open up downside risk.

Make or Break. This next move is a big deal for me personallyTo stand behind the AI I have gone all in on this next move
Many things can go wrong, including a wick that liquidates my position, me getting in too soon or perhaps the AI did as well as it could until now, but did not get the next move correct.
Whatever happens, I'm all in. (this is not to say you should do the same, its to say I believe in my craft and am backing it with massive action).
Lets see what the Bitcoin Gods have in stall

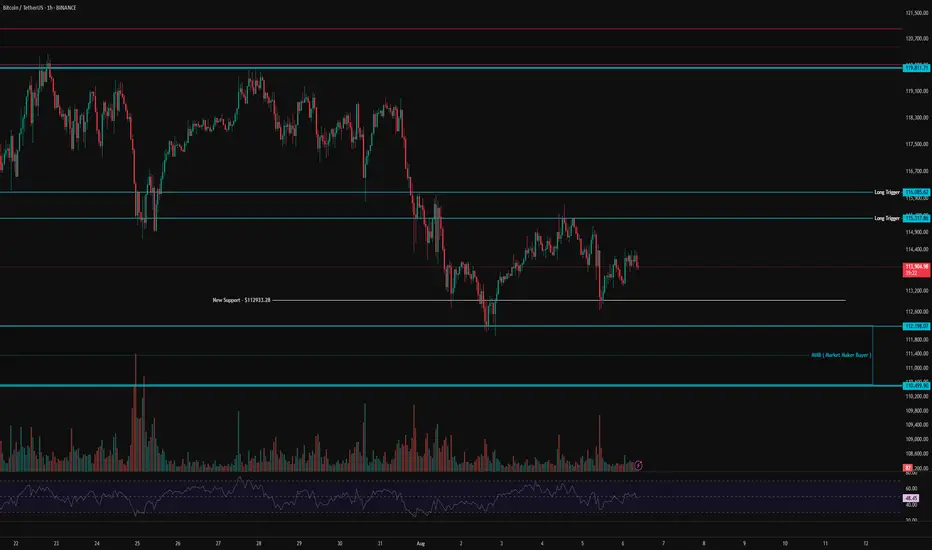
BTC 1H Analysis – Key Triggers Ahead | Day 3💀 Hey , how's it going ? Come over here — Satoshi got something for you !
⏰ We’re analyzing BTC on the 1-hour timeframe .
⏱ We’re analyzing Bitcoin on the 1-hour timeframe.
👀 After bouncing from the current $113,000 area, Bitcoin moved upward, indicating the presence of market maker buyers in this zone. A short-term support has formed at $113,000, and yesterday we saw a strong rejection from this level, which helped prevent further selling pressure.
Bitcoin now faces a resistance zone and a potential long entry trigger between $115,317 and $116,085. If long positions increase and short positions get squeezed, this resistance could be broken, potentially fueling a bullish move.
⚙️ On the RSI, our key level is the 50 range. A confirmed hold above this level could signal a higher low forming relative to the previous bottom at $112,933.
🕯 We’re seeing an increase in trading volume, and as the price moves closer to $110,499, there's a noticeable liquidity pull from long positions—more buyers are stepping in around this area.
📈 Our long position trigger lies within the resistance zone mentioned. A confirmed breakout and hold above this level, alongside RSI entering Overbought across multiple timeframes and volume expansion, would give us a solid entry for a long position.
📉 Our short position trigger is below $112,200. A sharp drop with strong selling pressure and RSI entering Oversold would justify a short entry—though I do not recommend taking this trade.
❤️ Disclaimer : This analysis is purely based on my personal opinion and I only trade if the stated triggers are activated .
BTCUSDT – Eyeing Liquidity & Channel Resistance BTC has rebounded strongly from the lower boundary of the descending channel, supported by a recovery in momentum indicators from oversold territory. This move has pushed price toward the upper trendline resistance, with bullish momentum eyeing key liquidity levels.
A CME gap lies just ahead, acting as a potential magnet for price action. The immediate long target sits at $115,450, aligning with the identified liquidity zone and serving as the first area of interest for partial profit-taking. Sustained bullish pressure could lead to a test of the upper channel resistance near $121,400.
However, traders should monitor price reaction closely — a rejection from resistance could trigger a retracement toward mid-channel support or even back to the lower boundary around $108,000.
Key levels to watch:
Long Target: $115,450 (Liquidity zone)
Resistance: ~$121,400 (Upper channel boundary)
Lower Support: ~$108,000 (Channel base)
📊 Bias: Short-term bullish toward $115,450, but still trading within a larger corrective structure. Reaction at $121,400 will be critical for the next trend leg.

Plan $BTC - 08/08/2025Daily timeframe (D)
📍 Price is reacting at the resistance zone.
📌 Triple-top pattern → price has shown a decent recovery, retesting the previous support zone at 117k – 117.5k before reacting.
⚠️ Only consider short positions if the lower timeframes form a clear bearish structure.
✅ Prefer looking for pullbacks to long, as the previous daily candle showed strong buying momentum.
H4 – H1 timeframe
🎯 Long target: 118k (Fibonacci extension 1.618).
📌 Long entry zones:
1️⃣ 116k1xx → H1 base + EMA34 test.
2️⃣ 115k – 115k4xx → Support zone + Fibonacci 0.5 retracement. → Can also long selected altcoins: CRYPTOCAP:XRP , $HEADEL, CRYPTOCAP:AVAX , $APT.

[SeoVereign] BITCOIN BEARISH Outlook – August 10, 2025In the August 10th idea I’m sharing today, I would like to focus on the bearish perspective.
As a swing trader, I am not particularly tied to the major trend, but I believe that this decline is meaningful enough within the short time frame, and I would like to share this perspective with you.
The main bases used in this idea are as follows:
-Harmonic 1.902 Crab Pattern
-Traditional ratio relationships in Elliott Wave Theory (1.618)
-Full Fibonacci 0.618 retracement
Based on this, I have set the average target price at approximately 114,500 USDT.
As time goes by, I plan to add more specific drawings to support this idea so that you can understand it more easily, and if the target price is reached, I will also share the entry price and take-profit price for your reference.
Thank you very much for reading,
and I sincerely wish you an overwhelming amount of strong luck.
Thank you.

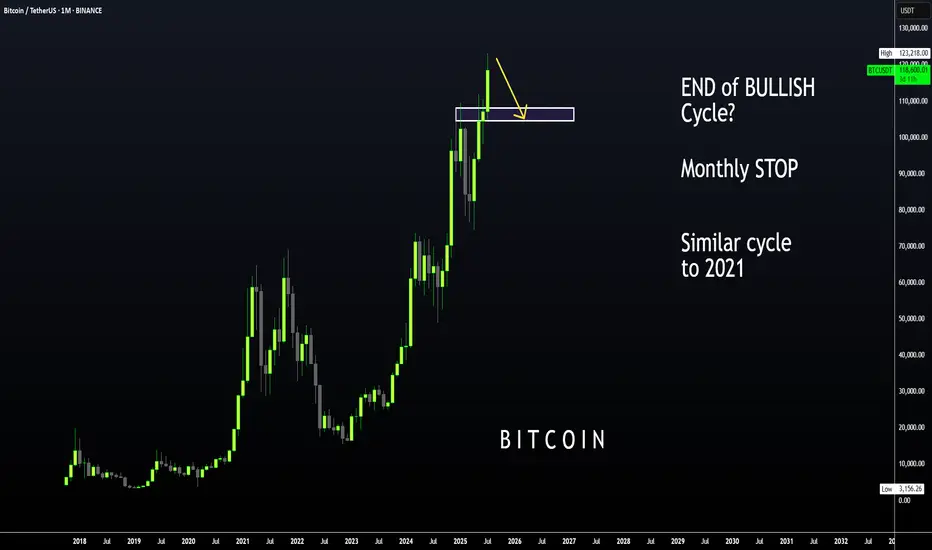
BTC | ALT Season, then BEARISH CYCLE BeginsBitcoin is likely moving in to the beginning of a bearish cycle.
I'm not saying this is immediate, we first need to see altseason - however, if BTC increases it may not go any higher than the last high of $123k. We could easily see the price hover around this zone with a few small increases and decreases for the next few weeks as alts make their respective moves.
I have been talking about the 2021 fractal for a couple of months, where BTC took its time to correct and then made another ATH which was only slightly higher.
We already see a similar pattern playing out in the monthly timeframe if we overlay bars pattern from 2021:
Although Bonce zone 3 may only be in several months, these are the major support zones where BTC could bounce from. Ideal for a swing:
____________________
BINANCE:BTCUSDT
weekend buy zone for bitcoinAs volume trails off due to markets being closed leaves room for manipulation. Which is why we tend to stay away from weekend trading unless we have a set in stone game plan as we do now. We take the variables of longs vs shorts, days of the week, and market maker manipulation to strengthen our pvsra volume threshold trading strategy. See where we got this liquidity below, on the 5m timeframe.

A big drop is ahead in the coming weeksBitcoin appears overbought, and in the current global economic climate, cash is king — a dynamic that may prompt investors to lock in profits. I anticipate a pullback to the 0.5 Fibonacci level, which sits around $69,000.

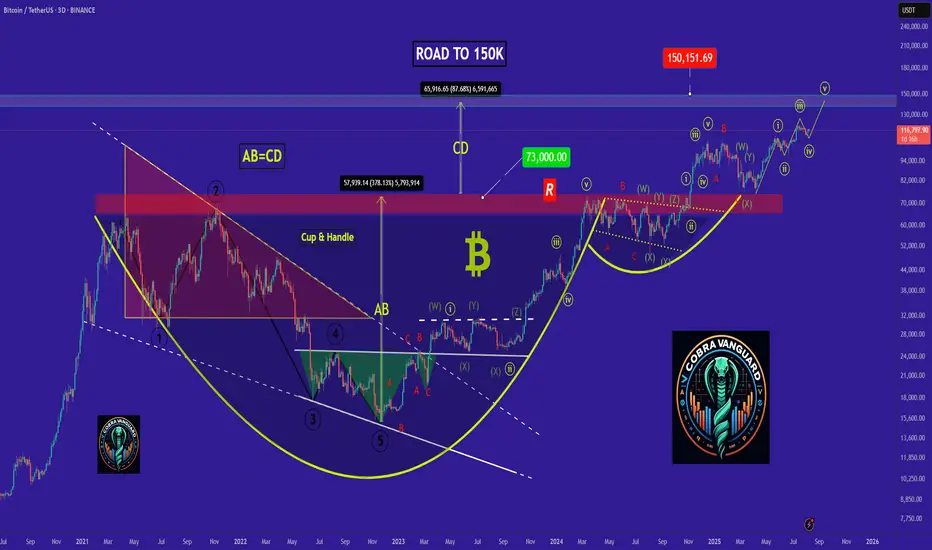
bitcoin - Time to buy again!The price seems to have completed the fourth corrective wave, and from now on, it's time for a price increase, which will continue up to around $150k .
previous analysis