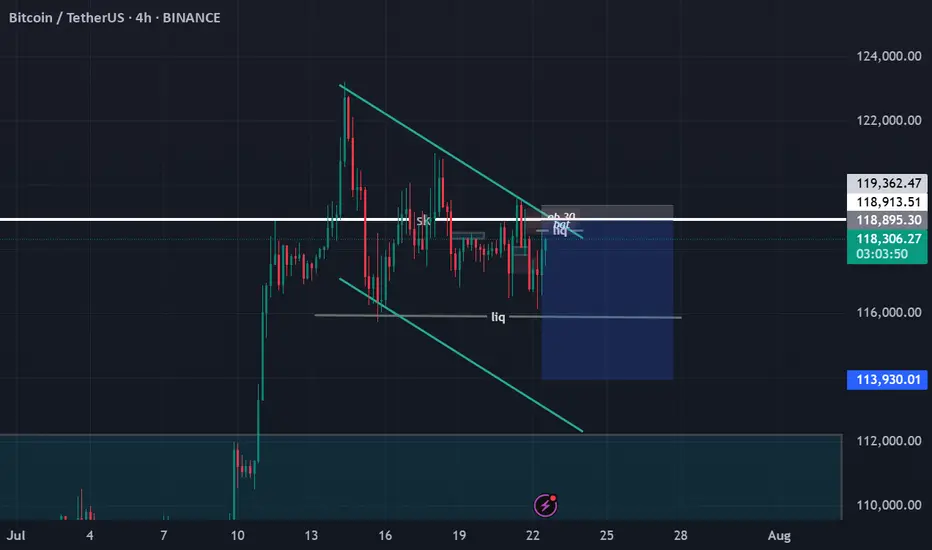
Trading plan for BitcoinLast week, Bitcoin established a new ATH at $123k before entering a corrective phase. The price action has since developed into a clear consolidation pattern and currently trades below the weekly pivot point.
Key Observations:
Proximity to last week's low increases probability of a full ABC correction targeting $113k
Break above noted resistance could invalidate bearish scenario and suggest ATH retest
Critical Levels:
Resistance: $119,500
Support: $113,000 (ABC target)
Trade the range until the market declares its next direction.
BTCUSDT trade ideas

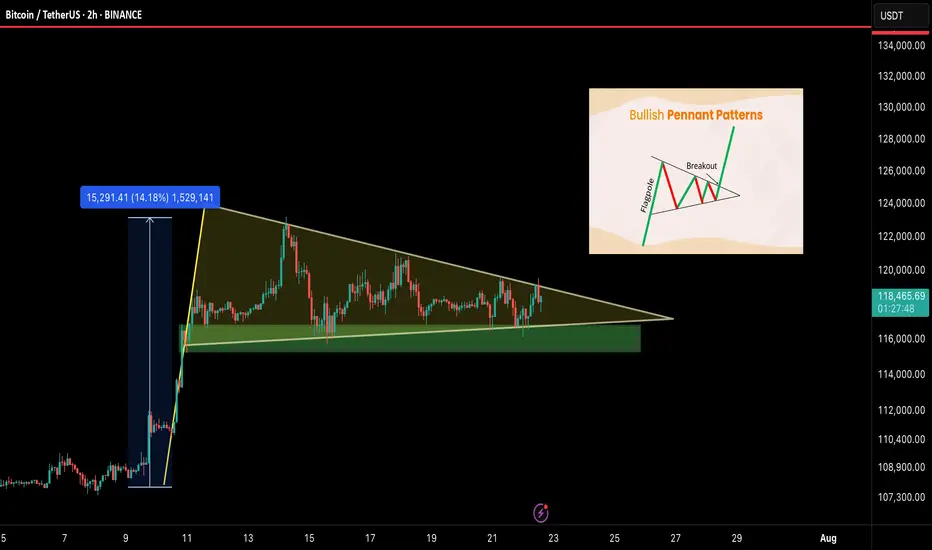
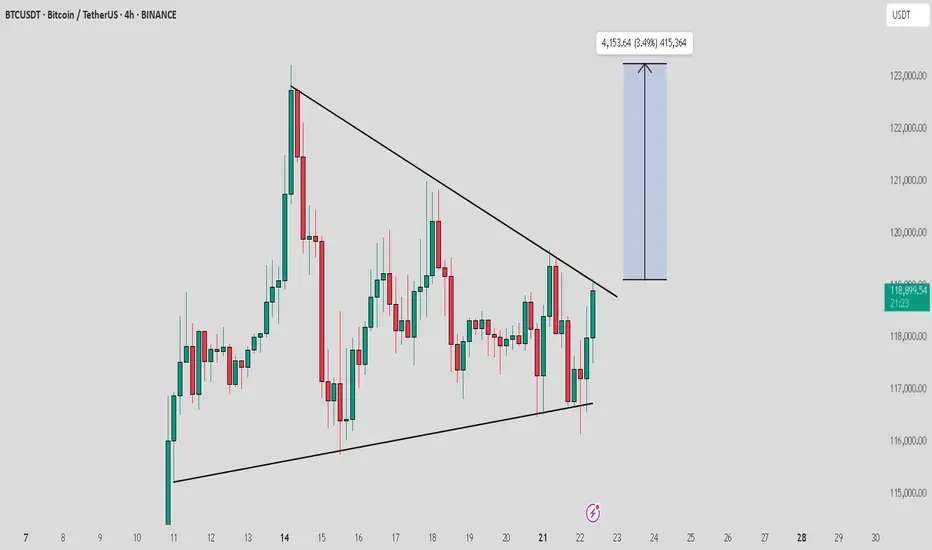
BTC/USDT – Bullish Pennant Setting Up for the Next Leg!Bitcoin is currently forming a bullish pennant — a classic continuation pattern — right after a strong 14% impulse move. This type of structure often leads to a breakout followed by another powerful rally. And it’s coiling up nicely.
🧠 Technical Breakdown:
🟢 Bullish pennant formation in progress
🔽 Support zone: $115.5K – $116.5K
📏 Flagpole projection targets $135K+ on breakout
⚠️ Currently consolidating with lower volatility — breakout could be near
🔍 What to Watch For:
Clean breakout above pennant = breakout confirmation
Daily close below $115K = invalidation zone
Volume spike will likely signal the next move
📢 Final Take:
BTC is showing healthy consolidation after a strong move, and this pennant could launch us toward $135K and beyond. Keep your eyes on the breakout and manage risk wisely.
💬 Share your thoughts below & smash that ❤️ if you’re watching this move!
BTC - Sideways forever?!Compressing really hard here on BTC, look at:
- volume range becoming very concentrated, clean pingpong between VAL and VAH
- H4 trend compressing to almost a single point
- you can see from the purple lines that only internal liquidity is being taken on both sides
imo this sets us up for a potential fake out setup. There is so much liquidity on both sides in this small range, that on a very clean sfp of one side, the other side would have to rush out which pushes price quickly to the other side. We saw a little bit of that already with the sweep during the asia session today.
Of course the sfp needs to be valid, wait for a reclaim setup, there is always the chance the breakout/breakdown is valid, you don't want to be on the wrong side of that either.
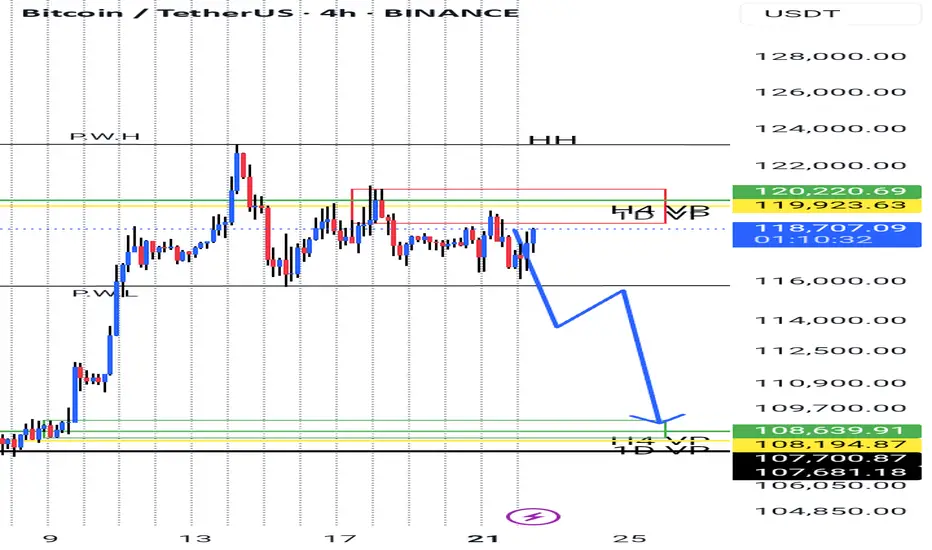
BTC/USDT Analysis: Rotation Continues
Hello everyone! This is a daily analysis from a trader-analyst at CryptoRobotics.
Yesterday, Bitcoin continued to rotate within a narrow sideways range, and so far, there has been no breakout. We retested the lower boundary of the range and once again saw absorption of market selling at that level.
At the moment, the scenario remains valid — we expect a breakout to the upside. Several factors support this outlook: strong defense at the lows, delta absorption across the entire range, and buyer control on the most recent local upward wave.
A less likely scenario is a dip into the lower buy zone, a liquidity grab, and another attempt to move higher.
Buy Zones:
~$115,000 (zone of initiating/pushing volumes)
$110,000–$107,000 (accumulated volumes)
This publication is not financial advice.
TradeCityPro | Bitcoin Daily Analysis #134👋 Welcome to TradeCity Pro!
Let’s dive into the Bitcoin analysis and key crypto indices. As usual, in this analysis I will review the New York futures session triggers for you.
⏳ 1-Hour Timeframe
On the 1-hour timeframe, Bitcoin has formed a range box between 116829 and 119395. Yesterday, after getting supported at 116829, it climbed back to the top at 119395.
📊 As you can see, buying volume has increased, which indicates strong buyer momentum.
📈 If 119395 is broken, the price could move toward higher targets like 120594 and 122733.
🧩 This 119395 area is also the breakout trigger of the descending triangle. The bottom at 116829 has supported the price multiple times, and now with the descending trendline being broken, price could aim for higher resistance levels.
👑 BTC.D Analysis
Let’s move on to Bitcoin Dominance. BTC Dominance has been supported at 60.46, which is why Bitcoin is moving upward, while altcoins are dropping.
🎲 The dominance trend is still clearly bearish, and if 60.46 breaks, the next downward leg may begin.
📅 Total2 Analysis
Let’s look at Total2. This index has also formed a range between 1.48 and 1.55, and it is currently sitting at the bottom of the box.
🔔 If we get confirmation of support at 1.48, we can consider entering a long position. The main long trigger would be the break of 1.55.
📅 USDT.D Analysis
This index has also formed a range box. The previous support level was 4.08, which has now shifted to 4.13.
💥 The top of the box is 4.25. Given the bearish momentum in dominance, the probability of 4.13 breaking is higher.
🎲 So keep a close eye on altcoins in the coming days, because a lot of capital is flowing into them and they could see significant pumps.
❌ Disclaimer ❌
Trading futures is highly risky and dangerous. If you're not an expert, these triggers may not be suitable for you. You should first learn risk and capital management. You can also use the educational content from this channel.
Finally, these triggers reflect my personal opinions on price action, and the market may move completely against this analysis. So, do your own research before opening any position.

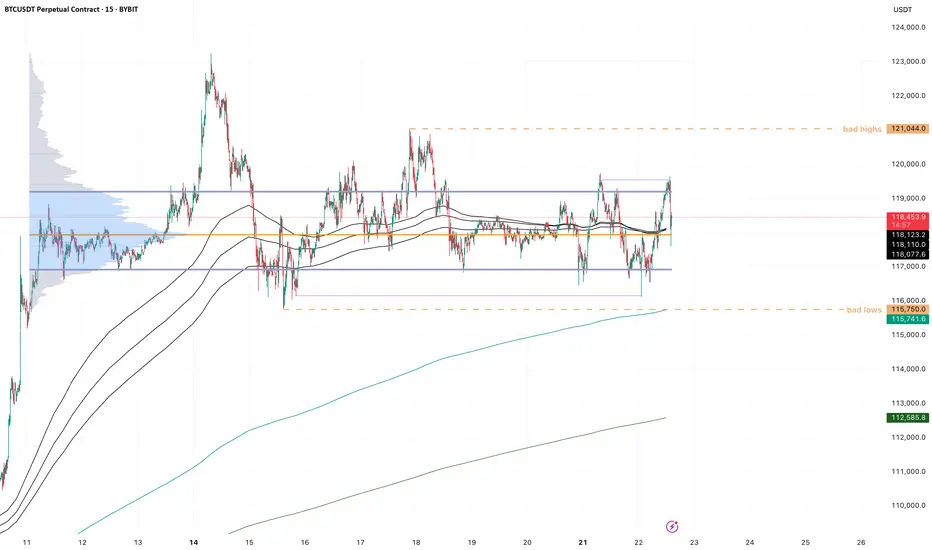
BTC/USDT - Liquidity Loading Zone
Bitcoin is trading within a well-defined range, building liquidity on both sides. Equal highs near 121K signal buy-side liquidity, while equal lows around 115.7K mark the sell-side liquidity. This setup is a classic smart money trap—engineered to gather orders before a major move. The longer the range holds, the more explosive the breakout is likely to be. Watch for a sweep of either side as a potential trigger for expansion.
Whether it’s a fakeout or breakout, liquidity will decide the next move.

BTC Top-Down Analysis (Weekly, Daily, 4H)Weekly, Daily, and overall trend is bullish only 4H internal structure is short-term bearish with price trading inside a 4H demand zone.
From weekly timeframe:
- Inverse head & shoulders is forming showing trend continuation.
- ATH trendline (Nov 2021) has flipped from resistance to support — not retested yet.
- Major supports all align between 113K–109K including:
- CME Gap: 114380–115635
- Trendline: 113798
- Neckline: 112800
- Weekly Bullish OB: 110520
- Harmonic Bat PRZ: 109350
My Thoughts:
This 113K–109K zone is a high-confluence support area I’ll only consider buying BTC within this range.
This analysis remains valid as long as the weekly candle doesn’t close below the Bullish OB (105K) or above the ATH.

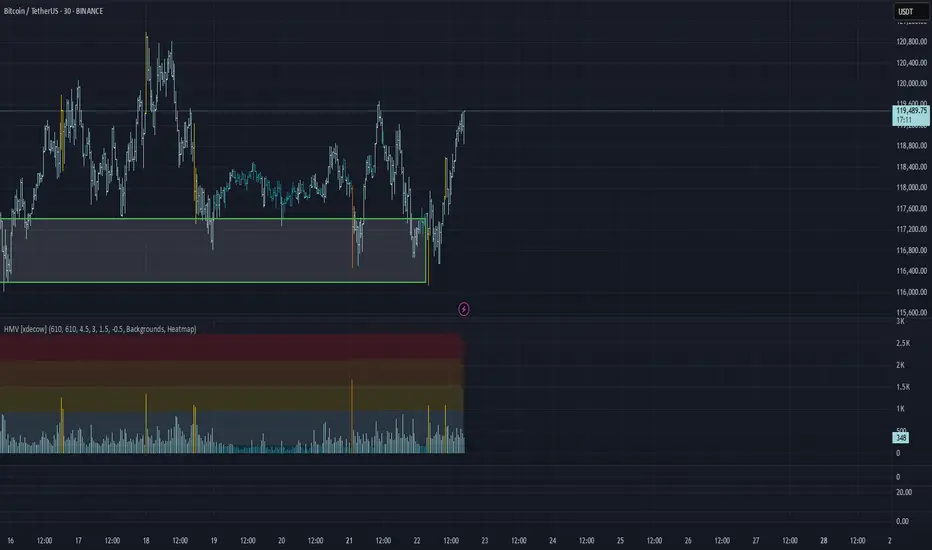
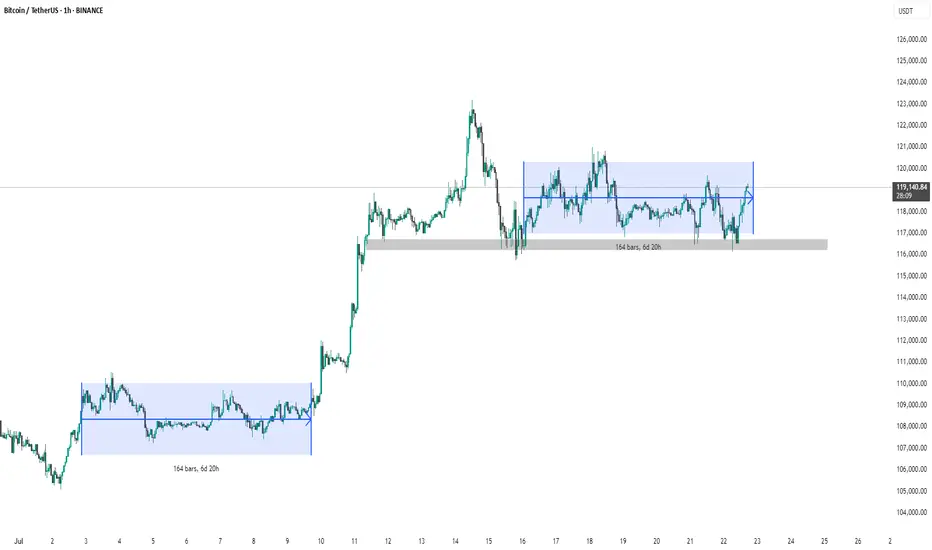
BTC #Bitcoin (BTC/USDT) 1-hour chartThis Bitcoin (BTC/USDT) 1-hour chart shows two clear consolidation phases marked by blue rectangles. Each consolidation lasted 164 bars (~6 days 20 hours). After the first range, Bitcoin broke out upwards, leading to a strong rally. The current price action is again testing the upper boundary of the second consolidation range ($119,200), indicating a possible breakout. The gray zone ($116,500) highlights a key support level. A breakout above the range could signal another bullish continuation.
thanking you
Are you Ready for Next Leg Up BTC Breakout is done on 4H wait for retest and you can take long after confirmation
TP 128K 130K For now
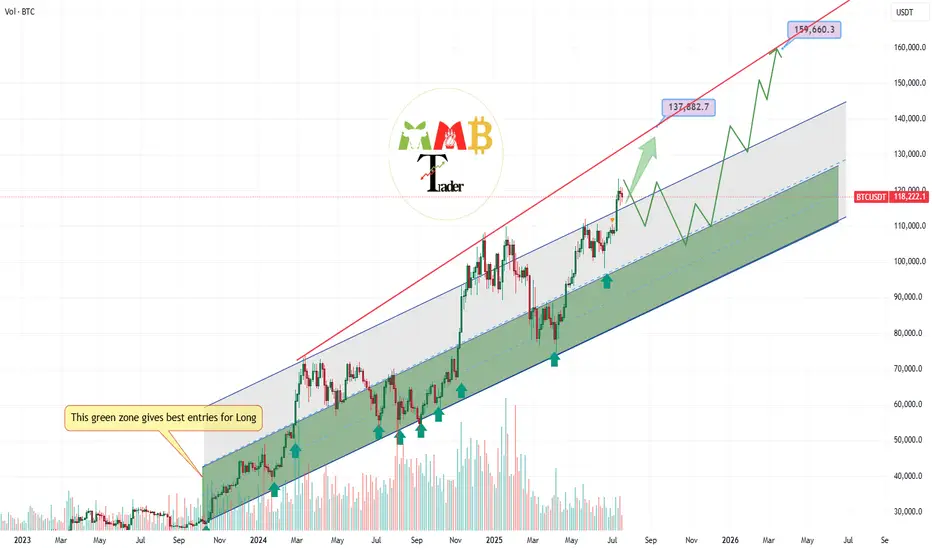
Bitcoin first target and short-term pump at least to 137K$ aheadAs we can see stop and next range zone for price can be near 135K$ to 137K$ and also major support zones now are 115K$ and 105K$ that can pump price once again if they touch.
Red trendline was strong resistance and it usually stop the pump and it is daily high detector now unless it breaks this time.
DISCLAIMER: ((trade based on your own decision))
<<press like👍 if you enjoy💚

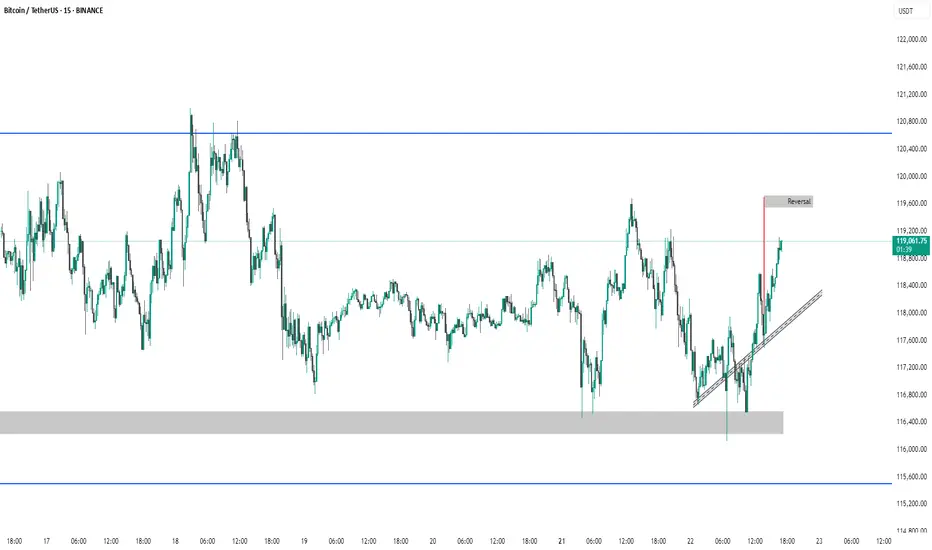
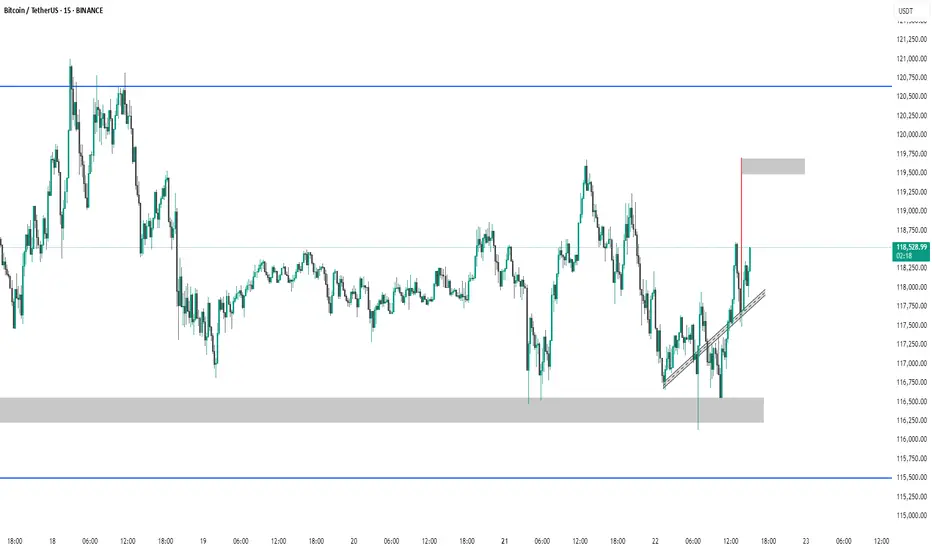
BTC #Bitcoin 15-minute BTC/USDT chart (Updated ChartThis 15-minute BTC/USDT chart (Binance) shows Bitcoin rebounding from a demand zone near 116,000–116,750 USDT and forming higher lows along a short-term ascending trendline. Price is currently around 118,446 USDT, aiming toward a marked supply zone near 119,500 USDT, suggesting a potential short-term bullish move. A rejection at this supply zone could signal a pullback, while a breakout may indicate continued upward momentum. Key support and resistance zones are clearly defined.
thanking you
BTC / USDT near to breakout from trendline resistanceBTC is testing its trendline resistance after a steady buildup. A successful breakout could trigger a strong move toward the $122,000–$125,000 range. Worth watching closely in the coming sessions.
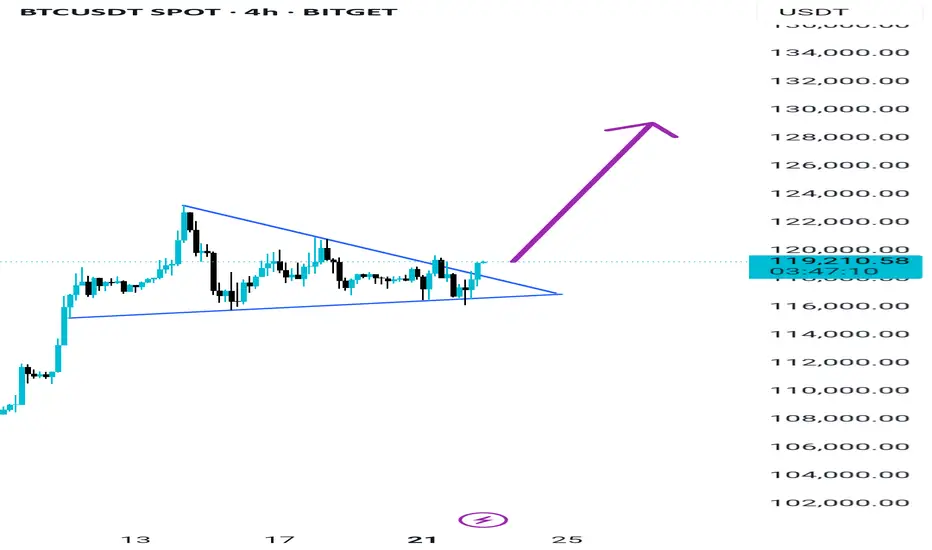
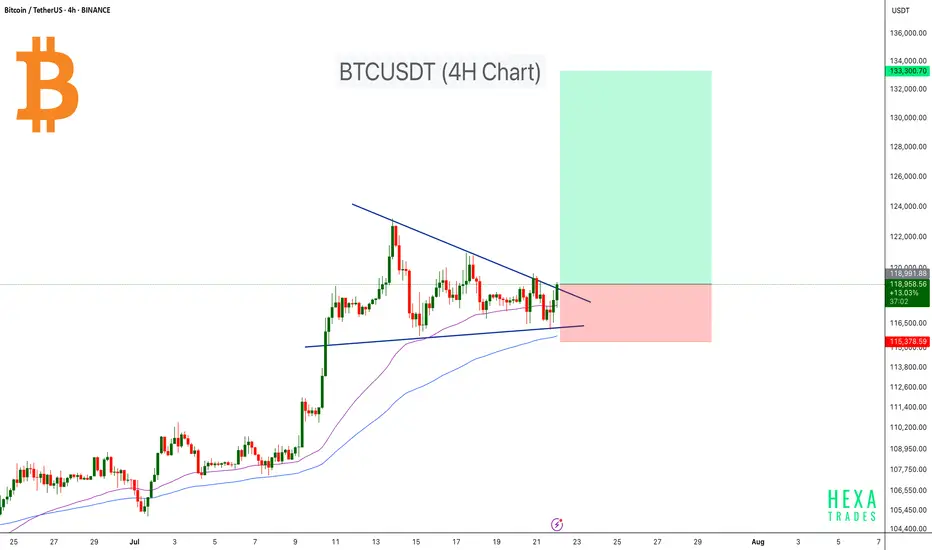
Bitcoin Ready for the Next Leg Higher!Bitcoin is currently consolidating within a symmetrical triangle on the 4-hour timeframe, showing signs of a potential breakout. After a strong rally earlier in July, BTC has entered a compression phase, forming lower highs and higher lows — a classic setup for a volatility breakout.
Price is moving near the apex of the triangle, suggesting that a decisive move is imminent. The 50 EMA and 100 EMA are both acting as dynamic support, helping bulls maintain control of the structure. A breakout above the descending trendline could initiate a sharp move toward the $130K–$133K target zone.
Cheers
Hexa
BINANCE:BTCUSDT
$BTC Breakout Coming?CRYPTOCAP:BTC is coiling up inside a symmetrical triangle on the 2H chart.
A breakout looks close if it clears resistance; we could see a 7.5% move toward the $127K–$128K zone.
Watch for volume confirmation.
DYOR, NFA

BTCUSDTBTCUSDT needs some more correction before we continue the same trend.
Disclosure: We are part of a Trade Nation's influencer program and receive a monthly fee for using their Tradingview charts in our analysis.
BTC BITCOIN THE BTC 135K ZONE ON the ascending trend line will like happen ,as the structure never lies.
at the moment am looking at a retest into 124k and we either get a double top structure to sell on rejection or we keep buying into 135k and sell from the supply roof of the ascending bullish trendline .
trading is 100% probability ,trade with caution.
ANY KEY LEVEL CAN FAIL .

BTC AI Prediction Dashboard - 6h Price Path (22.07.25)
Prediction made using Crypticorn AI Prediction Dashboard
Link in bio
BTCUSDT Forecast:
Crypticorn AI Prediction Dashboard Projects 6h Price Path (Forward-Only)
Forecast timestamp: ~10:15 UTC
Timeframe: 15m
Prediction horizon: 6 hours
Model output:
Central estimate (blue line): -118,624
Represents the AI’s best estimate of BTC’s near-term price direction.
80% confidence band (light blue): 118,260 – 118,867
The light blue zone marks the 80% confidence range — the most likely area for price to close
40% confidence band (dark blue): 117,702 – 119,570
The dark blue zone shows the narrower 40% confidence range, where price is expected to stay with higher concentration
Volume on signal bar: 120.84
This chart shows a short-term Bitcoin price forecast using AI-generated confidence zones.
Candlesticks reflect actual BTC/USDT price action in 15-minute intervals.
This helps visualize expected volatility and potential price zones in the short term.

BTC – Tightening Structure, Big Move Loading?CRYPTOCAP:BTC is currently bouncing off the lower trendline of the symmetrical triangle on the 4-hour chart 📊. The structure remains intact, with neither a breakout nor a breakdown confirmed yet.
This kind of compression often leads to expansion—either a bullish surge or a sharp dip depending on who takes control next ⚡️.
All eyes are on this zone 👀. The next few candles could decide the market’s short-term direction, so stay sharp and watch the reaction closely!

BTC #Bitcoin 15-minute BTC/USDT chart This 15-minute BTC/USDT chart (Binance) shows Bitcoin rebounding from a demand zone near 116,000–116,750 USDT and forming higher lows along a short-term ascending trendline. Price is currently around 118,446 USDT, aiming toward a marked supply zone near 119,500 USDT, suggesting a potential short-term bullish move. A rejection at this supply zone could signal a pullback, while a breakout may indicate continued upward momentum. Key support and resistance zones are clearly defined.
I’m just trying my luck with this and it doesn’t look too great The only only way way I could find find out if they they are are in in a a little little while I was was if if I could get them them in in a a week week and and I I could could find find a couple couple days days in the next month month or two two days days and and I I can can I have have them them out out in a a week and and I have a lot more time
btcIn h1 time frame the price is indecision phase which makes traders more careful to take position in market. Support area is obvious.

BTCUSDT IDEAAlthough Bitcoin is currently in an uptrend, it broke the bottom at 116.684, which caused the new top at 123.200. Therefore, I see that it has formed a bearish consolidation currently. Also, huge liquidity is concentrated at 115.930, so I expect it to fall to 113.849.