BTCUSDTHello Traders! 👋
What are your thoughts on BITCOIN?
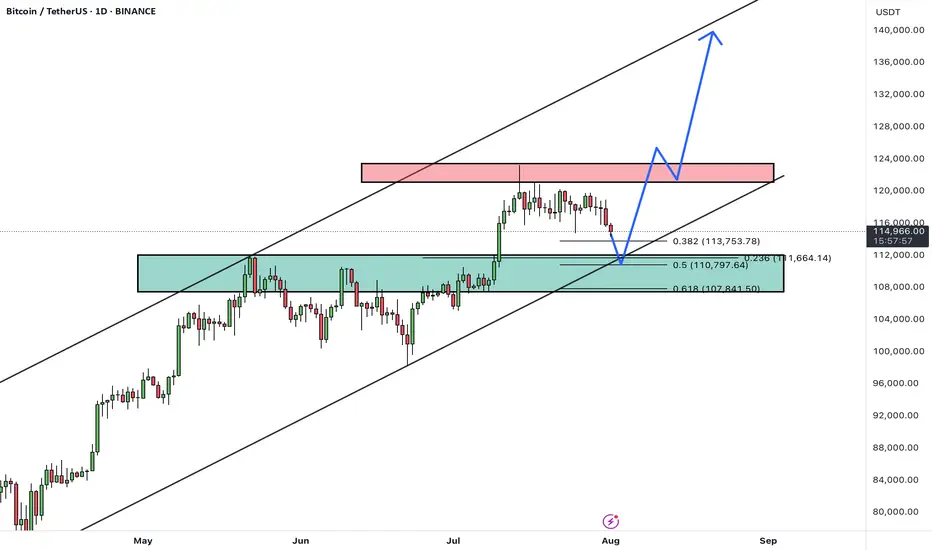
After a strong rally, BTC is currently pulling back from the 124K resistance area, heading toward a major confluence support zone between 108,000– 110,000, which aligns with:
✅ Previous breakout zone
✅ 0.5–0.618 Fibonacci retracement
✅ Lower bound of the ascending channel
This level is expected to attract buyers and act as a base for a new bullish leg.
Scenario Ahead (Main Bias):
1. Price dips into the 108–110K support
2. Bullish reversal from the zone (watch for strong reaction candles or bullish divergence)
3. Target 1: 124K (retest resistance)
4. Target 2: 135K–140K (upper channel boundary upon breakout)
BTC remains in a healthy bullish structure. Current pullback is considered constructive, and the 107–110K zone offers a high-probability long setup. Watch for bullish signals before entering.
A confirmed daily close below 107K would invalidate this bullish structure and expose BTC to deeper correction levels.
What’s your take on this setup? Do you expect a bounce from support or a deeper correction? Share your thoughts below 👇
Don’t forget to like and share your thoughts in the comments! ❤️
BTCUSDT trade ideas
A lose Cycle! Sell The Bottom, Buy The Hype!? Why Do You Buy When Everyone Else Is Terrified?
What drives us to make the exact opposite of a rational decision?
Is a crashing market truly a buying opportunity or just a trap?
Hello✌️
Spend 2 minutes ⏰ reading this educational material.
🎯 Analytical Insight on Bitcoin :
BINANCE:BTCUSDT has created strong liquidity with this recent pullback 📉 and is now testing a key daily support level. I’m looking for a potential bounce of at least 5%, targeting around $119,000, near a significant daily resistance 🚀.
Now , let's dive into the educational section,
🌀 Retail Traders: Victims of Hype, Fear, and Noise
Most casual traders sell during a dip, not because of a plan but because of panic. As soon as they see red candles flooding the chart, they react emotionally, not logically. Then, when prices rally and social media is buzzing, they jump back in, usually at the worst possible time. This cycle of buying tops and selling bottoms isn’t random. It is driven by crowd psychology, and unless you recognize it, you’ll keep falling for the same trap again and again.
🧭 No Strategy or Stop Loss Means You’re Gambling
If you enter a trade without knowing where you'll exit, you’re not trading. You’re guessing. A strategy is not optional. It is your foundation. Proper take-profit and stop-loss levels are what keep emotions out of the equation. Traders without a plan either take profits too early or hold onto losses too long, hoping they’ll bounce back. This isn’t trading. This is gambling with extra steps.
🔍 Technical and Fundamental Analysis Work Best Together
Only reading charts without understanding the asset means you're blind to context. Only studying the fundamentals without watching price action means you’re missing timing. Technical analysis helps you pinpoint when to act. Fundamental analysis tells you why to act. The best traders blend both. You find the "what" through fundamentals, and the "when" and "how" through technicals.
⚠️ Buying the Hype and Selling the Panic Hurts
Markets swing between extremes. When your favorite coin is pumping and influencers are screaming 🚀🚀 it might be too late. That is often when smart money exits and retail rushes in. On the flip side, when everyone is doom-posting and charts are dripping red, that is when opportunity quietly appears. But only if you’ve done your homework. It’s not about being a contrarian. It’s about being informed.
🛠 Useful TradingView Tools to Avoid Getting Tricked
To avoid emotional decisions, there are a few essential tools in TradingView that every trader should get familiar with:
Volume Profile
Shows you where the highest buying and selling activity has occurred. It helps reveal the zones where whales might have entered the market.
Fear & Greed Indicator
Gives you a quick sense of the market’s emotional state. When everyone’s afraid, it might just be the right time to start thinking about buying.
Divergence Scanner
Helps you spot potential price reversals before they happen by detecting divergences between price and momentum.
Alerts
Stop checking the charts 24/7. Set alerts on key resistance and support levels so you only react when it actually matters.
Multi-Timeframe Analysis
Don’t stay locked into the 15-minute chart. Use daily and weekly timeframes to understand the bigger picture and avoid short-term noise.
🎯 Final Thought and Recommendation
In this market, the winners aren’t the fastest. They are the most prepared. Build your strategy, manage risk with stop losses, blend technical with fundamentals, and most importantly, don’t let the crowd think for you.
✨ Need a little love!
We pour love into every post your support keeps us inspired! 💛 Don’t be shy, we’d love to hear from you on comments. Big thanks , Mad Whale 🐋
📜Please make sure to do your own research before investing, and review the disclaimer provided at the end of each post.

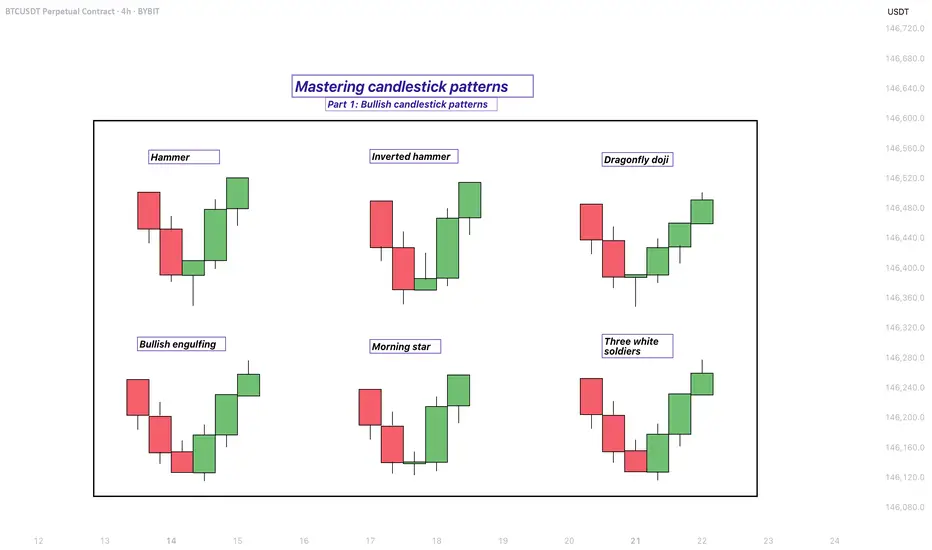
Mastering bullish candlestick patterns - How to use it!In this guide, we will explore some of the most important bullish candlestick patterns used in technical analysis. These patterns are essential tools for traders and investors who want to better understand market sentiment and identify potential reversal points where prices may start moving upward.
What will be explained:
- What are bullish candlestick patterns?
- What is the hammer?
- What is the inverted hammer?
- What is the dragonfly doji?
- What is the bullish engulfing?
- What is the morning star?
- What is the three white soldiers?
- How to use bullish candlestick patterns in trading?
What are bullish candlestick patterns?
Bullish candlestick patterns are specific formations on a candlestick chart that signal a potential reversal from a downtrend to an uptrend. These patterns are used by traders and investors to identify moments when the market sentiment may be shifting from bearish to bullish. Recognizing these patterns can help traders time their entries and make more informed decisions based on price action and market psychology. While no single pattern guarantees success, they can provide valuable clues when combined with other forms of analysis such as support and resistance, trendlines, and volume.
What is the Hammer?
The Hammer is a single-candle bullish reversal pattern that typically appears at the bottom of a downtrend. It has a small real body located at the upper end of the trading range, with a long lower shadow and little to no upper shadow. The long lower wick indicates that sellers drove the price lower during the session, but buyers stepped in strongly and pushed the price back up near the opening level by the close. This shift in momentum suggests that the downtrend could be coming to an end, and a bullish move might follow.
What is the Inverted Hammer?
The Inverted Hammer is another single-candle bullish pattern that also appears after a downtrend. It has a small body near the lower end of the candle, a long upper shadow, and little to no lower shadow. This pattern shows that buyers attempted to push the price higher, but sellers managed to bring it back down before the close. Despite the failure to hold higher levels, the buying pressure indicates a possible reversal in momentum. Traders usually look for confirmation in the next candle, such as a strong bullish candle, before acting on the signal.
What is the Dragonfly Doji?
The Dragonfly Doji is a special type of candlestick that often indicates a potential bullish reversal when it appears at the bottom of a downtrend. It forms when the open, high, and close prices are all roughly the same, and there is a long lower shadow. This pattern shows that sellers dominated early in the session, pushing prices significantly lower, but buyers regained control and drove the price back up by the end of the session. The strong recovery within a single period suggests that the selling pressure may be exhausted and a bullish reversal could be imminent.
What is the Bullish Engulfing?
The Bullish Engulfing pattern consists of two candles and is a strong indication of a reversal. The first candle is bearish, and the second is a larger bullish candle that completely engulfs the body of the first one. This pattern appears after a downtrend and reflects a shift in control from sellers to buyers. The bullish candle’s large body shows strong buying interest that overpowers the previous session’s selling. A Bullish Engulfing pattern is even more significant if it occurs near a key support level, and it often signals the beginning of a potential upward move.
What is the Morning Star?
The Morning Star is a three-candle bullish reversal pattern that occurs after a downtrend. The first candle is a long bearish one, followed by a small-bodied candle (which can be bullish, bearish, or a doji), indicating indecision in the market. The third candle is a strong bullish candle that closes well into the body of the first candle. This formation shows a transition from selling pressure to buying interest. The Morning Star is a reliable signal of a shift in momentum, especially when confirmed by high volume or a breakout from a resistance level.
What is the Three White Soldiers?
The Three White Soldiers pattern is a powerful bullish reversal signal made up of three consecutive long-bodied bullish candles. Each candle opens within the previous candle’s real body and closes near or at its high, showing consistent buying pressure. This pattern often appears after a prolonged downtrend or a period of consolidation and reflects strong and sustained buying interest. The Three White Soldiers suggest that buyers are firmly in control, and the market may continue moving upward in the near term.
How to use bullish candlestick patterns in trading?
To effectively use bullish candlestick patterns in trading, it’s important not to rely on them in isolation. While these patterns can signal potential reversals, they work best when combined with other technical tools such as support and resistance levels, moving averages, trendlines, and volume analysis. Traders should also wait for confirmation after the pattern forms, such as a strong follow-through candle or a break above a resistance level, before entering a trade. Risk management is crucial—always use stop-loss orders to protect against false signals, and consider the broader market trend to increase the probability of success. By integrating candlestick analysis into a comprehensive trading strategy, traders can improve their timing and increase their chances of making profitable decisions.
Thanks for your support. If you enjoyed this analysis, make sure to follow me so you don't miss the next one. And if you found it helpful, feel free to drop a like 👍 and leave a comment 💬, I’d love to hear your thoughts!
The Great Trap: How Billionaires Are Winning, and You're Not!The Great Crypto Trap: How Billionaires Are Winning—And You're Not
The ETFs, Saylor, and all of Trump's billionaire friends are getting richer—thanks to crypto.
Meanwhile, most retail traders are just trying to stay above water. Leverage trades are wiped out, charts feel rigged, and the market makes you feel like you're swimming against a riptide.
Why?
Because these rich guys have a plan: manipulate you and take your money. That’s how they stay rich.
Understanding their strategy is the first step to stop being their exit liquidity.
🧠 The New Battlefield
Crypto is no longer a playground for cypherpunks and tech rebels. It’s fully institutional now. We're not just trading against whales—we're fighting the same entities that own the media, control Wall Street, and write the rules.
So forget the old ways of thinking. The tables have turned.
🗓 The Sunday Rekt Routine
To maximize destruction, they need to avoid friendly fire. So they pump on the weekend when retail is free and optimistic, then dump on Monday to close the CME gap—like clockwork.
The playbook:
Weekend: Pump. Trap your long.
Monday: Dump. “Fill the gap.” Liquidate everyone.
Response:
Don’t fall for weekend FOMO. Exit Sunday afternoon. Wait until Tuesday to re-enter, once Monday’s high and low are set. Trade smart, not emotional.
📈 Top-of-the-Market FOMO
You’ve seen it before. Just before the crash, the media frenzy begins. Influencers say “Don’t miss this pump!” or “99% will miss the next big move!” The ETF gods hint at new inflows. It's a setup.
They're not hyping it for your benefit—they're offloading their bags in your face.
Just look at the charts:
BlackRock bought billions to drive BTC to 121K.
Then, in 72 hours, they dumped billions.
Saylor? Silent. No new buys. That’s not coincidence—it’s coordination.
Response:
Check the MACD, RSI, and Stochastic RSI on daily or weekly timeframes. If they're maxed out and the influencers are screaming green—it’s probably too late.
When they stop buying, the dump is already planned.
🧰 How to Outsmart Them
Watch the MACD for crossovers and divergence.
Monitor RSI zones—don’t long into extreme overbought conditions.
Use Stoch RSI to anticipate momentum shifts.
Rule: When everything is overheated, and FOMO is peaking—step back. Let them dump into each other. You’ll get your entry later, cleaner and cheaper.
⚔️ This Is War
Make no mistake: this is a war for your money.
They want yours. You want theirs.
Only the smart survive.
To be continued.
DYOR.

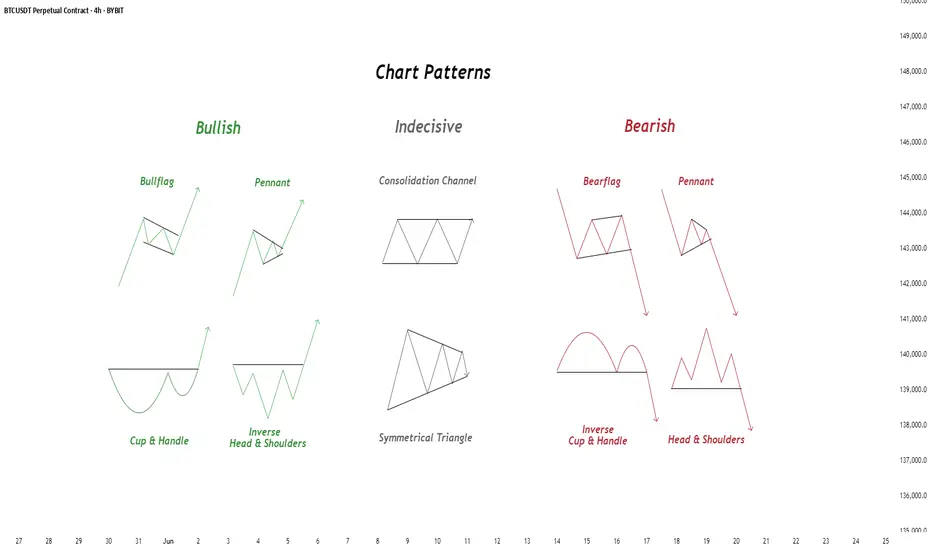
Chart Patterns - How to read them like a ProChart patterns are visual formations on price charts that help traders anticipate potential market movements.
These patterns fall into three main categories: bullish , bearish , and indecisive .
---
1. Bullish Chart Patterns
Bullish patterns often signal that price is likely to move upward.
1.1 Bull Flag
* What it looks like: A sharp upward move followed by a small downward-sloping rectangle (the flag).
* Meaning: After a strong rally, the price consolidates briefly before continuing higher.
* Key insight: A breakout above the flag typically signals a continuation of the trend.
1.2 Pennant (Bullish)
* What it looks like: A strong upward move followed by a small symmetrical triangle.
* Meaning: Similar to the bull flag, but the consolidation takes a triangular form.
* Key insight: Once price breaks above the pennant, the uptrend often resumes.
1.3 Cup & Handle
* What it looks like: A “U”-shaped curve (the cup) followed by a small downward drift (the handle).
* Meaning: This pattern suggests a period of accumulation before price breaks higher.
* Key insight: A breakout above the handle signals the beginning of a new bullish leg.
1.4 Inverse Head & Shoulders
* What it looks like: Three low points, with the middle low being the deepest.
* Meaning: This reversal pattern appears after a downtrend and signals a potential change to an uptrend.
* Key insight: A breakout above the “neckline” confirms the reversal.
---
2. Indecisive Chart Patterns
These patterns show market hesitation, where neither bulls nor bears are clearly in control.
2.1 Consolidation Channel
* What it looks like: Price moves within a horizontal channel.
* Meaning: Market is moving sideways with no strong trend.
* Key insight: A breakout in either direction often leads to a significant move.
2.2 Symmetrical Triangle
* What it looks like: Two converging trend lines forming a triangle.
* Meaning: This is a neutral pattern that can break out in either direction.
* Key insight: Traders wait for a breakout before taking a position.
---
3. Bearish Chart Patterns
Bearish patterns signal a high probability of downward price movement.
3.1 Bear Flag
* What it looks like: A sharp decline followed by a small upward-sloping rectangle.
* Meaning: After a strong drop, price consolidates before continuing lower.
* Key insight: A breakout below the flag suggests a continuation of the downtrend.
3.2 Pennant (Bearish)
* What it looks like: A sharp downward move followed by a small symmetrical triangle.
* Meaning: Similar to the bear flag, but the consolidation takes a triangular form.
* Key insight: A breakout downward typically resumes the bearish trend.
3.3 Inverse Cup & Handle
* What it looks like: An upside-down cup with a small upward drift forming the handle.
* Meaning: Indicates weakness after an uptrend, often followed by a drop.
* Key insight: A break below the handle usually signals a strong bearish move.
3.4 Head & Shoulders
* What it looks like: Three peaks, with the middle one being the highest.
* Meaning: A classic reversal pattern that indicates a potential shift from an uptrend to a downtrend.
* Key insight: A break below the “neckline” confirms the bearish reversal.
---
How to Use These Patterns
* Combine pattern recognition with support/resistance, volume, and indicators for stronger confirmation.
* Always wait for breakouts and avoid acting too early.
* Manage risk with stop-loss orders.
BITCOIN BULLS ARE GONNA DO THIS NOW!!!! (Fakeout Wick) Yello Paradisers! In this video, I've been updating Bitcoin price action and the Elliot Wave theory. I've been doing lots of advanced technical stuff. We've been going through channeling and updating ourselves about the most important support and resistance levels. We've been taking a look at the MACD histogram, the RSI, and the stochastic RSI. We've been professionally analyzing the volume; we've understood who is in power right now and what's going to happen next with the highest probability.
We've also been taking a look at what kind of confirmations we are waiting for in order for us to be able to open long or short positions.
Paradisers, make sure that you are trading with a professional trading strategy. Wait for confirmations, play tactically, and focus on long-term profitability, not on getting rich quick.
Remember, don’t trade without confirmations. Wait for them before creating a trade. Be disciplined, patient, and emotionally controlled. Only trade the highest probability setups with the greatest risk to reward ratio. This will ensure that you become a long-term profitable professional trader.
Don't be a gambler. Don't try to get rich quick. Make sure that your trading is professionally based on proper strategies and trade tactics.

BTC recovers, trying to get back to 120k💎 WEEKEND BTC PLAN UPDATE (08/08)
🔍 BTC Analysis (H4 timeframe):
1. Elliott Wave Structure:
• BTC is following an impulsive wave sequence 1–2–3–4–5.
• Currently in wave (4) and may bounce to complete wave (5) around the ~119,000–120,000 zone.
2. Key Support Levels:
• 116,000–116,200: Support area for wave (4) – can look for buying opportunities here if confirmation signals appear.
• Below that, strong support lies around 115,200–115,600 (confluence of 0.5–0.618 Fibonacci retracement + MA200).
3. Resistance Levels:
• Previous high around 117,500 (Fibo 1.0) is the nearest resistance.
• Wave (5) target: 119,400–120,000 (Fibo 1.618).
4. Trading Plan:
• Buy at 116,000–116,200, SL below 115,600.
• Expected TP: 117,500 – 119,400.”

TradeCityPro | Bitcoin Daily Analysis #144👋 Welcome to TradeCity Pro!
Let’s dive into Bitcoin analysis. Today is the first day of the week and Bitcoin has made a bullish move.
⏳ 4-Hour Timeframe
After the weekly candle closed, Bitcoin made an upward move and pulled back up to the 0.5 Fibonacci zone.
✔️ The long trigger I provided yesterday in the 1-Hour timeframe has been activated. If you opened a short-term position, it has likely already hit the target. If it was a long-term position with a larger stop, then it should still be open for now.
💫 The current 4-Hour candle has wicked into the 0.5 Fibonacci zone, which indicates a strong rejection from this area. If the candle closes red, the probability of starting the next bearish wave will increase significantly.
📊 Besides the resistance from the Fibonacci level, the SMA25 is also overlapping with this zone, so this upward move could also be seen as a pullback to the SMA25 before another drop begins.
✨ However, the candle hasn't closed yet, so it's too early to decide anything. In my opinion, Bitcoin has re-entered a choppy and sideways phase that doesn’t provide good and clean positions — most trades like yesterday’s need to be scalps.
🔍 If a deeper correction happens, our lower support levels are already identified (with the most important one being the 110000 zone). For shorts, I’ll look for entries below 110000. As for longs, I’ll wait for confirmation and stabilization above 116000. For now, I’m only observing this box between 110000 and 116000.
❌ Disclaimer ❌
Trading futures is highly risky and dangerous. If you're not an expert, these triggers may not be suitable for you. You should first learn risk and capital management. You can also use the educational content from this channel.
Finally, these triggers reflect my personal opinions on price action, and the market may move completely against this analysis. So, do your own research before opening any position.

BTCUSDT: Good Opportunity to buy Bitcoin has dropped sharply since NFP data came out. We can now see price reversing nicely from 109k area.

WE HAVE PREDICTED EVERY MOVE OF BITCOIN - HERE IS WHAT’S NEXT!! Yello Paradisers! we have predicted every single movement on Bitcoin in the past few months, and in this video, I will reveal to you what's going to happen next with the highest probability. Again, on the high time frame chart, we are seeing the ABC zigzag, and right now, we are trading inside of the C wave. Further in the video, we are zooming into the fourth wave.
On the medium time frame, we are seeing bearish divergence that is showcasing an absorption. We are describing Heron-Chorda's target and taking a look at the channel in which the zigzag is being formed. On the low time frame, we are analyzing the Elliott Wave Theory Triple Three pattern, and on the ultra-low time frame, we are analyzing the impulse.
We are describing what kind of conformations we are waiting for. Basically, it's a five ways to the downside. Then, we will be increasing our portfolio exposure on a corrective mode wave to the upside where we will be able to create a tight risk-to-reward ratio position and a high-probability trade setup. Trade smart, trade with a professional trading strategy, be tactical, and enjoy your weekend.
Remember, don’t trade without confirmations. Wait for them before creating a trade. Be disciplined, patient, and emotionally controlled. Only trade the highest probability setups with the greatest risk to reward ratio. This will ensure that you become a long-term profitable professional trader.
Don't be a gambler. Don't try to get rich quick. Make sure that your trading is professionally based on proper strategies and trade tactics.

BTC long with stop lossA leg of our strategy says price will return to broken threshold candle price levels. Meaning the corresponding price candle to the volulme bar that broke threshold will have price back within that candles open and close range; at some point in time. Things get kind of shaky below 15minute with my script but nonethe less we will use our stop loss just below the candles open at 114268. yellow line
Bitcoin is super bullish (4H)This analysis is an update of the analysis you see in the "Related publications" section
If you’ve been following our previous analyses, we had a bullish outlook on Bitcoin from the lower green zone.
An important level on the Bitcoin chart has been reclaimed, and it is expected to move toward the next targets if it consolidates above the red box.
The targets are marked on the chart.
A daily candle closing below the invalidation level will nullify this analysis.

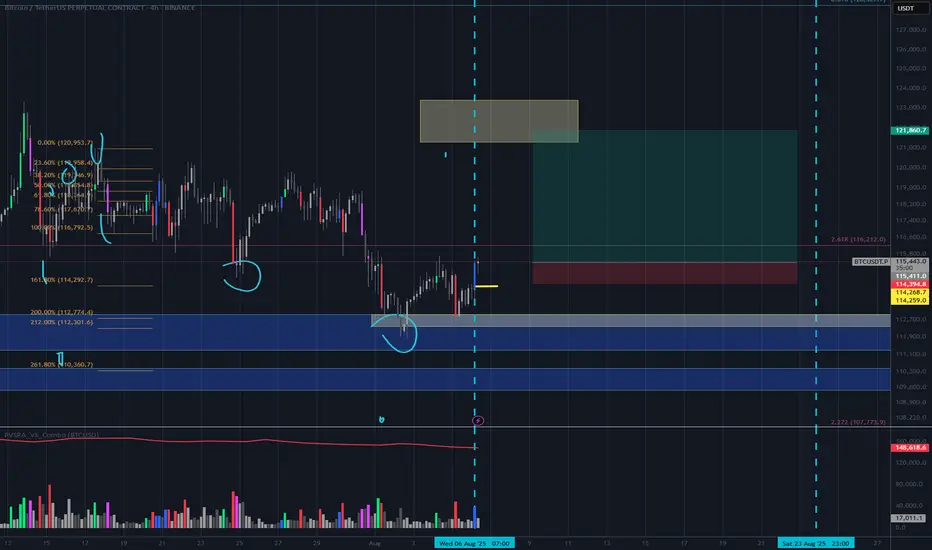
BTC Double Combo CorrectionFollowing a failure to maintain support at several critical technical levels, Bitcoin now appears vulnerable to a potential decline toward the ~$111,000 region. This projection is derived from an Elliott Wave corrective structure identified as a WXY Double Combination. The initial leg of the pattern features an ABC correction terminating near the 0.618 Fibonacci extension, thereby establishing the W pivot. This is succeeded by the X pivot, followed by a sharp, impulsive decline forming the Y wave.
By applying a trend-based Fibonacci extension across the W, X, and Y pivots, we can estimate the probable termination point of the corrective sequence—typically extending into the 1.0 to 1.1 Fibonacci range.
This move is anticipated to unfold over the weekend, potentially presenting a strategic buying opportunity, contingent on a favorable reaction at the projected low. Sunday evening may offer optimal conditions for entry, as traditional market participants—limited to weekday trading—could miss the initial dip, subsequently being compelled to re-enter at elevated price levels.

BITCOIN BTCUSDTTHE STRUCTURE of bitcoin will be watched to see what buyers do at 117k-117,300k zone after one retest on a supply roof .
Am looking up to retest in that zone and tomorrow united states data report will be put into perspective for forward guidance.
12th the consumer price index 14th core ppi and unemployment claims will be critical as traders are waiting .
trading is 100 % probability ,risk management is key.

BTCUSDT 4H: Descending Channel Break—115.4k Retest or 120k Run?BTCUSDT (BINANCE) – 4H
Thesis : Price has broken out of the descending channel (7/25–8/10). Holding above the upper boundary ~115,400 suggests a shift from corrective structure to potential trend continuation higher. A clean retest may offer the better R:R.
Key Levels
• Resistance : 119,200–120,000; 121,500–122,000; 123,800–124,500
• Support : 117,200–116,500; 115,400 (channel top / breakout line); 113,000; 111,000
Momentum/Signals
• MACD is above zero with expanding lines; histogram positive (could cool near resistance).
• RSI ~65 on 4H, rising yet not overbought—room higher, but prone to pullback if 70+.
Trade Ideas
• Long on retest : Look for acceptance above 115,400–116,000 after a pullback (wick + strong 4H close).
– Invalidation : 4H close back inside channel <115,400.
– Targets : 119,500–120,000 (T1), 121,500–122,000 (T2), 124,000 (T3).
• Breakout continuation : If price closes >119,200 with rising volume, consider momentum long.
– Invalidation : 4H close <118,200.
– Targets : 120,000 (T1), 121,500–122,000 (T2).
• Contrarian short (only if failed breakout) : 4H close back below 115,400 and midline rejection.
– Targets : 113,000 (T1), 111,000 (T2).
– Invalidation : back above 116,300.
Risk Management
• Size for 1–2% account risk. Wait for 4H candle confirmation; avoid chasing into 120k supply.
• Weekend liquidity often creates wicks—plan entries around closes, not intrabar noise.
Context : A channel break often precedes a change of character; maintaining higher lows above 115.4k keeps the bullish case intact. Re-entry into the channel would negate.
Disclaimer : This is an analysis, not financial advice. Manage your own risk.

Bitcoin Hits $40,000, It Will Recover —Name Your AltcoinSorry, there is a typo there on the title, I meant to say: Bitcoin hits $114,000, soon to recover.
As you can see from our trading range, Bitcoin just went beyond the lower boundary and hit a new low, the lowest since 10-July but there is good news. There isn't room for prices to move much lower, this is part of the consolidation phase.
The first low happened 25-July and notice the high (bear) volume. The second low happens today and we have lower volume compared to 25-July, but Bitcoin hit a lower low. This reveals that the bearish move is already weak and losing force. It also reveals the fact that Bitcoin is about to recover.
Also notice the RSI, 2H. It hit oversold recently and went the lowest in a long while. Reversals tend to happen when the RSI becomes oversold.
Bitcoin is testing the lower boundary of the trading range, when this happens, the action reverses and moves back up. Prepare to see Bitcoin back above $120,000. It is normal and it will happen... But it is wise to give the market a few days. 5-August was bad last year. It gets bad but it also marks the bottom. Once the bottom is hit, growth long-term.
— Name Your Altcoin
Leave a comment with the altcoins you are holding now and I will do an analysis for you. The altcoins will also recover and we are witnessing just a small retrace. Hold strong as this is the most important part. We will have a very strong new bullish wave develop within days.
As Bitcoin moves to test support, it will reverse to test resistance next. Which one is your top altcoins choice?
Thank you for reading.
Namaste.

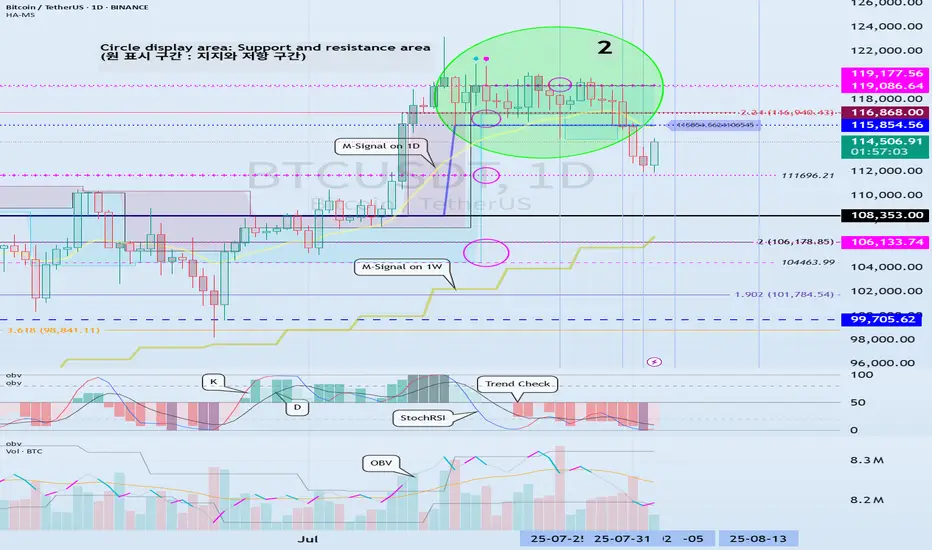
The key is whether it can rise above 115854.56
Hello, traders!
Follow us to get the latest information quickly.
Have a great day.
-------------------------------------
(BTCUSDT 1W chart)
The key is whether it can rise above the newly created DOM (60) indicator point of 119086.64.
If this fails and the price declines, we need to check for support near the previous all-time high (ATH) of 108,353.0.
Since the M-Signal indicator on the 1W chart is rising near 108,353.0, this area is expected to serve as important support and resistance.
-
(1D chart)
This period of volatility is expected to continue until August 6th.
Therefore, the key question is whether the price can rise above 115,854.56 and maintain its upward momentum.
If not, further declines are likely.
-
To rise above 115,856.56,
- The StochRSI indicator must rise within the oversold zone and remain above K > D.
- The On-Bottom Volume indicator must continue its upward trend with OBV > OBVEMA. - The TC (Trend Check) indicator should maintain an upward trend. (If possible, it's best to rise above the 0 point.)
If the above conditions are met and the price rises above 115854.56, it is expected to attempt to rise above 119177.56.
This period of volatility is a significant period of volatility.
Therefore, if the price falls below the HA-High ~ DOM(60) range and encounters resistance during this period, you should prepare for further declines.
-
The basic trading strategy is to buy in the DOM(-60) ~ HA-Low range and sell in the HA-High ~ DOM(60) range.
However, if the price rises in the HA-High ~ DOM(60) range, a stepwise upward trend is likely, while a decline in the DOM(-60) ~ HA-Low range is likely to result in a stepwise downward trend.
Therefore, a split trading strategy is recommended as the basic trading strategy.
When executing a trade, appropriate profit taking secures the liquidity of your investment, giving you the opportunity to seize new opportunities.
To achieve this, you should consider your intended investment horizon before initiating the trade and divide the trade accordingly.
-
The HA-Low indicator on the 1D chart is currently at 89294.25.
Therefore, I believe the market believes it's in a position to take profit.
-
Thank you for reading to the end.
I wish you successful trading.
--------------------------------------------------
- This is an explanation of the big picture.
(3-year bull market, 1-year bear market pattern)
I will explain in more detail when the bear market begins.
------------------------------------------------------
Technical Analysis: All About Its Origin
Technical Analysis is the discipline that studies and graphically records the price and volume changes of a stock or asset, with the aim of exploiting recurring patterns and phenomena with predictive characteristics.
The origins of Technical Analysis date back to 17th-century Japan, in the rice futures markets of Osaka. After a century of internal wars among the daimyo—Japanese feudal lords—General Tokugawa emerged victorious at the Battle of Sekigahara (1600), initiating the unification of Japan. To maintain the loyalty of his subjects, Tokugawa, appointed Shogun, consolidated his power and ensured the allegiance of his followers by concentrating the political-military elite and their families in Edo (modern-day Tokyo).
At that time, the primary source of income for the daimyo was rice collected from the peasants working their lands. Since transporting rice to Edo was impractical, it was stored in the port of Osaka. The proximity of the daimyo in Edo sparked a competition for prestige, manifested through luxuries and other excesses. To sustain this lifestyle, the daimyo sold stored rice and even future harvests. For this “future rice,” warehouses began issuing contracts known as “empty rice.” These contracts were traded in a secondary market, giving rise to one of the world’s first futures markets.
The most prominent trader in this market was Munehisa Homma, who operated in the early 18th century. For Homma, markets were heavily influenced by the psychology of investors, who sometimes perceived a harvest differently from reality. In his book, *The Fountain of Gold*, he expressed ideas that remain highly relevant today, particularly what many Western traders know as contrarian opinion:
“When the price of rice begins to rise, orders come in from all directions at once, and soon the Osaka market joins the frenzy. The price of rice rises faster when people place orders even for stored rice, and it becomes clear that a buying fever is underway. But when you want to be in the position of placing buy orders like everyone else, it’s important to be on the side of those placing sell orders. When people move in unison, rushing westward with the determined intention of participating in the rise, that’s the moment for you to head east, and you will discover great opportunities.”
Steve Nison, an investor who popularized the use of Japanese candlesticks in the West, states in his book *Beyond Candlesticks*:
“In the material I translated, candlestick charts are often called Sakata charts, in reference to the port city of Sakata, where Homma lived. However, based on my research, it is unlikely that Homma used candlestick charts. It is more likely that these charts were developed in the early part of the Meiji period in Japan (late 1800s).”
It is worth noting that, although Homma may not have used candlestick charts, this type of graphical representation was the evolution of centuries of experience using price records for predictive purposes.
The Revolution of Japanese Candlestick Charts
The graphical representation of prices has been a determining factor in the evolution of technical analysis, marking a clear distinction between investment approaches in the East and the West. While traditional bar charts, predominant in the West, were limited to showing opening and closing prices, Japanese candlestick charts offered a more comprehensive view of investor psychology. These charts incorporated not only the opening and closing prices but also the highs and lows of each session, represented intuitively through the body and wicks of the candles.
Perhaps Western investors, constrained by the simplicity of bar charts, developed an approach more focused on studying price formations, while the Japanese could make decisions based on the analysis of small groups of candles. Over time, however, both approaches proved equally practical, and a multi-timeframe understanding became part of the operations of both Western and Japanese investors.
An example of the application of a multi-timeframe approach in the West is found in the father of modern technical analysis, Richard W. Schabacker, who, despite his short life, left a prolific body of work. In his book *Technical Analysis and Stock Market Profits* (1932), he classifies markets into major movements (monthly), intermediate movements (weekly), and minor movements (daily). In Japan, Goichi Hosoda, the creator of the Ichimoku Kinko Hyo indicator, is the best example of an investor who dedicated his life to cataloging and studying price formations beyond the use of candlestick patterns.
Over time, modern Western investment platforms adopted the innovations of Japanese candlestick charts, integrating the ability to display highs, lows, openings, and closings in a single format.
In the early 20th century, scholars of charts in the West were known as chartists, but today, “Chartism” is associated with a classical methodology popularized by journalist and investor Richard W. Schabacker (1899–1935) and later by the book *Technical Analysis of Stock Trends* (1948) by authors Robert D. Edwards and John Magee.
Theory on the Emergence of Technical Analysis
Since the dawn of humanity, people have sought to represent the phenomena around them to understand or communicate information. Whether through cave drawings, symbols, or written records, visual representation has been a fundamental tool for making sense of the world. Undoubtedly, price fluctuations were a phenomenon that invited analysis.
The earliest investors, using graphical representations, aimed to find order in chaos. By meticulously recording price movements, these pioneers likely discovered something surprising: repetitive patterns that seemed to predict future behavior. This discovery must have been thrilling, as it offered the promise of significant profits, often with seemingly low risk.
Without needing to understand market psychology, as later technical analysts would, these early investors found a practical advantage in these patterns. When enough of them identified and acted on the same pattern, it tended to fulfill itself more frequently, reinforcing its validity. Thus, what began as an intuitive observation evolved into a structured practice, laying the foundation for what we now know as Technical Analysis: a discipline that thousands of investors use to interpret market behavior and make informed decisions.
Fun Fact
The first work to describe the phenomenon of stock market investing is titled *Confusion of Confusions* (1688) by José de la Vega, set in Amsterdam, the financial hub of Europe at the time. More than a detailed study of the investment methods of the era, this novel seeks to entertain and inform readers about the risks of speculation.
Its author, moreover, employs a narrative style that surpasses even the florid prose of his contemporaries:
“They strive to perpetuate the unrest of those who frequent their dealings, and just as they imprison them in their towers, they cast the locks into the sea so that the hope of ever removing the bolts may never flatter them.”
Conclusions
Some might consider the history of technical analysis a curious but irrelevant tale for modern practice. However, history shows us that markets are more than just numbers—they are a reflection of human psychology. Far from being a mere catalog of tricks to memorize, technical analysis invites us to understand psychological dynamics to make informed decisions.
Recognizing that markets are shaped by historical patterns grants us a strategic advantage. By studying how past investors interpreted prices and emotions—from rice traders in 17th-century Japan to modern analysts—we can anticipate market movements with greater precision. This perspective not only enriches our trading but also positions us as more aware and prepared investors in an environment where collective psychology remains the dominant force.
References
Nison, S. (1994). *Beyond Candlesticks: New Japanese Charting Techniques Revealed*. New York, NY: John Wiley & Sons.
Schabacker, R. W. (1932). *Technical Analysis and Stock Market Profits*. New York, NY: B.C. Forbes Publishing.
Edwards, R. D., & Magee, J. (1948). *Technical Analysis of Stock Trends*. Springfield, MA: John Magee.
Rabassa, Y. (n.d.). *How to Master Japanese Candlesticks?* . YouTube.
Bitcoin (BTC/USDT) – Bearish Scenario Remains in Focus4H Chart Analysis – Structural + Price Action Insight
Bitcoin is currently trading inside a descending minor channel (orange), which is part of a larger complex correction pattern, potentially a contracting running flat or diametric in NeoWave context. The sequence A to G may suggest that the market completed its G-leg after bouncing off the lower support.
Now, BTC has reached the upper boundary of the orange channel, which aligns with a strong resistance zone around 116.8K–117K.
⸻
✅ Primary Scenario (Bearish Bias):
As long as BTC fails to break and sustain above 116,800 – 117,000, the current move can be interpreted as a pullback within the correction, with high probability of price heading back toward the green liquidity/support zone near 110,800 – 111,400.
This could be a continuation of the broader corrective structure, or even the beginning of a new downward cycle.
⸻
❗ Alternative Scenario:
If bulls manage to break above 117,000 with strong momentum and confirmation (e.g., breakout + retest), the structure may shift bullish with short-term targets near 118,500 – 120,000.
⸻
🎯 Key Takeaways:
• Watch price action closely at the current resistance zone.
• Bearish confirmation (e.g., bearish engulfing, rejection wicks, or supply absorption signs) is required before considering short entries.
• High R:R setups emerge near channel extremes with clear invalidation levels.

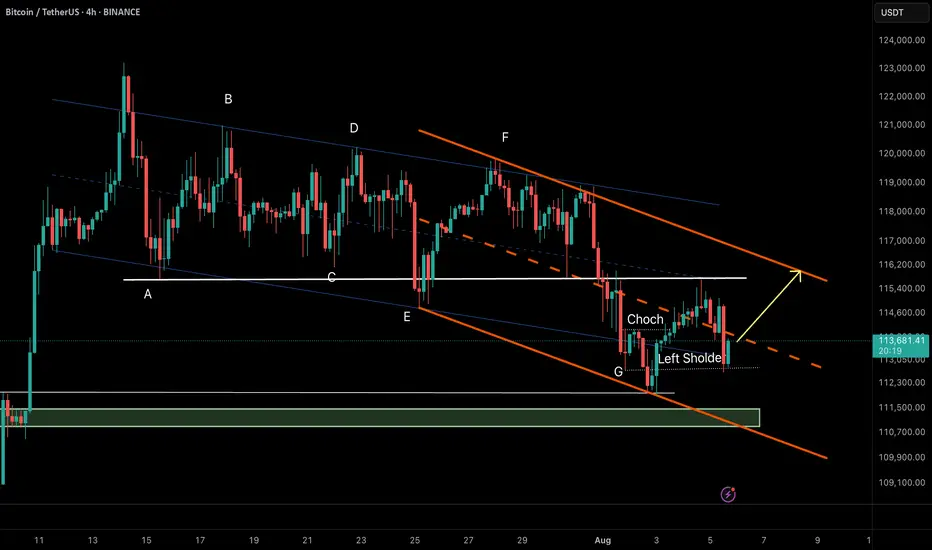
Bitcoin (BTC/USDT) – RTM Reversal Pattern in Action🔸 Market Structure:
Bitcoin has formed a descending channel after a prolonged correction. Recently, price tapped the channel bottom and printed a CHoCH (Change of Character), indicating a potential reversal.
The price has now retraced to the left shoulder of a potential inverse head & shoulders pattern—an RTM classic structure—which held as support, suggesting bullish continuation.
⸻
🔸 Key Technical Signals:
• ✅ CHoCH confirmed at demand zone near $112,300
• ✅ Retest of the left shoulder validates bullish structure
• ✅ Holding above the internal bullish trendline
• ✅ Price aiming toward upper channel resistance
⸻
🎯 Target:
$116,200 – Top of the descending channel & next key resistance.
❌ Invalidation:
Break and close below $112,800 would invalidate the current RTM setup and open room for deeper correction.
⸻
📌 Summary:
This is a textbook RTM reversal:
CHoCH → Retracement → Left Shoulder Test → Continuation
As long as the structure holds, we remain bullish toward the channel top.
TradeCityPro | Bitcoin Daily Analysis #143👋 Welcome to TradeCity Pro!
Let’s dive into the Bitcoin analysis. Today, the weekly candle will close and the market will return to its normal condition starting tomorrow. It’s very important to have a solid analysis today so we can make profits in the upcoming week.
⏳ 4-Hour Timeframe
Yesterday, Bitcoin had another short drop and wicked down to around the 111747 zone, but then returned above the 0.618 Fibonacci level.
💥 Even from this timeframe, it’s clear that a long trigger has formed on lower timeframes, and it seems like a V-pattern is being formed, which we’ll analyze in the lower timeframes.
📊 If the market activates the long trigger today, I’ll try to enter so I don’t miss out in case a bullish move starts with the new weekly candle and I can have an open position.
✔️ The RSI oscillator also entered the oversold zone yesterday and exited it. Since Bitcoin is still above the 110000 zone, I still view the trend as bullish. So this double bottom that formed on the RSI is a very good sign for bullish momentum in the market.
⏳ 1-Hour Timeframe
In the 1-Hour timeframe, we had a short trigger at the 114560 zone in the previous analysis, which was activated and the price moved down. I had mentioned in that analysis that I wouldn’t open a short position with this trigger, and I didn’t.
🔽 Now the position of that trigger has shifted and moved to the 114028 zone. Today I’m watching the market closely, and if the price moves up toward this trigger with increasing volume, I’ll open a long position if 114028 breaks.
🔍 This is one of those positions where you can use either a small or large stop loss. If you go with a larger stop, you can ride the next bullish leg that may push the price back toward the 120000 zone. But if you go with a smaller stop, it becomes a short-term trade that will be closed with smaller risk-to-reward ratios.
📈 Personally, I prefer to go with a larger stop loss so that if Bitcoin starts another bullish leg, I can have a well-positioned entry. (Just make sure to practice proper risk management — I personally won’t risk more than 0.25% on this position since the main momentum hasn’t entered yet.)
💫 As for short positions, I won’t provide any triggers for now because I’m not opening shorts myself, and if you open one, I won’t be able to guide you on what to do with it.
❌ Disclaimer ❌
Trading futures is highly risky and dangerous. If you're not an expert, these triggers may not be suitable for you. You should first learn risk and capital management. You can also use the educational content from this channel.
Finally, these triggers reflect my personal opinions on price action, and the market may move completely against this analysis. So, do your own research before opening any position.

Bitcoin Ready for Takeoff - $150K Target Ahead! MARKETSCOM:BITCOIN is showing impressive strength after successfully retesting its May high and bouncing back with conviction. This level, along with the 50 EMA, is currently acting as a strong support zone. Holding above this area signals that buyers are in control, and this zone now serves as a major support for the ongoing bullish trend.
At the moment, CRYPTOCAP:BTC is facing minor resistance in the $115K–$116K range. A decisive breakout above this level is likely to trigger strong momentum, opening the doors for a new all-time high. Once this resistance is cleared, our previous projection of $150K comes into play as the next major target.
For now, it’s crucial for MARKETSCOM:BITCOIN to hold the current support zone to maintain the bullish structure. As always, traders should manage risk effectively and place stop-losses to protect their capital in case of unexpected volatility.
Follow Our Tradingview Account for More Technical Analysis Updates, | Like, Share and Comment Your thoughts

Bitcoin Faces Pressure Below $114,000 – What’s Next?Hey crypto community, BINANCE:BTCUSDT continues to face pressure as the price slips below $114,000 during Thursday’s trading session. Although there was an attempt to break through the $116,000 resistance, buying power remains weak, mainly due to diminishing demand from institutional players.
A clear indication of this trend is seen in the ongoing outflows from US-listed Bitcoin ETFs – on Tuesday alone, $196 million was withdrawn, extending the losing streak to four consecutive days.
However, there’s a glimmer of hope from Asia: SBI Holdings in Japan has recently filed for approval of a dual-asset ETF that includes both BTC and XRP. This could be a sign of a fresh wave coming from the East.
On the chart, if BTC fails to reclaim the $114k – $116k range soon, further downside potential remains. But keep in mind, deep corrections often provide an opportunity for large players to accumulate.
👉 What do you think about this correction? Will BTC hold its ground against selling pressure? Let me know your thoughts!
