$BTC Market Outlook – Repeating Pattern?CRYPTOCAP:BTC Market Outlook – Repeating Pattern?
Bitcoin appears to be following the same repeating pattern we saw back in May–June 2025. On the Daily timeframe, a clear bull flag is forming, with both MACD and RSI confirming the setup.
In the previous instance, the pattern included two pullbacks before a strong rebound.
Currently, we’ve already seen a bounce off the 50 EMA, which acted as solid support.
You can clearly see the striking similarities, with both the MACD and RSI showing the same bearish divergence.
If history repeats itself, the likely scenario is:
Rejection near the top resistance at $119.5k
Pullback toward the 100 EMA to find support, signaling the end of the correction
The structure is mirroring the earlier move almost perfectly.
Key support levels: $115.6k, $112k, $109k, and in case of a deeper (low probability) pullback: $104k
Key resistance levels (possible rejection zones): $119.6k, $122.2k
If $122.2k is broken, we could be looking at a new ATH.
DYOR 📊
BTCUSDT trade ideas

Bitcoin Analysis – August 8, 2025After consolidating between $120K and $116K for two weeks,
last week Bitcoin broke below this range with a strong bearish candle. 📉
Part of the leftover liquidity has been swept, but the candle formations at the top indicate profit-taking by buyers and increasing selling pressure at higher levels.
On the retracement toward the $118K zone, sellers still showed dominance.
As we mentioned in previous analyses, Bitcoin wouldn’t truly enter a corrective phase unless it reached the $108K–$104K zone.
However, with the current market structure, a new wave of sellers is joining in, and we’re already seeing its impact on altcoins.
While we may not have full confirmation yet for a sustained downtrend,
the market signals suggest Bitcoin has entered a corrective phase.
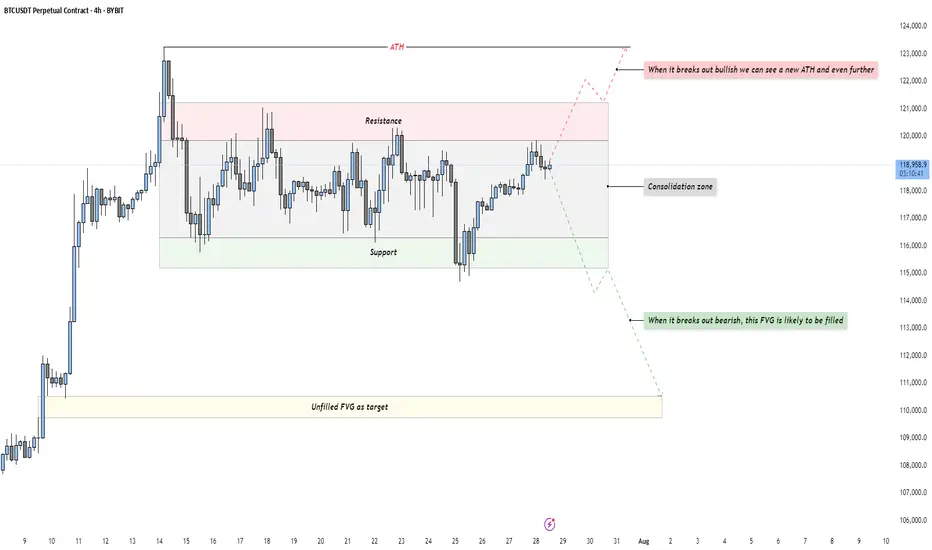
BTC - Bulls vs Bears: who will win?Market Context
Bitcoin is trading in a tight consolidation just below its all-time high after a strong impulsive rally. This phase represents a balance of power between buyers and sellers, with neither side able to take control yet. Such a pause in momentum at this key level often builds pressure for a breakout move as liquidity pools accumulate above and below the range.
Consolidation Phase
The current range is clearly defined by a resistance area at the top and a support area at the bottom. Price has been oscillating within these boundaries without any sustained breakout attempts. This range-bound behavior is an essential part of the market cycle, as it allows larger players to build or distribute positions. The longer price stays in this box, the more significant the breakout that follows tends to be.
Bullish Breakout Scenario
If price breaks out decisively above resistance, it would indicate buyers have absorbed all the supply at these levels. Such a breakout opens the path to a new all-time high and could potentially extend far beyond as trapped shorts are forced to cover. For traders, a retest of the breakout level on lower timeframes could provide a low-risk entry point for continuation to the upside.
Bearish Breakout Scenario
On the flip side, if support fails, the market will likely gravitate toward the unfilled Fair Value Gap left behind during the previous rally. This inefficiency becomes a natural draw for price, offering a logical downside target for a corrective move. A clean break below the range followed by a retest from underneath could present shorting opportunities for those aiming to capture that move into the FVG.
Final Words
Patience and precision are key when dealing with setups like this. Let the market come to your level — and react with intent.
If you found this breakdown helpful, a like is much appreciated! Let me know in the comments what you think or if you’re watching the same zones.
BTC ready to DUMPAre you ready for Bitcoin Dump ?
As you can see, BTC break the lower band of channel and finished it's pullback to it.
Not it's ready to go Down

New Bullish Rally About To Start Toward The 130k🔥 Well, the previous update played out perfectly — the price dropped to the $12K support area and bounced back strongly. Now, let’s talk about my next plan for Bitcoin
📥 At the moment, there’s a clear bullish flag forming on the chart. Price has bounced from the 1.618% PRZ (Potential Reversal Zone), which I’ve labeled as wave C of the larger corrective ABC structure.
📈 From here, I’m expecting a new bullish rally, with the next major target around $130K.

16 Year Cycle looks completeYou can refer to my chart linked below (about the "Summer Rally"), which did indeed happen.
I was skeptical the Summer Rally would actually happen, as it was a bit predictable, but there we go.
Distribution is also being seen on lower time frames.

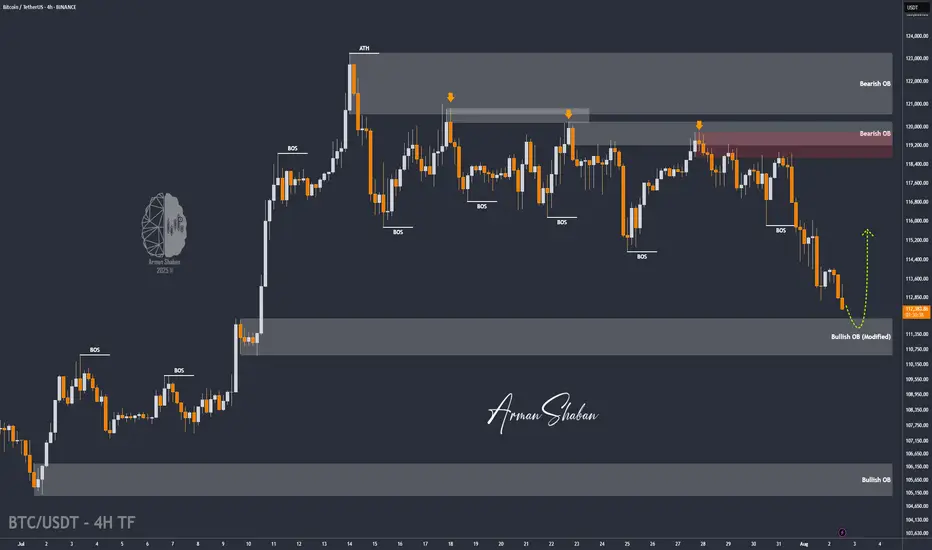
BTC/USDT | Bitcoin Eyes Rebound from $110K Support Zone! (READ)By analyzing the Bitcoin chart on the 4-hour timeframe, we can see that after reaching a new high at $123,218, the price began to pull back and has now corrected down to around $112,500. I expect the current volatility to ease soon. The next critical support zone lies between $110,500–$112,000 — watch price action closely here, as BTC could bounce from this area and push back toward $116,000+. Other key demand zones are located at $109,000, $107,900, and the $105,000–$106,000 range.
Please support me with your likes and comments to motivate me to share more analysis with you and share your opinion about the possible trend of this chart with me !
Best Regards , Arman Shaban
BTC levels for August 2025Simple channel on BINANCE:BTCUSDT.P
retest of equilibrium with main liquidations of 20x - 40x leverages around 113600
this weekend or if we will see some bad macro news drop by end of 12-15 august
109900
keep charts simple

500% APY with Low Risk — Fake? Fact!This is not clickbait! This is a real working strategy! Read to the end!
Hello!
My name is Michael Hypov!
I have been trading for 16 years, and during this time I have seen it all: booms, crashes, crises, hype, and long periods of market silence.
My articles on technical and fundamental analysis, as well as my forecasts for Forex currencies and cryptocurrencies, are translated into 20 languages and gather millions of views.
But what I want to share with you today became a turning point in my understanding of trading.
How it all began
In 2019, I moved to Malaysia and entered the Universiti Sains Malaysia (USM) — the second most prestigious university in the country after UM.
I was lucky to get into the Master's program in Data Science and Analytics. It was an intensive course where we deeply studied mathematical analysis, statistics, neural networks, and machine learning — at a time when no one had even heard of ChatGPT yet.
This knowledge literally turned my understanding of trading upside down.
I suddenly saw that many market processes could be explained by strict mathematical laws, and therefore — predicted with high accuracy.
A bit of theory in simple terms
One of the key discoveries for me was the law of normal distribution.
Visually, it is represented by the “Gaussian bell” — a symmetrical curve where most values are in the middle, and extreme values are rare.
To make it clearer, let me give you an example.
Imagine baking muffins
The dough is the same for all, and the oven is the same. But the result is always slightly different:
most muffins turn out average in size
some are slightly smaller or slightly larger
very few are either tiny or gigantic.
If you draw a chart of “how many muffins of what size,” you’ll get that same bell-shaped curve: many in the center, few on the edges.
Examples from real life
We see the same principle everywhere:
uman height — most people are of average height, very short and very tall are rare
school grades — most students have average grades, and extremes are rare
apple weight in an orchard — most are about the same, but there are a few very small or very large ones.
💡 To put it simply: in nature and life, most values are “average,” and extremes are rare.
Why this matters in trading
In trading, the price at any given moment is a random variable.
We cannot know exactly where it will be in a second or an hour, but we can calculate the average value that is most likely to be reached.
If we return to the bell curve, the blue dotted line in the centre is the price the market tends to most often.
For each time frame, you can calculate this average price and use it as a guide.
Box Plot — a chart that says more
The law of normal distribution can be conveniently represented using a Box Plot (“box and whiskers”).
The median = the expected value,
The “box” — the range of 25% deviations,
The “whiskers” — minimum and maximum within 1.5×IQR (where IQR is the size of the box body).
If you plot the asset price along the X-axis and rotate the graph by 90°, the shape will strikingly resemble a Japanese candlestick.
And if you build such “boxes” for different time frames, you get a clear picture of market fluctuations, which in some cases is more informative than a candlestick chart.
Intrabar BoxPlot and two patterns
Recently, TradingView introduced the Intrabar BoxPlot indicator. It builds these “boxes” right on the chart and marks the medians and closing prices.
On the chart, these boxes are displayed with colored dots for the medians of each period and blue dots for the closing price levels.
Comparing the price chart with the BoxPlot, you can identify two patterns:
1/ The market always tends toward the median; therefore, with high probability, if the close for the period was within the box, the candle of the next period will reach the median of the last closed candle.
2/ If the close occurred outside the box, this is a signal for a trend continuation. Moreover, the further the closing point is from the median, the stronger the signal for continued movement.
These patterns work both on 12-month candles and on second-level time frames, which makes it possible to conduct cross-analysis from macro to micro trends and build a trading strategy that delivers excellent results: on large time frames, we identify major trends, and on minute and second charts, we determine entry and exit points on micro-waves within the day.
How it turned into a strategy
Three years ago, I decided to turn this observation into a full-fledged trading system.
At first, I wrote a thesis based on this idea, forecasting Bitcoin’s price.
For three years, I tested and refined the algorithm, brought in a team of programmers who helped me build a custom trading bot from scratch.
Since trading requires a limited set of parameters — closing/opening prices, high/low, as well as box parameters and expected value — the bot’s neural model is well trainable and capable of not only conducting cross-analysis but also identifying patterns and inefficiencies in the market on its own. Moreover, the bot self-learns and improves its trading over time.
Results
We trade on Binance futures, with an average leverage of 0.63x — less than one, which almost eliminates the risk of liquidation.
We don’t use stop-losses: if a trade goes against us, the bot moves to a higher time frame and averages the position.
Maximum leverage — 3x.
Backtest results show returns from 100% to 500% per year, depending on the market cycle. On a bear market, we reduce leverage to lower risks, which also reduces returns.
The strategy has now been trading on a real account for more than a month.
The first month of trading brought +31% to the deposit.
Even giving 50% to the fund, when calculating compound interest (with reinvestment of income), your annual income will approach 500%
Thank you very much for reading to the end!
I will be glad to receive your comments under the posts and questions in private messages

Bitcoin Eyes Higher Targets as Daily Structure HoldsBitcoin is moving higher on the daily timeframe after breaching all key resistances below its all-time high. A test of the channel’s upper boundary is likely before a corrective phase sets in.
BTC has cleared multiple resistance levels, leaving only the all-time high ahead. Once this final barrier is breached, it could trigger an accelerated push into the channel’s high resistance zone. However, this area may act as a cap for price action, leading to a rejection and rotation back toward established support.
Key Technical Points:
- Current Support: $119K remains critical to keep bullish projection intact
- Immediate Target: Channel high resistance near all-time highs
- Potential Rotation: Rejection at resistance could lead to $100K retest
From a technical standpoint, Bitcoin’s price is gravitating toward the upper regions of its trading channel. The breakout through prior resistance levels has created a clear path toward the all-time high, and beyond that, the upper boundary of the channel.
This resistance zone is significant, as historical price action suggests that Bitcoin often pauses or reverses after extended runs into high time frame resistance. A rejection from this area would not necessarily end the bullish structure, but it would likely trigger a rotational move back toward $100K support, placing BTC into a broad consolidation phase within the channel.
The primary bullish condition is that $119K support continues to hold on a closing basis. This level now acts as the structural anchor for the current uptrend. A breach below it would shift market dynamics toward a deeper correction and possibly retesting lower range levels.
In the near term, price action remains poised for further upside. Traders should watch closely for momentum shifts as BTC approaches the high resistance zone. Sustained buying volume through this area could open the door to rapid price discovery, while a rejection would confirm the anticipated range-bound behavior between $100K and the channel high.
What to Expect in the Coming Price Action
Bitcoin is likely to continue trending toward its channel high. A rejection from this zone could lead to a prolonged range between $100K support and the upper channel resistance.

Lingrid | BTCUSD Consolidation PHASE ContinuesBINANCE:BTCUSDT is bouncing from the confluence of an upward trendline and the $112,175 support level, forming a higher low structure. Price remains within an upward channel, with the current pullback holding above key structural support. As long as the higher low remains intact and price stays above $112,175, a continuation toward $120,500 is likely. Momentum appears to be rebuilding within the bullish framework after a period of consolidation.
📉 Key Levels
Buy trigger: Break and hold above $114,680
Buy zone: $111,500 – $112,500
Target: $120,500
Invalidation: Break below $111,000
💡 Risks
Failure to hold the trendline could trigger deeper downside
Resistance at $114,680 may reject early attempts to move higher
Market may stay range-bound if volume remains low
If this idea resonates with you or you have your own opinion, traders, hit the comments. I’m excited to read your thoughts!

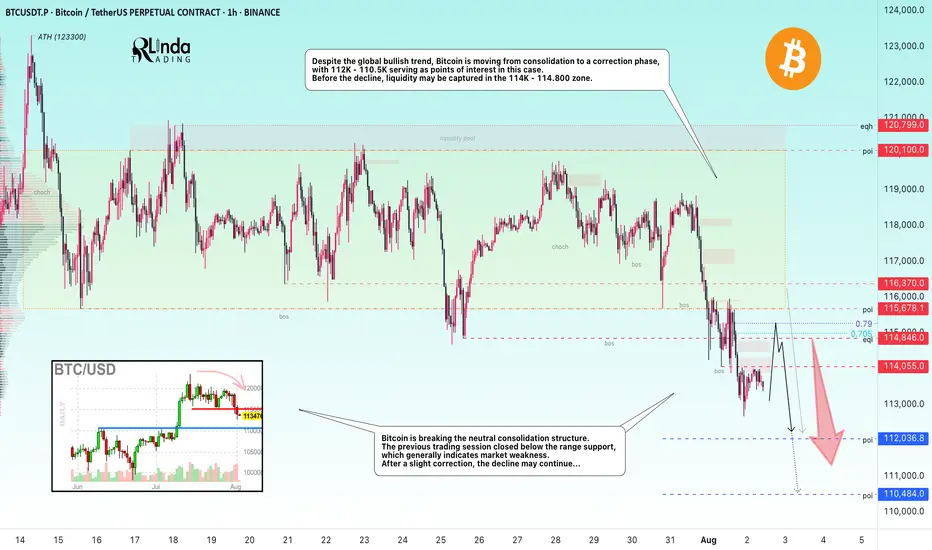
BITCOIN → From consolidation to distribution. Market weaknessBINANCE:BTCUSDT.P is moving from consolidation to a correction phase. The price broke through the support zone of 114.5–115.5, closing within the Friday trading session in the sell zone...
Previous idea from July 22: BITCOIN → Consolidation and compression to 116K. Correction?
The fundamental background is shifting to neutral, the hype has temporarily ended, and there are no bullish drivers yet. And for the health of the market, a correction is needed. Bitcoin is breaking the neutral consolidation structure. The previous trading session closed below the support range, which generally indicates market weakness. Despite the global bullish trend, Bitcoin is moving from consolidation to a correction phase, with 112K - 110.5K serving as points of interest in this case. Before the fall, liquidity may be captured in the 114K - 114.800 zone.
Resistance levels: 114.05, 114.85, 115.67
Support levels: 112.03, 110.48
After a strong movement, the market may enter a correction or local consolidation, during which it may test the specified resistance zones before continuing its downward movement to the zone of interest and liquidity at 112 - 110.5.
Best regards, R. Linda!
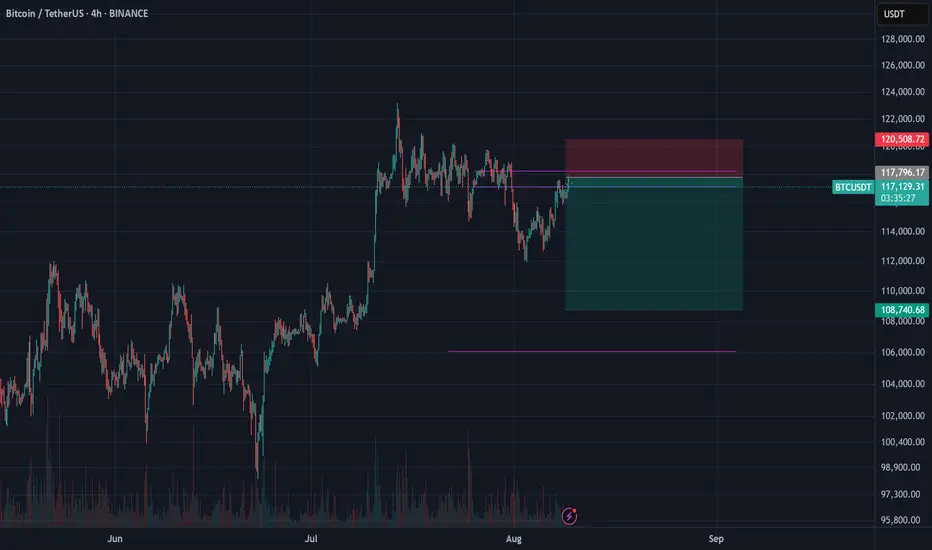
BTCUSDT 111k first then UPHi fellow traders,
Here’s my current BTCUSDT view on the 4H chart, based on Elliott Wave principles.
After a corrective structure, we’ve seen a strong bounce, and price is now approaching a key area of interest. I’ve marked the zones I’m watching for potential buys and sells:
🟨 Lower box: Potential buy zone if price pulls back with a corrective structure.
🟨 Upper box: Area of interest for taking partials or looking for potential short setups, depending on how price reacts.
If momentum continues, we could see BTC pushing into the 125K region, which aligns with fib extensions from previous swings.
As always, I’m waiting for confirmation before making any entries.
Let me know what you see on your end!

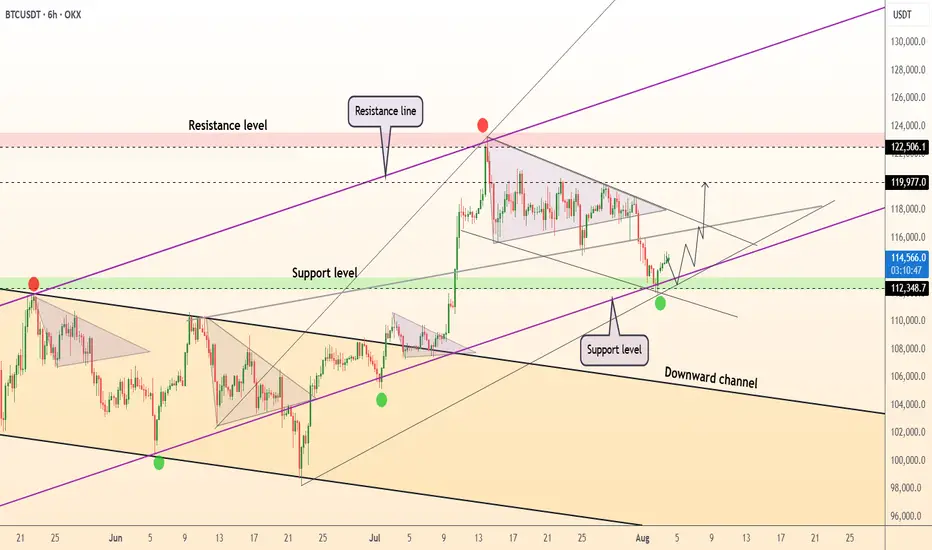
DeGRAM | BTCUSD reached the support level📊 Technical Analysis
● BTCUSD has bounced from confluence support at 112.3k–114.8k, reclaiming the ascending support line and validating the lower boundary of the rising triangle.
● Price action suggests a bullish continuation setup with targets at 119.9k and extension to the upper resistance near 122.5k–125k.
💡 Fundamental Analysis
● US labor data slowdown and dovish Fed commentary have pulled real yields lower, boosting crypto demand.
● Glassnode reports ongoing whale accumulation and rising stablecoin inflows, signaling positive capital rotation into BTC.
✨ Summary
Long above 114.8k. Targets 119.9k → 122.5k+. Setup invalidated on a break below 112.3k support.
-------------------
Share your opinion in the comments and support the idea with a like. Thanks for your support!
TradeCityPro | Bitcoin Daily Analysis #142👋 Welcome to TradeCity Pro!
Let's get into the Bitcoin analysis. Yesterday, Bitcoin continued its correction and we need to see what is going to happen in the market today.
📅 Daily Timeframe
First, let’s take a look at the higher timeframe. On the daily chart, that curved upward trendline we had was broken by yesterday's candle, and the breakout candle had high volume.
✔️ For now, I don’t consider this trendline as broken and I’m waiting to get confirmation of the break.
🔍 Currently, the price is in a correction phase, and this correction is quite natural since the price had very low volatility for a long time and was stuck below the 120000 zone.
💥 But no trend reversal has occurred yet. In my opinion, as long as the price is above the 110000 zone, the trend is bullish, and I will consider the trend reversal confirmed only if a lower high and a lower low below 110000 are formed.
⏳ 4-Hour Timeframe
Yesterday, the corrective movement of the price continued, and after a pause at the 0.5 Fibonacci level, another bearish leg formed down to the 0.618 zone.
🔔 The RSI oscillator also entered the oversold area and then exited it again. I believe there’s a high possibility that until the end of the week, Bitcoin will range in these areas and the probability of a bullish or bearish move is much lower.
🔽 However, if the 0.618 Fibonacci level breaks, the price can move to lower areas like the 111000 zone. I think the likelihood of this happening in the future is high because that zone is a strong PRZ, and at the same time, it counts as a pullback to the 110000 zone.
📈 In the bullish scenario, if the price is supported from this area and starts to move upward, since we currently have no highs below the 116000 zone, we need to wait until the first bullish leg is formed and then enter on the second leg after the new high is broken.
⚡️ For now, I’m not opening any short or long positions. I prefer the price to form more structure so I can make a more comfortable decision.
❌ Disclaimer ❌
Trading futures is highly risky and dangerous. If you're not an expert, these triggers may not be suitable for you. You should first learn risk and capital management. You can also use the educational content from this channel.
Finally, these triggers reflect my personal opinions on price action, and the market may move completely against this analysis. So, do your own research before opening any position.

Bitcoin Traps Bulls and Bears – Real Move Next?Bitcoin is trading in a descending channel on the 4H chart, with two recent fakeouts — one above resistance and one below support — trapping traders on both sides. After reclaiming support, BTC is pushing toward the upper boundary with rising volume, hinting at strong demand. A breakout above $119K could drive a rally toward $125K–$135K.
Cheers
Hexa
BINANCE:BTCUSDT BITSTAMP:BTCUSD

Don’t Panic Yet… BTC Might Just Be ReloadingBitcoin is doing something it’s done before.
Every time CRYPTOCAP:BTC has pulled back into this key rising zone, it’s bounced back stronger. The last few dips got absorbed right at this level, and we’re seeing the same setup again now.
Price recently flipped a major resistance into new support, and that level is being tested again. If it holds, we’re likely looking at another leg up possibly towards $124K.
Nothing is broken. Just a typical retest in an uptrend.
DYOR, NFA
Thanks for the reading

BITCOIN BITCOIN is cooling off from last attempted all time high at 123k 122k zone .the daily ascending trend and 4hr is giving a demand floor which will be watched on possible breakout from the structure ON 4HRS
On 4hrs we have a break out of a descending trendline and followed by two successful sell off connecting us from our current all time high. if we dont reclaim that supply roof by returning to buying floor ,then sellers will push to break the daily ascending trendline acting as dynamic support and our target from our EMA+SMA STRATEGUY IS 99-100 ZONE and on a flip side if we see buying liquidity from cooperate buying ,then we will hope for retest if 123k and extend the greed buying 128k-130k-135k will be targeted.
trading is 100% probability and any key level can fail, pls manage your risk
A trader without capital is a demo trader.
As a trader, your biggest weapon in the financial market is your capital,dont play or gamble with it.
GOODLUCK,PLS LIKE AND SHARE IF YOU LIKE THE IDEA AND INSIGHT.

Bitcoin (BTC): Seeing Resistance At $116K, Waiting For BreakoutBitcoin had a good rally, where after reaching the local resistance zone, we had the rejection, a smaller pullback.
The plan has not changed; we are looking for that breakout, which would lead us back into the sideways channel and potentially give us the retest of ATH!
Swallow Academy

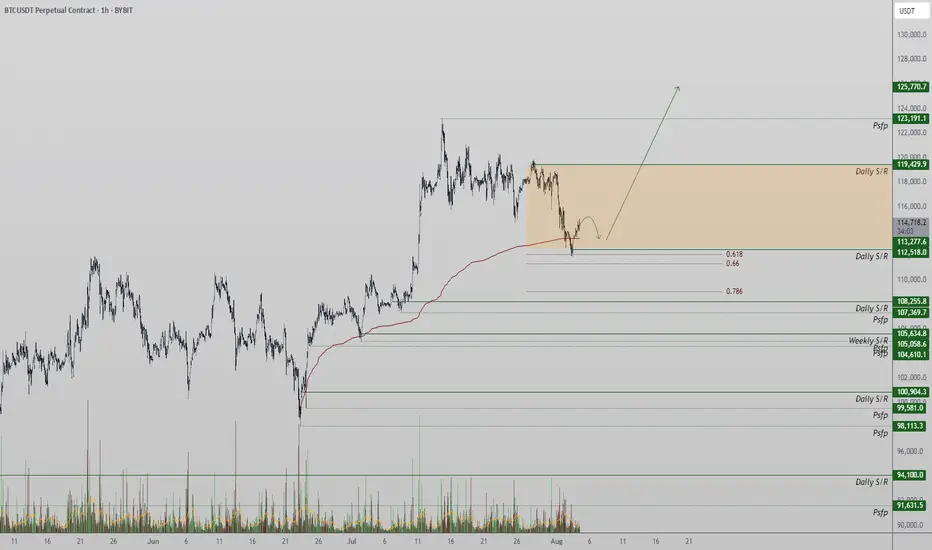
Bitcoin Tests Major Support at $112,500Bitcoin is currently in a local downtrend, with price now testing a major support zone around $112,500. This level, backed by multiple technical confluences, may serve as the base for a potential reversal if defended on lower timeframes.
Price action has been drifting lower over the past sessions, finding its way into a key support zone defined by the 0.618 Fibonacci retracement, the blue upward trendline, and prior structure. The $112,500 region now acts as the immediate level to hold from an intraday perspective. If bulls are able to defend this zone and volume confirms participation, the probability of a rotation higher toward $123,000 increases significantly.
Key Technical Points:
- Support at $112,500: Aligned with 0.618 Fibonacci, trendline support, and structural pivot
- Intraday Confirmation Required: Holding this level on lower timeframes improves the
probability of reversal
= $123,000 Target in Sight: Technical target for rotation if a bottoming structure forms and holds
From a short-term perspective, Bitcoin has clearly shifted into a local downtrend, creating a sequence of lower highs and lower lows. However, the current area around $112,500 presents a strong confluence of support that could interrupt this trend. This zone includes the 0.618 Fibonacci retracement from the most recent swing move, a respected upward trendline (blue), and a previous structural pivot. Together, these elements increase the probability of a bounce—provided price can stabilize.
At this stage, price may still trade sideways and consolidate within this region to form a bottoming structure before any meaningful move higher. For traders, this means confirmation is key. Watching for multiple intraday candle closes above the support zone, paired with an increase in bullish volume, would suggest that demand is building. Only then would the setup favor an entry targeting the local highs.
The upside technical target from this area remains at $123,000, representing the recent swing high and a clear resistance level. A reclaim and rotation to this level would validate the support zone and reintroduce the bullish bias in the short term. Until that occurs, however, price could continue to consolidate, especially if volume remains low or indecisive.
The overall structure still leans constructive, as long as $112,500 holds. A breakdown below this level would weaken the short-term setup and potentially open the door to deeper downside probing. But for now, the region remains a high-probability bounce zone on lower timeframes.
What to Expect in the Coming Price Action
Bitcoin is testing critical intraday support at $112,500. If this level holds with volume confirmation and intraday structure aligns, a rotation toward $123,000 is likely. However, price may continue consolidating at this level before a clear direction forms.
Bitcoin (BTC): Filled Bearish CME Gap | Still Bullish Bitcoin had a smaller correction, which filled the local CME gap; after that, we are seeing a good chance for upside movement to happen.
Now we are keeping the same bullish game plan as we had before, as we are still far from the sell zone and as long as we are above the sell we are l are looking for a re-tet of upper resistance zone and ATH area.
Swallow Academy

Bitcoin (BTC): Buyers Are Accumulating | Going For Breakout Bitcoin looks good; after some struggle, the price is now pressuring the local resistance area. What we are looking for here is the breakout from the $116K zone, which then would open for us an opportunity to long the coin until the ATH zone of $123K.
Swallow Academy

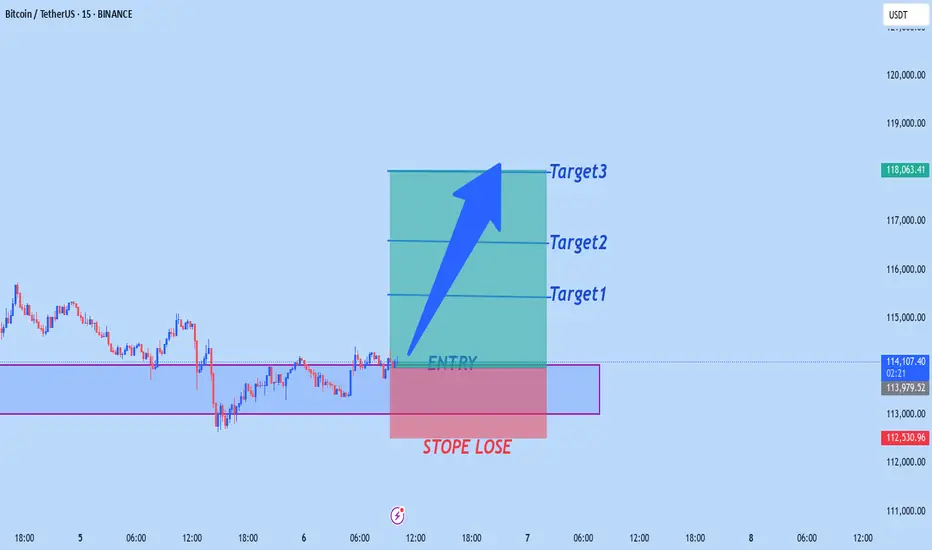
BTCUSD CAN FLY HIGHbtcusd buy from 114,000
target1 115,500
target2 116,500
target3 118,000
Stope lose 112,500
TRADE AT YOUR OWN RISK