$BTC Important levels to watch1- Important levels to watch for TOP are:
128,000
139,000
161,000
173,000
2- The most important levels are 161K & 173K
3- But apart from these levels, be ready for any level to be the TOP.
(and again, Bull market is not over, watch my previous analysis BTC/XAG on the last post)
BTCUST trade ideas

$BTC Is Bullish: Bull Flag + Liquidity sweep + RSI DivI see higher targets for bitcoin. right now Bitcoin is forming a bullish flag, two times it has targeted short stops, and on the 4H timeframe we also have an RSI divergence.

BTCUSDT.PThe best area to buy MARKETSCOM:BITCOIN is $119,000 and wait for the pullback to be complete.
But for selling and shorting, be sure to wait for $115,000 to break down.
⚠️Please control risk managements.

Will BTC ever reach 130k?Yes in your dreams, I am joking, it can but not now, blue shows what fall can trigger when massive selloff happens, and here it looks the smaller momentum to happen soon!

BTC/USDT Buy Setup – VSA & Demand Zone Reaction✅ Entry: Current price action near 117,297
🎯 Target: 119,078 (+1.22%)
🛑 Stop Loss (SL): 116,944 (below demand zone)
📊 Technical Insight (Volume Spread Analysis):
Stopping Volume at Lows:
The recent down move halted with a wide spread down-bar on high volume, followed by an immediate rejection. This indicates potential professional buying absorbing supply.
No Supply Confirmation:
After the stopping volume, several narrow spread candles on low volume formed, suggesting weak selling pressure and a lack of commitment from bears.
Bullish Reaction:
Price rebounded from the demand zone with increasing volume on up-bars, showing early signs of demand dominance.
The current consolidation just above the support is typical of absorption before a markup phase.
Risk-Reward Structure:
The setup offers a favorable 2.2:1 R:R ratio, with the stop placed just below the zone to avoid false breakouts while allowing the trade room to breathe.
📌 Trade Plan:
Bias remains bullish as long as price holds above 116,944.
A breakout above the minor resistance (117,828) with volume expansion would confirm the next leg up toward the 119,078 target.
If volume fails to support the move, reassess before committing additional capital.

BTC Moon Phase, Dominance % and BBWP resolutionBTC, D. Moon Phase. I see bearish scenario for the next days, until 4-5th of August. After reviewing Moon Phase chart for last year+, I see same scenario is happening most of the times. During the First Quarter ( Aug. 1) of the phase, price is dropping and start to recover about 4-5 days prior Full Moon. This is exactly when energy of the Full Moon starting to amplify. Current BBWP is contracted for 8 days, making the next move very rapid, I would not set any long/short trades, untill the volume start to expand. Its the mid summer - always slow and August is the month it start to accelerate towards the Fall, with all financial/political tricks happening in September and later in Q4. We already had one bear trap fakeout, but price didnt anticipate to go higher and got rejected by falling wedge upper like ( or bull flag, in this case).I would expect that high volume green candle will be either fully recovered to $110-111K , or 75% recovery, where the CME gap is $113500 - 1-2% lower, making it $113,000. The cascade liquidation will happen very fast, I expect the whole move down and up will take around 24 hours, with the bottom time 5-15 minutes. Need to be ready, that all alts will crash as well, Im expecting BTC %dominance to bounce here , after 8.4% drop to weekly 50EMA. I would like to see BTC, D% at 70% by Christmas and new ATH, what ever it is 160K or 200K what ever it is, for bitcoin to make ATH, it must grab dominance.

BTCUSDT: Elliot Wave AnalysisAs you can see in the chart, the fourth wave has ended and there is a possibility of an increase in the next stage to the level between 128,000 and 131,000, followed by a correction for a larger fourth wave and finally the last leg of the increase to the fifth wave, which has the possibility of reaching 139,000 to 140,000.

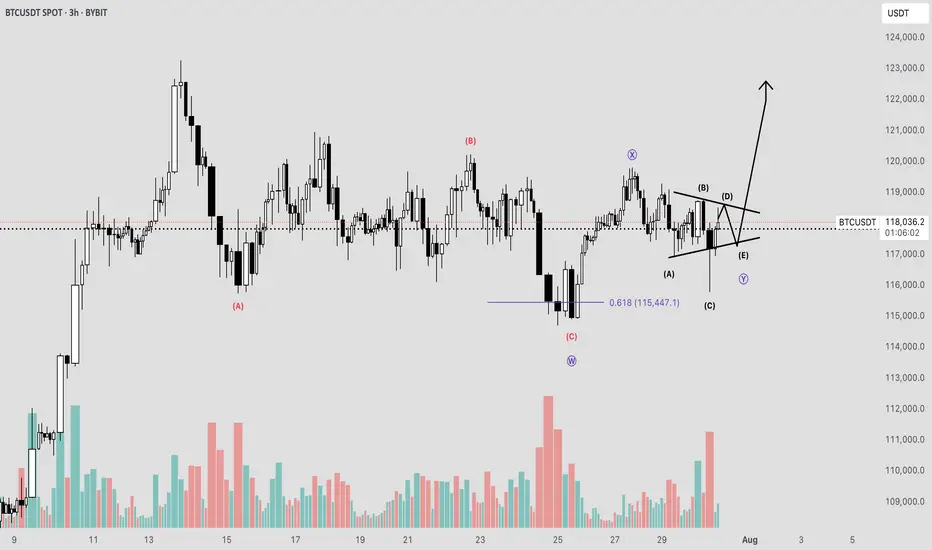
BTC Elliot Wave Double Combo CorrectionToday, I observed that Bitcoin may be unfolding within a complex double corrective wave structure—specifically a WXY pattern—potentially culminating in a contracting triangle.
Such corrective formations represent a temporal pullback, wherein the market undergoes a period of consolidation following an impulsive advance, also referred to as a pullback in time. This phase often serves as a mechanism for establishing structural support within a defined range prior to a continuation move.
A key point of uncertainty lies in whether the integrity of the triangle has been compromised by the recent, pronounced liquidity sweep. From the perspective of both the daily and 4-hour charts, this move resembles a classic deviation or "fake-out" rather than a legitimate breakout.
Nonetheless, the market may remain in a state of indecision for a few more sessions, characterized by erratic or range-bound price action, before committing to a more definitive trend.
A sustained break and successful retest above the 120K level would serve as a strong technical confirmation that Bitcoin intends to pursue higher valuations.
Multi-timeframe analysis, strong momentum, FOMC risk/reward plan__________________________________________________________________________________
Technical Overview – Summary Points
__________________________________________________________________________________
Strong momentum and bullish consensus confirmed across all timeframes.
Key support/resistance : 114k–116k (critical support), 123k (major pivot).
Healthy organic volume , no extreme peaks except isolated moments (30min/15min).
Risk On / Risk Off Indicator : Dominant bullish signal, neutral only on 15min.
Multi-timeframe structure : Perfect alignment daily/4H/2H/1H, caution on 15/30min (slight inflection but no abnormal divergence).
__________________________________________________________________________________
Strategic Summary
__________________________________________________________________________________
Global bias : Structural bull market, intact dynamic.
Opportunities : Tactical buys on pullbacks (114–116k), swing on breakout 123k.
Risk areas : Below 114k = risk of invalidation, targets 111k–105k.
Macro catalysts : FOMC imminent (high volatility expected), watch geopolitical tensions.
Action plan : Favor swing/cautious trading ahead of FOMC, dynamic stops, act on first post-Powell trigger.
__________________________________________________________________________________
Multi-Timeframe Analysis
__________________________________________________________________________________
1D : Active range 114k–123k; strong supports, momentum maintained; Risk On / Risk Off Indicator strongly bullish.
12H/6H/4H : Clean bullish structure, no excesses or divergence; price sits within major horizontal clusters.
2H/1H : Healthy impulse/correction phases; key intermediate supports 114.6k, 117.5k to watch.
30min/15min : Slightly weaker momentum but constructive microstructure, no immediate sell threat; localized volume spikes on support reactions.
ISPD DIV : No behavioral stress observed throughout.
Cross-timeframe summary : Bullish confluence dominant; caution on short-term reversals tied to FOMC and on-chain volatility spikes.
__________________________________________________________________________________
Multi-timeframe Cross Analysis & Decisional Rationale
__________________________________________________________________________________
As long as BTC > 114k = bullish bias, buying pullbacks, swing target 123k.
Active management post-FOMC strongly advised (enter/reduce after first H4 close).
Increased volatility risk in case of Fed/geopolitical shock; mandatory stops.
Sector momentum (Risk On / Risk Off Indicator) and volume underpin the bullish case unless exogenous alert.
Invalidation below 114k = prudent, neutral, or tactical shorts towards 111k–105k.
__________________________________________________________________________________
Macro, On-chain & Economic Calendar
__________________________________________________________________________________
FOMC July 29th : pivotal event, any surprise = strong intraday move (BTC sensitive to Powell speech).
US Macro: strong fundamentals but caution on trade war, inflation "contained."
On-chain : realized cap BTC >$1T, high open interest in derivatives = leveraged risk, beware speculative altcoin excess.
Global risk : market remains buyer until bearish Fed/geopolitical shock; swing trading favored, tight stops recommended.
__________________________________________________________________________________
Action plan
__________________________________________________________________________________
Favor buying/reloading on pullbacks to 114.6k–116k (stop <114k).
Break above 123k = bull confirmation, further extension likely to 126–128k depending on FOMC outcome.
Prioritize strict risk management; monitor liquidity/supports on macro/on-chain volatility peaks.
__________________________________________________________________________________
BTC | Long | Target: + 121500This technical analysis is for informational and educational purposes only. It does not constitute financial advice. Remember to always research and consult with a professional before making investment decisions. Good luck! 📈💼🚀


[SeoVereign] BITCOIN BULLISH Outlook – August 1, 2025We are the SeoVereign Trading Team.
With sharp insight and precise analysis, we regularly share trading ideas on Bitcoin and other major assets—always guided by structure, sentiment, and momentum.
🔔 Follow us to never miss a market update.
🚀 Boosts provide strong motivation and drive to the SeoVereign team.
--------------------------------------------------------------------------------------------------------
Hello.
This is SeoVereign.
My fundamental view on Bitcoin, as mentioned in the previous idea, is that I am anticipating an overall downward trend. In the mid- to long-term, I believe the downward pressure will gradually increase, and this is partially confirmed by various indicators and the overall market sentiment.
However, before we fully enter this downward phase, I have been judging that one more upward wave is likely to remain. I have focused my strategy on capturing this upward segment, and I have recently reached a point where I can specifically predict the development of that particular wave.
If this upward move unfolds successfully, I plan to set my take-profit range conservatively. The reason is simple: I still believe there is a high possibility that the market will shift back into a downtrend afterward. The core of this strategy is to minimize risk while realizing profits as efficiently as possible toward the tail end of the wave.
The relevant pattern and structure have been marked in detail on the chart, so please refer to it for a clearer understanding.
In summary, I view this rise as a limited rebound that could represent the last opportunity before a downturn, and I believe this idea marks the beginning of that move.
I will continue to monitor the movement and update this idea with additional evidence. Thank you.

Bitcoin ATHBINANCE:BTCUSDT This is amazing for crypto community because this level-up all of lover crypto currencies.
Next target: 120.000K
Best for pollback levels: 111.000K & 105.500K
👓We are this time keep calms emotional in buy or sell.

Bitcoin long from 114kWaiting for that npoc level to hit.
After that there is a 4h low , manipulate it , and we will try to catch a reversal.

BTC: Calm before the storm on market, or where we go?Sometimes the market is straightforward: there’s momentum, a trend, a clear direction. But other times—like now—there’s complete uncertainty. Over the past few days, Bitcoin has been trading in a tight range, lacking any pronounced momentum. The price moves back and forth, bouncing off local levels but not breaking out in any meaningful way.
📉 This is especially clear on the 4-hour chart: neither bulls nor bears can take control. Every move upward is quickly met with selling pressure, and attempts to drop are countered by buying. It’s like a “ping-pong” match in a sideways market.
📊 Indicators show low volatility and declining volumes, confirming that market participants are simply waiting. Likely, they’re anticipating an external trigger: news, macroeconomic events, interest rate decisions, ETF developments, or something else.
What could this mean?
Such conditions often precede a strong move. The question is—where to? Honestly, there’s no clear signal yet. Personally, I try not to rush in moments like these: if the market isn’t giving a clear direction, it’s better to take a pause.
That’s the essence of a professional approach: don’t trade just for the sake of trading, but wait until the market speaks more confidently.
What can you do now?
– Watch the range boundaries and wait for a breakout or trade bounces.
– Avoid entering positions based on emotions—pullbacks can be sharp and unexpected.
– Reduce trade sizes if you do enter, and set tight stops.
– Keep an eye on the news—sometimes even neutral news can spark a move.
Sometimes the best decision is to do nothing. This might be one of those times. In a sideways market, you’re more likely to lose than gain. But clarity almost always follows a consolidation.

BTCUSD NEW OUTLOOKBtcusd buy from 117,500
Target1 118,500
Target2 119,500
Target3 120,500
Stope Lose 116,500
TRADE AT YOUR OWN RISK

BTC/USD.tBtc is in a tight range at the moment. We are good as long as we don't close a daily below $116k. We will have a longer consolidation if we do close below. Lets see...

BTC - When 130k?This is BTC, As mentioned, has hit 119,540 and above, will make moves like this till 120,376 to max 120,578 and there if it breaks 120,578 in 1H and close above, then we see good move or we see a fountain which I call as waterfall.
"Bitcoin’s Big Heist – Are You In or Out?"🚨 BTC/USDT HEIST MISSION – SWIPE THE BULL RUN BEFORE THE BEARS WAKE UP 💰💣
🌟Hi! Hola! Ola! Bonjour! Hallo! Marhaba!🌟
Money Makers & Robbers, assemble! 🤑💰✈️💸
Here’s your decoded BTC/USDT “Bitcoin vs Tether” Crypto Market Heist Plan, fully loaded with Thief Trading Style 🔥 TA + FA combo. We’re prepping for a bullish breakout loot – eyes on the vault, ignore the noise.
🎯 PLAN OF ATTACK:
🎯 ENTRY (BUY ZONE):
💥 “The vault’s open—time to sweep!”
DCA/Layer your buy limit orders near the 15–30 min swing lows/highs for sniper pullback entries.
Use multi-entry method to stack positions (layering / DCA) as per your ammo (capital 💵).
🛑 STOP LOSS:
Set SL at the nearest swing low wick (4H TF) — around 115000.00, adjust based on your risk/load.
SL = insurance. Not optional.
🏁 TARGET:
Lock sights on 125000.00
🎉 Or… vanish with profits before the bear cops arrive.
🔎 MARKET BACKDROP & ANALYSIS:
📈 BTC/USDT currently signals bullish vibes on the swing/day horizon — fueled by:
Macro Fuel & Fundamentals
Sentiment Radar
COT Reports
On-Chain Pulse
Intermarket Clues
🚀 Connect the dots. The smart money's already prepping a breakout move.
🧲 Scalpers Note:
Stick to the long side only. No shorting the beast — unless you’re made of diamonds.
Secure your bag with trailing SLs.
⚠️ NEWS TRIGGER ZONE – TRADE WITH TACT:
📢 Upcoming high-volatility news events can spike charts.
Avoid new entries during releases and guard open trades with trailing SLs.
Protect the loot. Always.
💖 SUPPORT THE HEIST GANG: BOOST IT!
Smash that ❤️ to boost our thief squad’s momentum!
Every click powers this underground mission – making money with style, one pip at a time. 🎯💣💵
🚀 See you in the next heist drop.
Until then – Stay stealthy. Stay profitable. Stay legendary. 🐱👤💸🏆

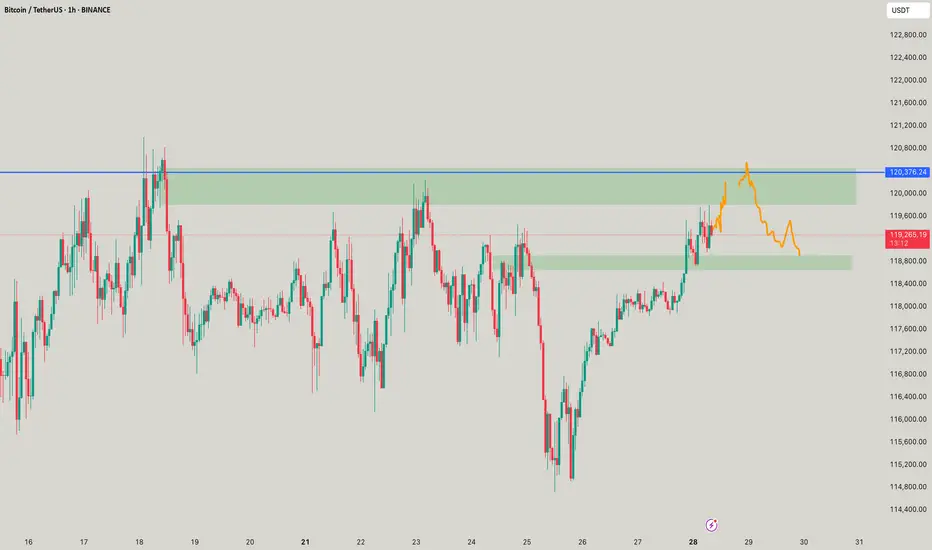
The move is up to the buyersHi traders and investors!
The price has already played out the upper boundary of the scenario, rising above 120,500. Then it also reached the lower boundary by dropping below 115,222.
Now we are at an interest moment: will the price continue to move upward or not?
This situation is clearly visible on the 8-hour timeframe.
On the 8H chart, we see a sideways range, similar to the 1D timeframe. The lower boundary is 115,736 and the upper boundary is 123,218. The active initiative is currently with the buyers, and their target is 120,998 и 123,218.
There is a notable bar attacking the lower boundary (115,736) with very high volume. The high of that bar is 118,451. We’re watching to see whether buyers absorb this bar — that will determine how the next move plays out.
There are three key levels where buyers may step in: 116,782, 116,128, and 115,736. If the price drops to any of these, we can look for a long setup.
Above, we also have three resistance levels from the sellers: 118,451, 119,676, and 120,247. We’ll be watching how sellers react if the price tests these zones.
This analysis is based on the Initiative Analysis concept (IA).
Wishing you profitable trades!

BTC Consolidates Below 119,300 Over the Weekend💎 BTC WEEKEND PLAN UPDATE (26/07)
NOTABLE BTC NEWS
The cryptocurrency market is attempting to stabilize after a wave of sell-offs during Friday’s Asian session, when Bitcoin (BTC) dropped to an intraday low of $114,723. A recovery trend is gradually strengthening, with BTC trading at $115,868 at the time of writing, indicating that buying interest at lower levels may increase in upcoming sessions.
TECHNICAL ANALYSIS PERSPECTIVE
Symmetrical Triangle Pattern
BTC is currently fluctuating within a symmetrical triangle pattern, with converging upper and lower trendlines. This pattern typically signals a strong consolidation phase before a decisive breakout.
Scenario unfolded as planned:
• The price failed to break the resistance zone around $120,000 (previously forecasted as a likely failed breakout zone).
• BTC then dropped sharply to the support zone around $115,000, touching the lower trendline and the potential breakout zone.
• At this level, the price rebounded as expected, indicating strong buying pressure at support.
MA lines supporting the trend:
• The price is currently moving around the 200-day MA (red line), showing that the dynamic support is working effectively.
• The 50-day MA (yellow line) is acting as short-term resistance. If broken, it could support the recovery momentum.
Two potential upcoming scenarios:
🔼 If BTC breaks above the $119,500 – $120,000 zone with strong volume, it may continue to test higher levels around $123,000 – $125,000.
🔽 Conversely, if it faces strong rejection around $119K and turns downward, BTC may retest the support zone at $114,000 – $115,000 once again.
Stay tuned to the channel for the latest and continuous updates on XAUUSD, CURRENCIES, and BTC.

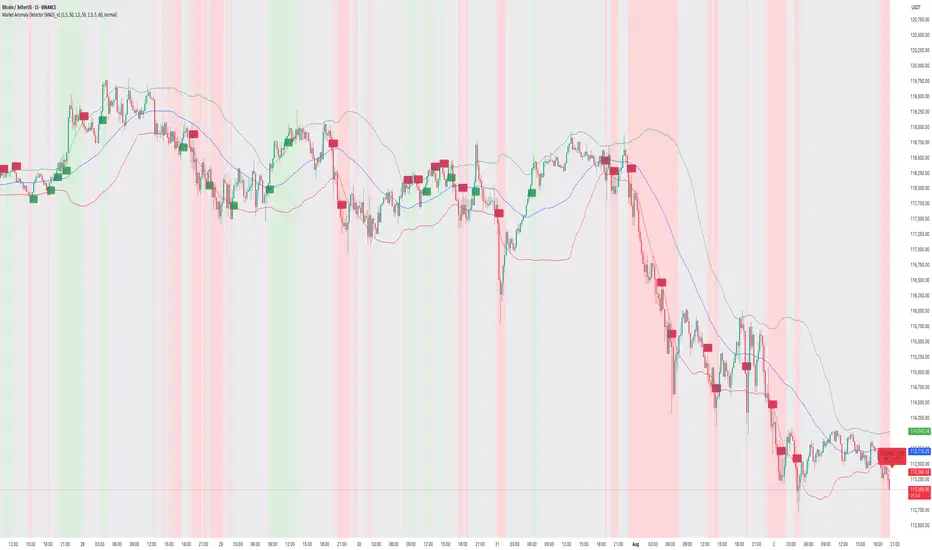
How to Capture Reversals/Breakouts with MAD IndicatorBTC/USDT 15M – Market Anomaly Detector (MAD) Captures Reversals & Breakouts
⸻
Description:
On this BTC/USDT 15-minute chart, the Market Anomaly Detector (MAD) is actively highlighting high-probability market turning points and anomaly zones.
Key Observations from the Chart:
1. Green & Red Zones = Expected Price Range
• Green Line (Upper Band): Expected top of the range.
• Red Line (Lower Band): Expected bottom of the range.
• Price usually travels green → red → green, forming a natural oscillation.
2. Buy/Sell Signals = Breakout + Reversal Detection
• Buy Signal: Triggered when price closes above the green line or recovers from below the red line.
• Sell Signal: Triggered when price closes below the red line or rejects from the green line.
• This reverse psychology logic helps catch false breakouts and stop-loss hunts.
3. Performance on This Chart:
• Signals aligned with key reversals during the sideways-to-downtrend transition.
• The strong downtrend in the second half of the chart shows multiple accurate sell signals, confirming trend continuation.
• Sideways movements had minimal false signals due to cooldown + volume filter.
4. Unique Advantage (USP):
• Statistical approach using Z-Score & Standard Deviation.
• Multi-filter confirmation with RSI, volume, and higher timeframe trend.
• Visually clear anomaly zones:
• Green background = Bullish anomaly
• Red background = Bearish anomaly
• Gray background = Neutral range
Takeaway:
MAD helps traders anticipate anomalies rather than react late, offering high-probability trade entries and reversals in trending and volatile conditions.
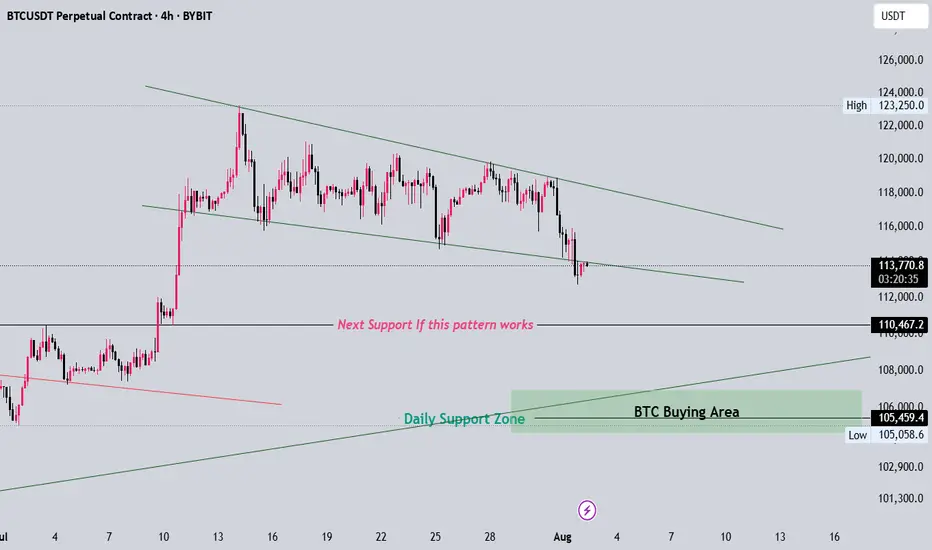
BTC Clear Idea if this pattern worksFor now please observe some time if btc breaks down to next target which is arround 110k then btc will definetly move towards 105k becuase that is its daily trendline support