BTC massive sell BTC massive sell is about to begin
Wait for confirmation
Buyers are active in the supply zone
Watch out for potential turning points
To the down or upside.
Proper risk management is advised
Happy trading.
BTCUST trade ideas

BTC buying power is gradually increasing💎 Update Plan BTC at the beginning of the week (June 30)
Notable news about BTC:
Anthony Pompliano has merged Procap BTC with Columbus Circle Capital I, established Procap Financial - a Bitcoin warehouse company up to $ 1 billion. The company will deploy lending activities, derivatives ... in order to create a collection line from BTC, according to the similar model
Bitcoin price is stable at about $ 107.4K on June 27, before the expiry date of options worth up to US $ 40 billion, capable of causing strong fluctuations. At the same time, on June 29, BTC exceeded $ 108k, up ~ 0.68% compared to the previous day
In the past 7 days, BTC maintained around $ 104–107K despite tensions in the Middle East and the US economic data is not heterogeneous. Reduce slightly but receive support from organized cash flow and global trade progress.
Technical analysis angle
Overview of trends - many signs of increasing
Looking at the candle is signaling "Strong Buy" on many time frames, especially healthy momentum, the ability to breakout $ 116k if surpassed the $ 110k resistance
ETF liquidity and organizational capital flows are supporting the trend of increasing, strengthening the possibility of breakthrough.
Moving Averages:
Frame 1H: 64% Bullish signal (MA20 reversed), but there is a neutral signal from short -term ghosts
Daily/Weekly: Golden Cross (Golden Cross) between 50‑ and 200‑ MA, is a long -term trend increase signal
Oscillators:
RSI frame Daily ~ 55, showing neutral momentum, not too much purchased but there is a rise. Double Rounded Top model on the chart Daily, the current trend is neutral - Bearish if the breakdown supports Neckline ~ $ 106k; In contrast, strong recovery above $ 114k will invalid this model
Long -term / Swing Trade: Keep the position if the price is maintained> $ 106k, use $ 103–104K as a spare hole stop.
Short -term / Scalp Trade: can be in order when the test price is $ 106k–107k, small latches around $ 110k.
==> Comments for trend reference. Wishing investors successfully trading

BTC LETS RETRY AGAINBINANCE:BTCUSDT.P Is gathering Bullish momentum again to try going war against that resistance. On this short video, i explained the reason why im looking to buy btc, Both entry and exist are on the video. Good luck to us all.

BTC up following H1 trend linePlan BTC today: 07 July 2025
Related Information:!!!
Bitcoin (BTC) trades slightly below $109,000 at the time of writing on Monday, following its highest weekly close on record. Institutional and corporate demand continues to serve as a key catalyst, with Metaplanet acquiring an additional 2,205 BTC on Monday, while US-listed spot Bitcoin Exchange Traded Funds (ETFs) saw over $769 million in net inflows last week.
As market participants assess the latest bullish indicators, focus now shifts to broader macroeconomic developments, including new trade-related headlines and reports suggesting that the administration of US President Donald Trump may extend the current tariff pause until August 1.
personal opinion:!!!
BTC moves sideways in the trend line, trend line support 108,300
Important price zone to consider :!!!
support zone : 108.300
Sustainable trading to beat the market

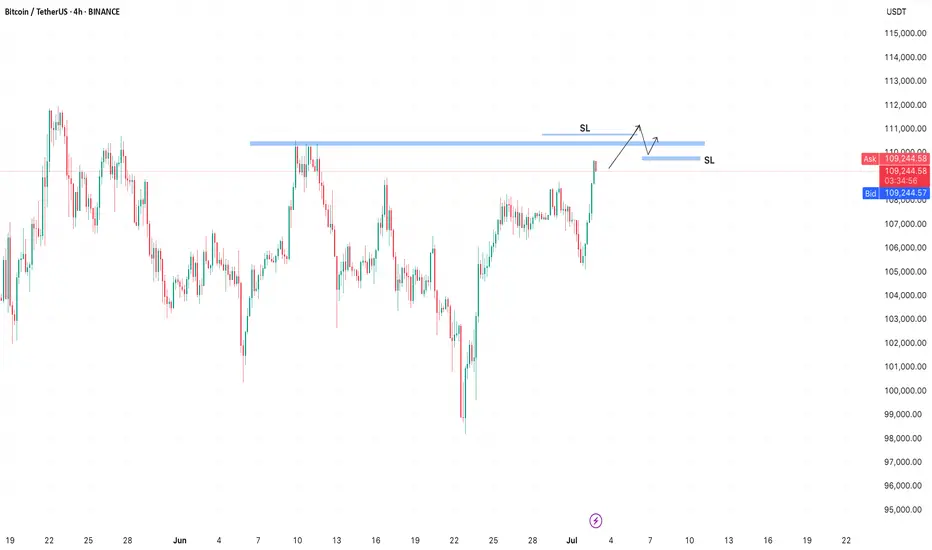
"BTC Pumps from $108,850 to $109,900 – What's Next?"Bitcoin has shown strong bullish momentum, rising from $108,850 to $109,900 in a short time. This move signals renewed buying interest in the market and suggests that Bitcoin may be preparing for a breakout above the $110,000 level.
Analysts believe this move is driven by whale accumulation, positive global sentiment around crypto regulations, and technical indicators pointing to a breakout. If BTC holds above $109,900, the next targets could be $110K and $112K.
Stay alert — the bulls might be back!

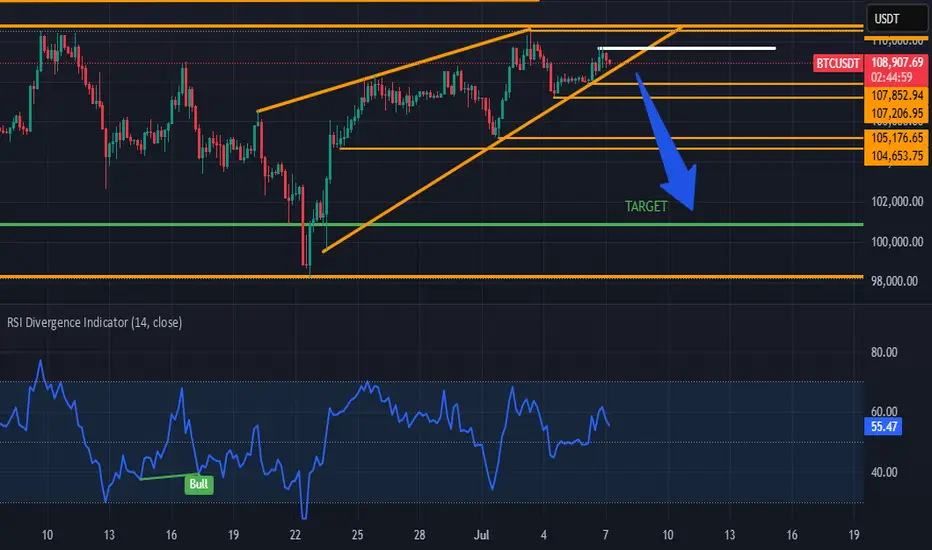
Bitcoin Technical Analysis – Key Supports in Focus🔥 Bitcoin Technical Analysis – Key Supports in Focus
Bitcoin (BTCUSDT) is currently going through a correction after its recent rally. All eyes are now on the $107,000 support level. If this zone holds, we might see a bullish bounce from here.
⚠️ However, if BTC loses this support, the next strong demand zone lies at $105,300 — a critical level to watch for any potential reversal.
📈 On the upside, if bulls take control and price rebounds, the first target would be $113,700, followed by $117,800 as the next major resistance.
🧠 Smart traders are watching these levels closely — don’t miss the next move.
🔔 Follow for more real-time insights, clean charts, and professional TA!
#BTC #Bitcoin #CryptoTrading #BTCUSDT #TechnicalAnalysis #TradingViewIdeas #SupportAndResistance

BTC price prediction As my personal analysis if BTC crossing 🚸 110655 without touching the previous high 111960 then BTC moving down 👇 directly or after sideways condition some days

CONSOLIDATIONfriends BTC will consolidate inside the channel for couple of days . if it break upside it will make all time high definitely. if it break downside there is chance of dump till 105k.

BTCUSDT - UniverseMetta - Signal#BTCUSDT - UniverseMetta - Signal
D1 - Formation of the 3rd wave + potential exit from the channel. Stop behind the minimum of the 2nd wave.
Entry: 107481.70
TP: 111110.12 - 115670.15 - 119641.79 - 126457.32
Stop: 104882.98

BTCUSDT analysis - 1H FVG and OB SetupsBitcoin has reacted cleanly to all marked zones so far.
Right now, we are waiting for price to reach the green circle area before making a decision. If we get confirmation on lower timeframes, we can look for a potential short setup on BTC.
Key zones are marked on the chart. Always wait for price to reach these levels and take your reactions on lower timeframes for precise entries.
Stay patient and let the chart come to you.
—
📊 ProfitaminFX | Gold, BTC & EUR/USD
📚 Daily setups & educational trades
📱 IG: @profitamin.fx

Bitcoin will no longer update ATH, and here's why⚡️ Hello, everyone! I decided to update my idea about Bitcoin. Let's see what awaits us!
Bitcoin rebounded strongly over the weekend and is now trying to consolidate at the $107,000 level. This is a key level, which is the MSB level for the entire current momentum since May, and as long as the price remains below it, it is a bearish movement.
Last week, we also closed the GAP to the $98,000 level from the previous movement, but on the way up, we formed a new one at $105,250 - 101,360. And as we know, 99% of GAPs close sooner or later.
📉 Bitcoin also continues to move in a descending flag, which, although it is a bullish pattern in an upward impulse and more often breaks through upwards, has not been working that way for a long time. Trading based on technical analysis is the basis of crypto and has become very widespread, which is actively used by many whales and counterplayers. As a result, many pattern signals have long lost their relevance and now often give false signals.
⚙️ Metrics and indicators:
Volume - divergence with price since the end of April. Throughout this upward momentum, purchase volumes continued to decline. This indicates a lack of liquidity and demand for Bitcoin at present.
Money Flow - also divergence with price. Also, since the end of April, positions have continued to close and liquidity has continued to decline. This indicates a lack of interest in the asset.
Liquidity Depth - we know that the price moves from liquidity to liquidity, which serves as its fuel. And now there is much more liquidity at the bottom than at the top.
Support/Resistance - Based on the volume of interest, it is clear that the $106,000 level is a major zone, and if it is lost, the nearest support level will only be at $103,004, but with significantly lower volumes.
📌 Conclusion:
Despite all the huge inflows into ETFs, there is now even less liquidity in Bitcoin than in November 2024, when Trump became president.
This suggests that everyone is actively closing their positions and there is no new money coming in. Search queries for the tags “crypto” and “bitcoin” are not even close to last year's levels, let alone 2021 levels. This means that there is no new retail interest in crypto right now.
I don't see any catalysts right now that could keep the price at this level. And ETFs are not an indicator at all; we've already seen how these “smart money” buyers bought at 110k on ATH and sold even more at 70k.
🔥 So, right now, I recommend sitting back and watching. Let the market sort itself out and indicate the direction of movement going forward.

BTCUSDT Trade SetupBTC Still in sideways no major move, wait for the entries. While on weekly tf still expecting a final shakeout, 95-93k then a final leg up towards to 120k. For now wait for the entries to be filled first then must use sl.

MONDAY - TRADE OF THE DAYFew nice plays over the weekend shame I am not active on weekends.
I will be posting a video later today so see you in class!

BTCUSDT Forming Bullish WaveBTCUSDT is currently setting up a promising bullish wave pattern, showing signs of steady upward momentum that could deliver a healthy 10% to 20% gain in the near term. After a period of consolidation and healthy correction, Bitcoin’s price is starting to push above key resistance levels, indicating strong buying interest and renewed confidence among long-term investors and institutional traders alike. This setup has caught the attention of market participants looking to capitalize on Bitcoin’s next potential leg up.
Recent on-chain data and technical indicators show a robust foundation for this bullish wave pattern, with increasing trading volume supporting the upward move. Bitcoin continues to hold above crucial support zones, which adds further confidence for buyers aiming to ride the trend towards its next major psychological levels. The overall sentiment remains positive as Bitcoin’s dominance in the crypto market signals strength, helping to drive capital inflow from altcoins back into the king of crypto.
As we know, Bitcoin’s market behavior often sets the tone for the entire crypto ecosystem, so this bullish scenario could spill over into other major altcoins as well. Traders and investors should keep an eye on key resistance zones, potential breakout levels, and any sudden surges in volume that confirm the wave pattern is playing out as expected. Patience and disciplined risk management will be essential to maximizing profits during this phase.
✅ Show your support by hitting the like button and
✅ Leaving a comment below! (What is You opinion about this Coin)
Your feedback and engagement keep me inspired to share more insightful market analysis with you!

BTCUSDT | 30-min & 4H Outlook🔍 Structure & Price Action
BTC is trading within a rising wedge (blue lines) nearing apex — typical bearish setup.
Price is repeatedly getting rejected near macro trendline (~108.8K–109K).
30-min shows clean breakdown from lower wedge support, retesting the zone now.
On 4H, BTC is still under key resistance zone between 109.6K–110.4K, previously rejected twice.
🔻 Bearish Signals
Multiple Sell signals on both timeframes.
Bearish divergence visible in RSI and MACD on 4H.
Volume spike on the breakdown → confirming sellers in control.
🔑 Key Levels
Support: 107.7K (current zone) → loss opens path to 106.6K, then 104.4K.
Resistance: 108.9K–109.4K = confluence of EMA cluster + macro TL + Fib zone.
📊 Indicators (4H)
RSI dropping from mid-zone (~48), no bullish momentum
DMI shows increasing ADX with -DI over +DI → trend strengthening bearish
TSI & Wave Trend both curling down
Stochastic in overbought, starting to reverse
🎯 Summary
Bias: Bearish below 108.6K
Invalidation: Bullish breakout above 109.6K + volume close
Setup: Watch for retest and rejection at ~108.4K–108.6K = clean short trigger
Next Targets: 107.2K → 106.6K → 104.5K

BTC Price Prediction Price breaks down from inside the channel and turns bullish from a point between 106500 (very high probability) and 102500 (low probability).
Volume Weighted Average Price
Classical Technical Analysis
Rising Wedge Formation
Elliot Wave - Correction Wave
Pitchfan
Harmonic - Potential Bullish Gartley
Smart Money Concept
ICT

BTC IS ABOUT THE RETEST THE 100.000 RANGE AGAIN BTC is about to break out of a bearish wedge and according to the Fibonacci extension it will test the $100,000 range again! I can also analyze a bearish divergence on 1 hour chart. Good luck folks... What are your ideas on that one?
BTC - Are you the one who is long?If yes! Book, Looks like a LIQ hump trap here! Wait for 105k smooth, or let it fall to retrace up to 109,860 to initiate!

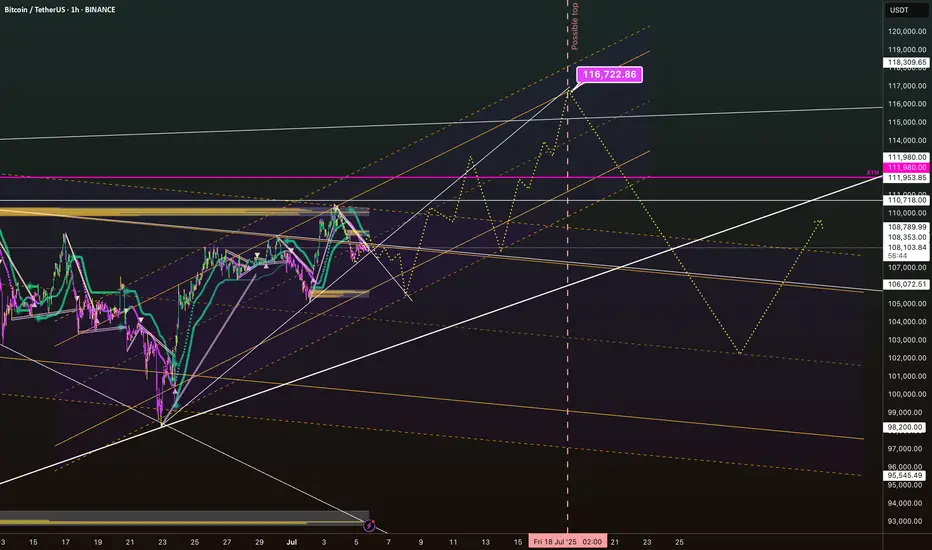
BTC/USDT July Outlook: Road to 116K or a Trap Below?The current structure shows Bitcoin consolidating after a strong bounce off the June lows. We’re now forming a potential bullish continuation pattern within a clear rising channel (dashed yellow lines), but the price is currently testing a mid-channel liquidity zone around $108,000–$110,000.
Key observations:
Local resistance zone: $111,980 (marked ATH) – a major liquidity magnet that could trigger a squeeze if broken. Support range: $106,000–$103,000 – strong confluence zone if price rejects current structure. Potential fakeout: Liquidity dip down to the $98,200–$95,500 zone is possible before a mid-July reversal (highlighted yellow path and vertical time marker on July 18).
Upside target: The upper channel boundary and projected fib confluence points to a bullish target of $116,722 by mid-to-late July.
Invalidations:
Sustained break below $95,000 could negate the bullish structure and push us into deeper correction territory.
Timing: The key date to watch is around July 18, where multiple structural lines and projection paths converge.
What’s your bias for July? Trap and rip… or stairway to 117K?
#Bitcoin #BTCUSDT #CryptoAnalysis #TradingView #LiquidityZones #BTCJulyOutlook
Final move by the bears? Bulls lining up for ATHHi traders and investors!
Buyers have reached the first target at 108,952.
On Binance spot, BTC missed the second target (110,530.17) by just 99 cents.
Is this a setup for a breakout and a run toward a new ATH?
So far, the price action looks like a level manipulation around 108,952: volume in all 3 bars interacting with this level is concentrated above it.
Just below lies a buyer zone (107,500 – 105,100).
I am watching for buyer reaction once the price reaches this area.
This analysis is based on the Initiative Analysis concept (IA).
Wishing you profitable trades!

Bitcoin Analysis: Risk under 108k, aiming 111k+ in continuation__________________________________________________________________________________
Technical Overview – Summary Points
__________________________________________________________________________________
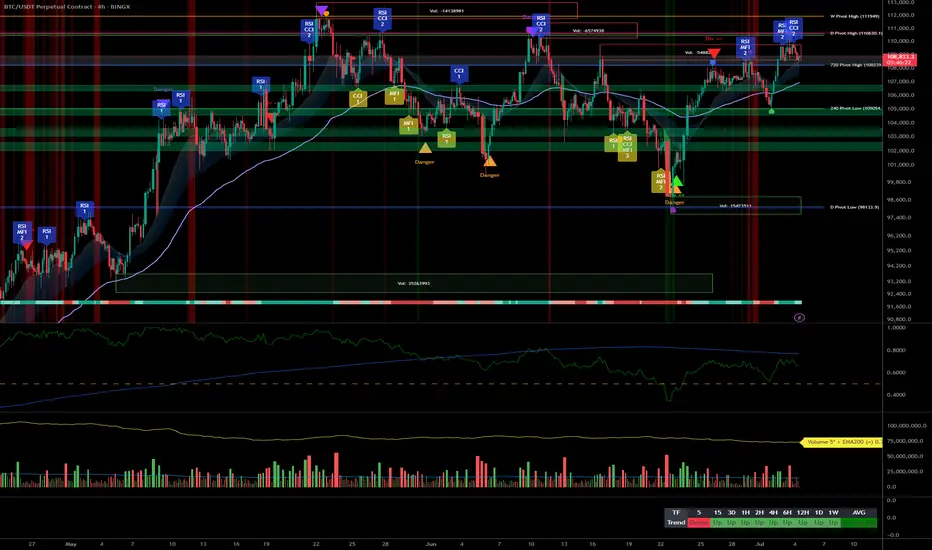
Momentum: Strong uptrend across all major timeframes (MTFTI “up”). Buyers remain in control; daily/4H/1H structure robust.
Key supports: 108,239.1 (720min Pivot, critical transversal support), 105,054.7 (240min Pivot), 99,581 (240min Pivot). Active defense seen on 108,239.1 at all timeframes.
Main resistances: 110,630.1 (1D), 110,483.1 (240min), 111,949 (W). The 110–111k area acts as the short-term ceiling.
Volume: Moderate activity, no spikes or climaxes, slight intensification noted on the 30min during key tests.
Risk On / Risk Off Indicator: “STRONG BUY” signal on all Tfs ≥30min, contributing to marked bullish momentum. Minor short-term divergence only on 15min.
Multi-TF behavior: ISPD DIV and Investor Satisfaction are neutral, no extreme behavioral stress; psychology is balanced, neither panic nor euphoria.
__________________________________________________________________________________
Strategic Summary
__________________________________________________________________________________
Overall bias: Bullish, synchronized multi-timeframes, dominant bullish liquidity.
Opportunities: Optimal long entries on validated pullback to 108,239.1, add on breakout of 110,630–111,949. Gradual partial take profit recommended in the 111k area.
Risk zones: Invalidation below 108,239.1 (confirmed H2 close), risk of further correction toward 105k then 99.5k; suggested swing stop under 108,000.
Macro catalysts: No major event, global markets stable. Geopolitical tensions monitored, low short-term impact.
Action plan: Prioritize “buy the dip” on pivots, active monitoring for any breakout/failure. Dynamic stop management, partial profit-taking on extension.
__________________________________________________________________________________
Multi-Timeframe Analysis
__________________________________________________________________________________
1D: Very strong daily structure, high momentum, intermediate supports near 98k/100.5k. Watch for major resistances at 108–111k.
12H/6H/4H: Ranging below 110–111k resistance, no fragility. Supports 108,239.1 and 105,054.7 holding, no selling pressure detected. Watch for breakout/impulse.
2H/1H: Buy zone if maintained >108,239.1, risk of sell-off below this pivot toward 105k. Price is ranging, momentum remains positive.
30min/15min: Consolidation on supports. 15min: temporary divergence on the Risk On / Risk Off Indicator but bullish structure intact unless a clean break below 108,239.1.
Risk On / Risk Off summaries: Dominant “strong buy” tone, synchronized momentum, only weak short-term divergence. No behavioral stress (ISPD DIV neutral everywhere).
__________________________________________________________________________________
Cross-analysis and recommendations
__________________________________________________________________________________
Momentum: Bullish environment sustained as long as >108,239.1. Continued upside bias if breakout above 110–111k is confirmed.
Risks: No major vulnerabilities detected. Very low probability of a local top, except in the case of exogenous macro shock.
Macro & On-chain: Stable newsflow, no distribution from HODLers or significant new inflows. Preferred strategy: swing trading in trend direction, tight stop under the main pivot.
__________________________________________________________________________________
Decision summary
__________________________________________________________________________________
Preferred scenario: Hold long >108,239.1, add on validated pullback, look for breakout with volume extension to 111k+.
Risk management: Stop under 108,000, partial profit-taking in the 110,630–111,949 area.
No immediate macro constraints: Use this calm window to ride the trend.
Monitoring: Resilience of the main support, any sudden geopolitical shocks.
BTC/USDT keeps a clear bullish bias, favoring swing or trend-following strategies as long as key pivots hold. Buy the dips remains optimal while technical structure holds; strict stop management is advised pending any “breakout fail”.

BTC is approaching a strong zone!BTC has a strong zone around 110,500 where a large number of orders are stacked.
In crypto, it’s common for stop losses to be taken on both sides.
After a breakout above the zone, short sellers get liquidated, while buyers enter the market — only to be stopped out by a false breakout when the price drops below the zone to trigger their stops.