BTC/USDT bullish with reverse head and shoulderBTC/USDT completed the reverse head and shoulder pattern.
It could be bullish by the pattern.
BTCUST trade ideas

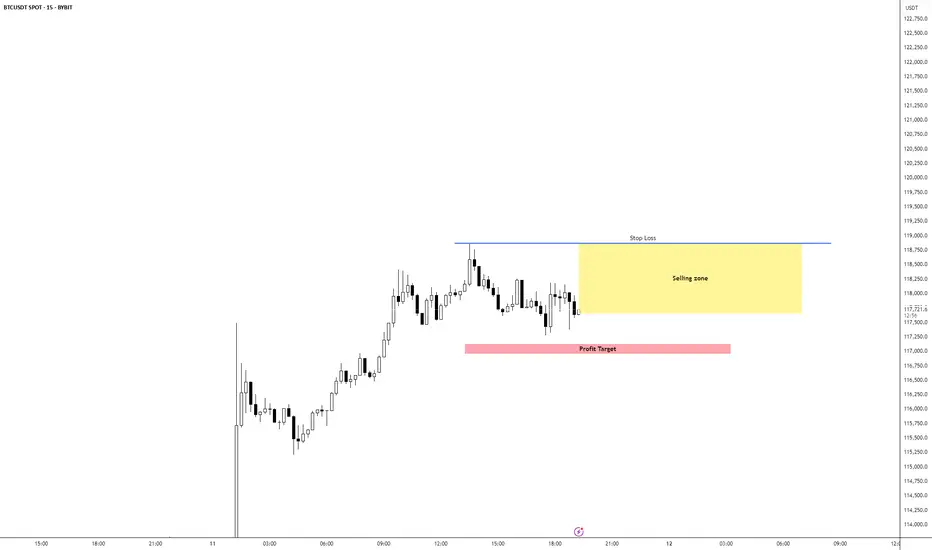
BTC/USD Short IdeaBTC/USD is currently bullish overall but seems overextended, Expecting a pullback to the 5m Equilibrium levels which would be our TP area. 1M has switched bearish adding confluence to our setup.
I would be layering short positions inside the yellow selling zone
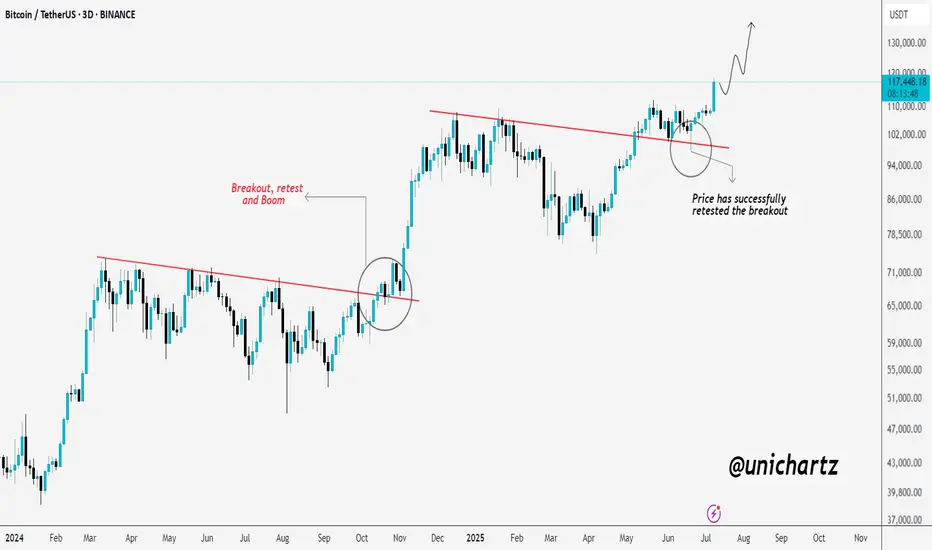
Bitcoin Looks Ready for LiftoffBitcoin is showing a textbook bullish continuation.
After breaking out of a long-term downtrend line, CRYPTOCAP:BTC came back for a clean retest — just like it did during the last breakout phase. That previous breakout led to a massive rally, and now we're seeing a very similar setup again.
The retest around $94K held perfectly, confirming strong demand and validating the breakout. Since then, price has pushed higher with momentum, now trading above $117K.
If this pattern continues to play out like before, Bitcoin could be eyeing $130K and beyond in the coming weeks.
The structure is strong, the trend is intact, and bulls are clearly in control.
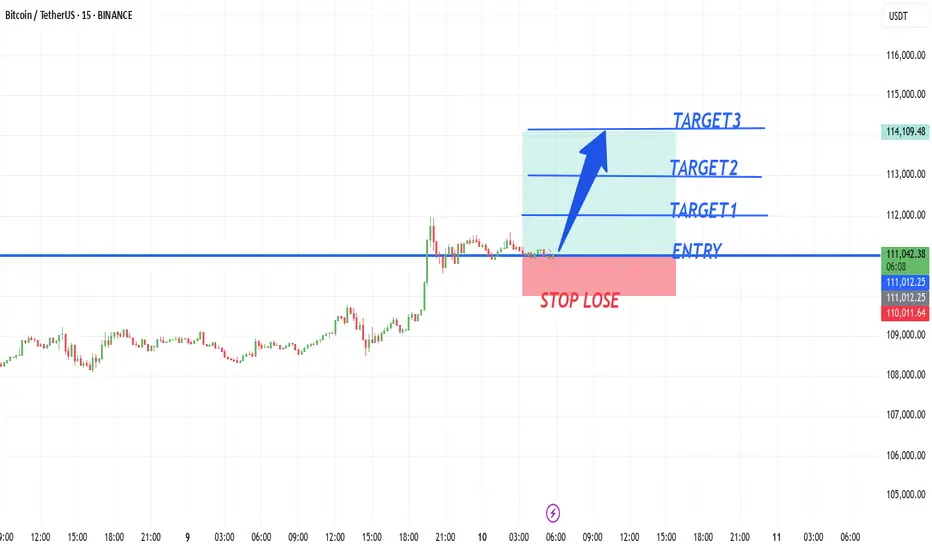
BTCUSD NEW LOOKBtcusd buy from 111,000,
target1 112,000
target2 113,000
target3 114,000
Stope lose 110,000
TRADE AT YOUR OWN RISK
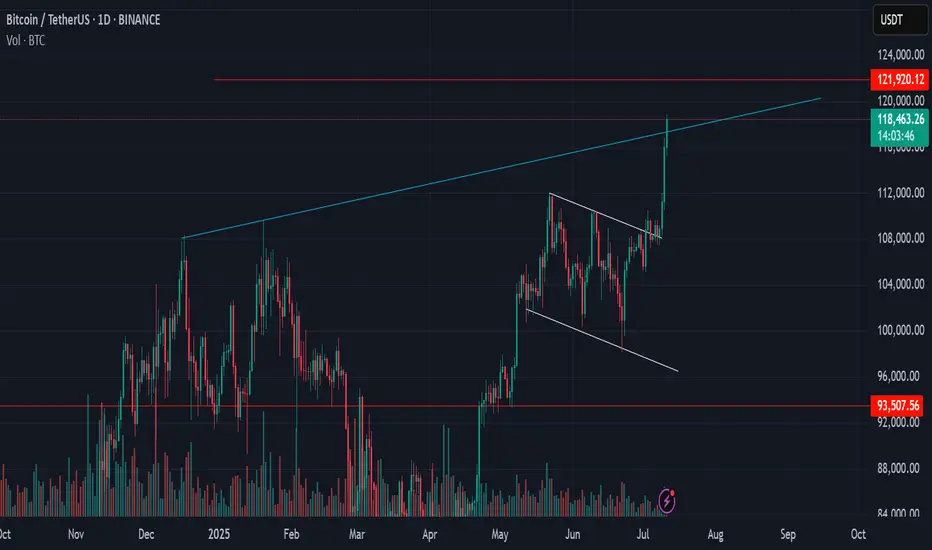
Bitcoin Critical AreaSo we see after flag breakout and auto pump to 118k, but we must pay attention in mega trendline from December 2024 and decision is in this week
if we close above 119k maybe we will see 121k
but maybe whale can doing wick fakeout (?)
Bitcoin Trading Update:From the current market position at 102,663.96, Bitcoin is poised within a key price range. As per your outlined strategy, you're targeting a potential 4.71% drop to the mitigation block at 97,911. This level serves as a critical zone for price action, which could offer an opportunity for a potential reversal or continuation.
Key Levels:
Dealing Range High: 117,900
Mitigation Block: 97,911
Current Price: 102,663.96
Potential Drop: 4.71% to the mitigation block
Price Target (TP):
From the mitigation block at 97,911, the target suggests a 20% potential gain as the price moves toward the upper boundary of the dealing range at 117,900.
Key Observations:
Risk/Reward Ratio: The setup shows a favorable Risk/Reward ratio of 4.75, which aligns with a solid risk management strategy, especially considering the potential for a 20% gain from the mitigation block to the dealing range high.
Stop Loss: The stop loss is set around 93,456.00 as per the chart, ensuring proper risk management in case the market moves against the expected setup.
Suggested Strategy:
Entry: Watch for price action near the mitigation block (97,911) for a potential entry.
Take Profit: Aim for the 117,900 level, targeting a 20% gain.
Stop Loss: Keep stop loss orders at 94,960 to protect against larger downside movement.
This setup offers an attractive risk/reward proposition, but always ensure you are actively managing the trade, especially if price approaches the mitigation block.

BTC/USDT Trade Setup – Lord MEDZStrategy: Goldbach Fair Value Gap + Smart Money Concepts (SMC)
Timeframe: 6H
Bias: Long
Trade Parameters
Entry: 102,577
Stop Loss: 99,527
Take Profit: 118,153
Risk to Reward: Approximately 5:1
Confluences and Justification
Price is expected to retrace into a clear Fair Value Gap (FVG) formed after displacement, aligning with the Goldbach model.
The structure confirms a completed reaccumulation phase, presenting a high-probability long setup.
This would complete the right shoulder of the classic inverse head and shoulders pattern, with the shoulder projected to dip into the POI. Head and shoulders patterns are often manifestations of Wyckoff accumulation or distribution phases, for those who may not be aware.
Liquidity left inside the gap provides inducement, increasing the likelihood of a sweep into the 102.5K zone.
The take-profit target at 118,153 aligns with the high of the Goldbach Fibonacci extension level.
Execution Plan
Wait for price to return to the FVG zone around 102,577. Look for confirmation such as a bullish displacement candle, a lower time frame BOS (break of structure), or mitigation of a lower time frame order block. Upon confirmation, execute long with a stop below 99,527. Take profit is set at 118,153.
Final Note from Lord MEDZ
"I await the return of price to imbalance. The reaccumulation is complete, and the alignment is clear. Entry shall be taken where inefficiency remains, and profit shall be claimed where liquidity awaits."

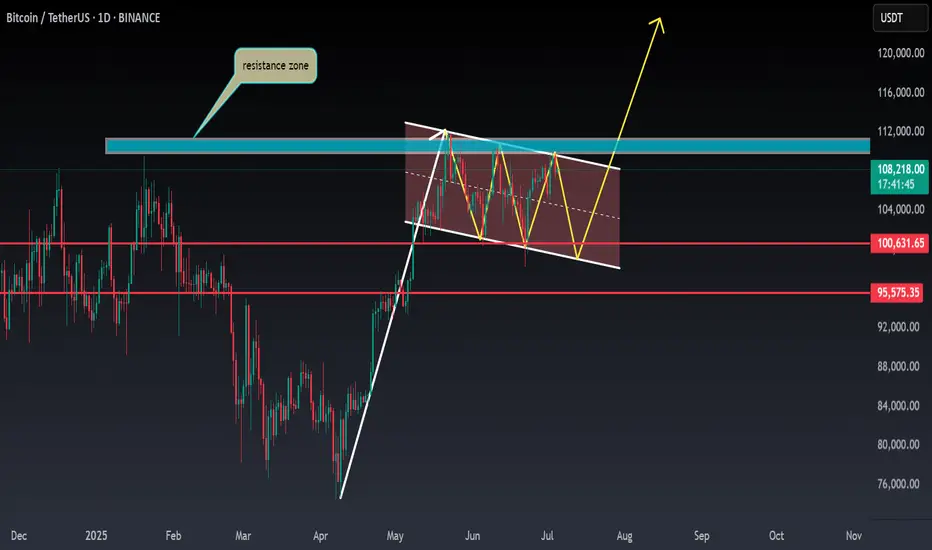
BTC ANALYSIS🌸#BTC Analysis : Bullish Trend 🚀🚀
🚀As we can see that there is a formation of Flag & Pole Pattern in #BTC in daily time frame. Right now we can see that #BTC again retest from the resistance zone and we can see a bounce back from its support zone 💪
🔖 Current Price: $1,08,050
⏳ Target Price: $1,20,000
⁉️ What to do?
- We can trade according to the #BTC chart and make some profits. Keep your eyes on chart price action, observe trading volume. Always observe market sentiments and update yourself everyday.🔰🔰
#BTC #Cryptocurrency #Breakout #TechnicalAnalysis #DYOR
BTCUSDTBitcoin came and made its move according to the FVG, which was in the $98,000 to $99,000 range, but considering the war that took place between Iran, the United States, and Israel and that affected the markets, I expected it to reach the $91,000 or even $85,000 area and then make a move, but considering the previous analysis and consolidation in the $109,000 area and the breakout of $110,000, it started its move and is expected to go up to $120,000 in the short term and up to $144,000 in the medium term.

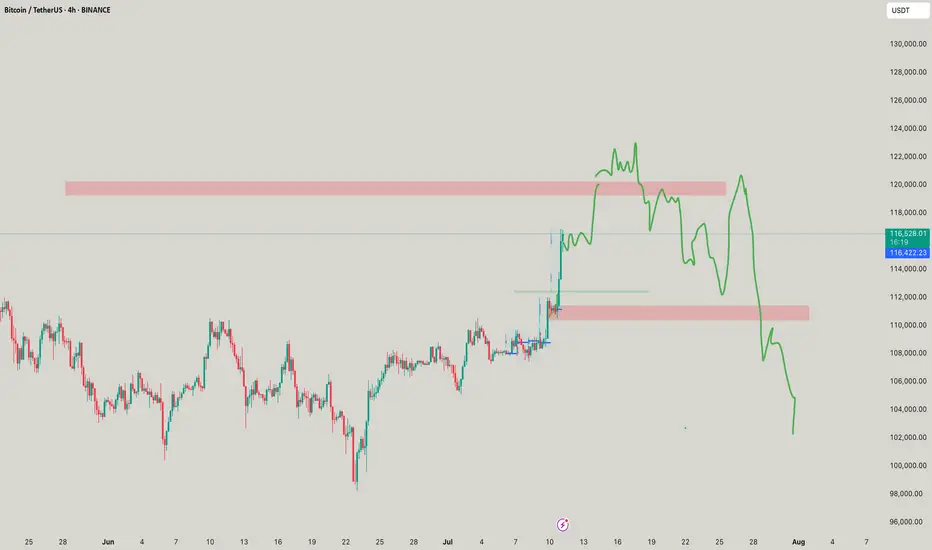
Bitcoin Breaks Out — Major Momentum ShiftBTC/USDT has officially broken out of the descending channel it was consolidating in for over a month. The breakout was strong, clearing the horizontal resistance at $111,862, flipping it into support.
Chart Structure:
Descending channel broken to the upside
Horizontal resistance is flipped to support
Volume confirmed breakout momentum
Key Levels:
Support: $111,862 → Newly flipped support
Resistance Zones Ahead:
$116,818
$122,342
Upside Targets:
Immediate: $116,818
Extended: $122,342
Caution: Avoid FOMO. Wait for a retest near $111,800–$112,200 to confirm breakout strength.
Bias: Bullish
Timeframe: 4H
Wait for confirmation before fresh entries.
DYOR | Not financial advice
#BTC #Bitcoin

BTC/USDT TrendHello friends, This chart is very important. Bitcoin will soon touch the long-term trend line, and it might even end the upcoming bullish trend that started around $15,000... The key point is that this end of the bullish trend could mark the beginning of an altcoin season, although an altcoin season may not necessarily occur. Anyway, if Bitcoin cannot break the trend line convincingly and pass through it, we will see its end. So, stay very alert.
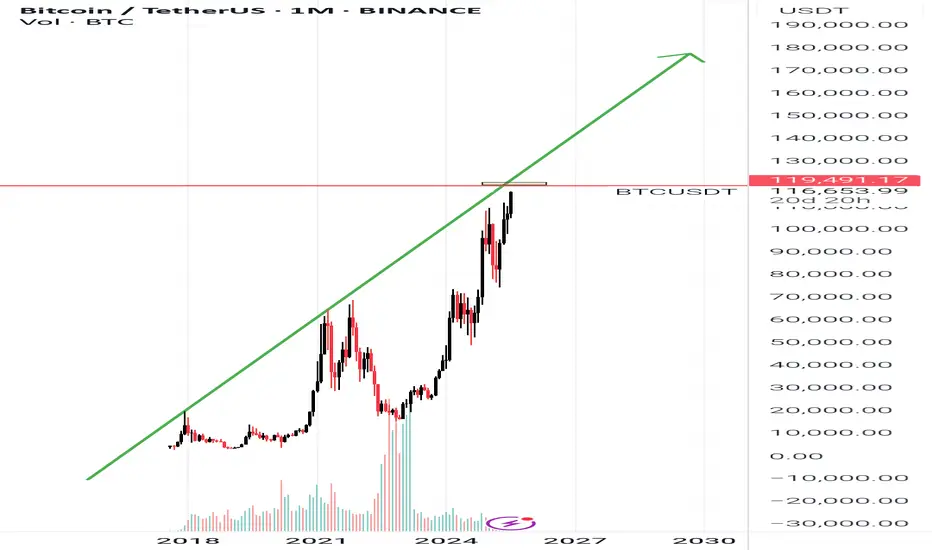
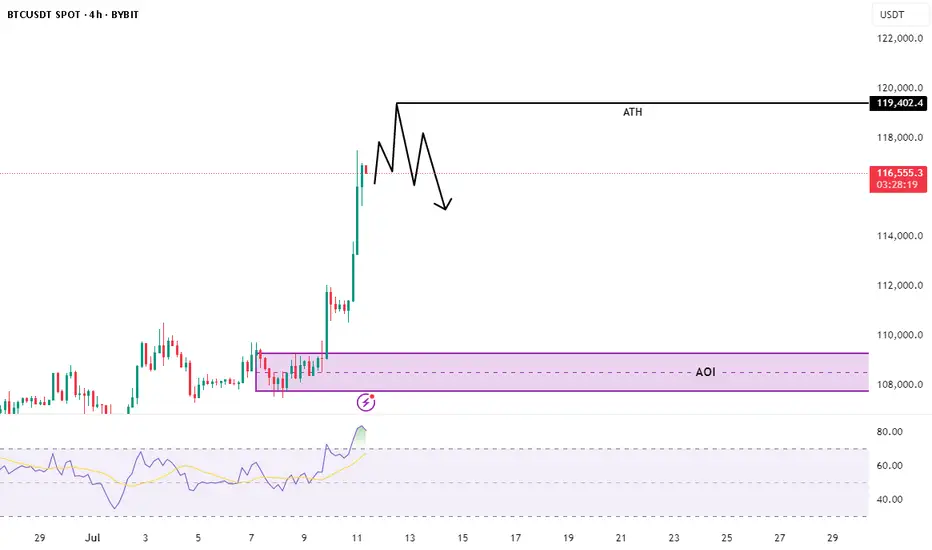
Chart Explanation: BTC/USDT (4H, Bybit)📊 Chart Explanation: BTC/USDT (4H, Bybit)
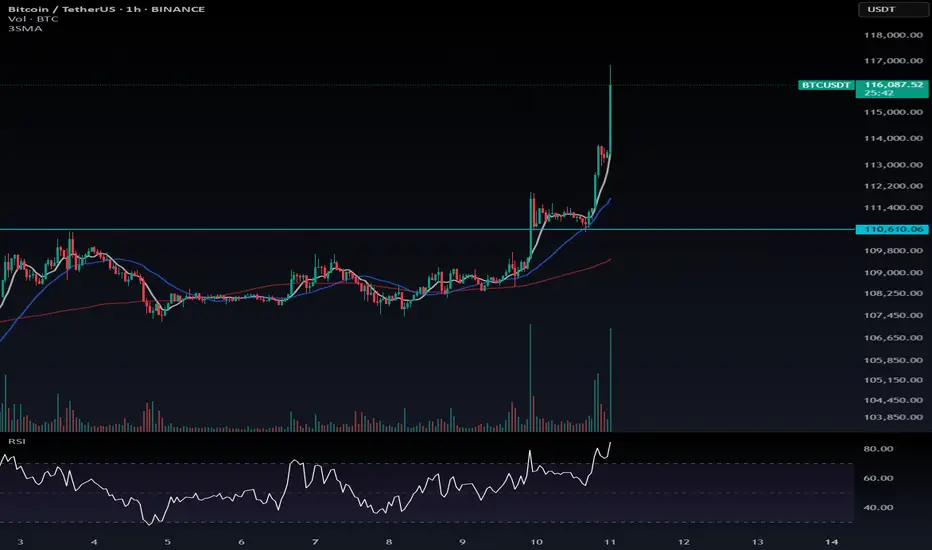
🟢 Current Situation:
BTC is pushing toward its All-Time High (ATH) level at $119,402.
We've seen a strong vertical rally with minimal pullbacks — classic "euphoria phase" behavior.
Price is currently around $116,500, getting close to major resistance.
⚠️ Key Observation – Bearish Divergence:
The Relative Strength Index (RSI) is showing bearish divergence:
Price is making higher highs
RSI is making lower highs
This signals momentum weakening, despite price moving up — a possible reversal warning.
🚫 Why No Trade (Yet):
You're not entering a position now because:
Price is near ATH — a major liquidity area where fakeouts are common
You expect a potential rejection or liquidity sweep near ATH
No confirmed reversal or entry trigger yet
🟣 What You're Watching:
The AOI (Area of Interest) marked around $108,000–$110,000
This is likely a previous consolidation or demand zone
If price retraces and gives a clean setup (e.g., bullish structure, volume, RSI reset), then you may consider a long entry
🔍 Summary:
You're being patient and strategic, observing potential weakness in momentum . now 119.4k will be next ATH. In my point of view .
No trade now — waiting for confirmation or a pullback into your AOI zone.
👉 Follow me on X for real-time market updates & trade ideas! 👇
#BTC #Bitcoin #Crypto #Trading #TA #RSI #Divergence
BTC - See you at 120k!As said to all 120k shall be your park stances! Lets see how it breaks the range of 120-125k huehuehue
Volatility period likely to continue until July 11th
Hello, traders.
Please "Follow" to get the latest information quickly.
Have a nice day today.
-------------------------------------
This volatility period is expected to last until July 11th.
The first volatility period, July 1-7, 3 days passed, and the second volatility period began on July 6.
It is important to explain it in words, but I think it would be better if you could intuitively understand the flow by looking at the chart.
For that reason, I divided the chart into a chart with a trend line drawn and a chart with indicators.
Since the trend line is used as a tool to calculate the volatility period, it is not necessary to show it after the volatility period is displayed.
What we need to look at is the support and resistance points drawn on the 1M, 1W, and 1D charts after the calculated volatility period, or the support in the indicator to find the trading point.
-
It seems that support is being checked around 108316.90, which is the HA-High indicator point of the 1D chart.
Therefore, we need to see if it can rise after receiving support near 108316.90 during this volatility period.
If not, it will eventually show a downward trend.
As a basic trading strategy, we use buying near the HA-Low indicator and selling near the HA-High indicator.
Therefore, considering the current price position, it can be said that it is a section where we should sell to make a profit.
However, since the HA-Low and HA-High indicators are intermediate values, if it falls from the HA-Low indicator, it is possible to show a stepwise downward trend, and if it rises from the HA-High indicator, it is possible to show a stepwise upward trend.
Therefore, we need to respond with a split transaction.
Conditions for continuing the uptrend include:
1. When OBV is above the High Line and shows an upward trend,
2. When PVT-MACD oscillator is above the High Line,
3. When StochRSI is above K > D, showing an upward trend,
If the above conditions are met, there is a high possibility that the uptrend will continue.
-
If it falls below the M-Signal indicator on the 1D chart, it is highly likely that it will select the trend again when it meets the M-Signal indicator on the 1W chart.
At this time, whether there is support near 99705.62 is important.
If it rises, you should check whether it is supported near 111696.21.
If it is not supported, it means that it has not broken through the high point section, so you should prepare for a decline.
The high point boundary section is the 108316.90-111696.21 section.
Therefore, if the price is maintained within this section, there is a possibility that it will continue to attempt to break through upward.
-
Thank you for reading to the end.
I hope you have a successful trade.
--------------------------------------------------
- Here is an explanation of the big picture.
(3-year bull market, 1-year bear market pattern)
I will explain more details when the bear market starts.
------------------------------------------------------

Hope you entered that long position!🚀 Hope you entered that long position!
I really tried to help you catch this move — and now it looks like Bitcoin has hit its first target.
If you want, you can take some profit here. But my suggestion? Hold that position with the mindset that some short-term profit might be missed, but the overall trend still looks strong.
📉 There’s a possibility of a minor pullback down to 110,610, even as a quick shadow — and then the upward move could continue.
📌 If you're holding altcoin positions, take profit on them. BTC dominance hasn’t dropped sharply yet, so alts are more likely to see pullbacks. Bitcoin still has more room to run in my view.
💬 Did you catch the trade?
🟢 In profit or waiting for higher targets?
Drop a comment 👇 Let's see how everyone's doing!
Bitcoin Breaks Out – Ultimate FOMO Unleashed Above $114,921🟢🚀 BREAKOUT POST
🚀🔥 Bitcoin Breaks Out – Ultimate FOMO Unleashed Above $114,921 🚀🔥
It’s happening. The breakout is real.
Bitcoin has just broken through the “HUGE-est Level EVER” — the infamous $114,921, marking the third macro test and final resistance in this structure.
This is not a small move. This is the unleashing of a new wave — the Ultimate FOMO zone is now LIVE.
📈 What Just Happened:
Third test confirmed ✅
Breakout through massive historical resistance
We are now in uncharted territory
🌪️ This Breakout Is Different:
Previous rejections (1 and 2) led to multi-week corrections
This time, price exploded through the level with force
Watch the parabola — we could be headed to the next ATH zone by end of 2025
🧠 Context:
The 2D divergences? Ignored. Structure wins.
This breakout invalidates the idea of sideways chop for now
It confirms strong bullish momentum across timeframes
⚠️ Caution Still Needed:
This move might trigger euphoric leverage — don’t be late, don’t chase blindly. Watch for a retest of the breakout zone for high-RR trades.
🧭 What To Watch Next:
Retest of 114.9K (support flip?)
New targets near 124K–128K
Long-term ATH projection still in play for late 2025
Full context in these breakdowns:
👉 Where Can Bitcoin Go? Part 8
👉 July 10th Market Outlook – Uncharted Waters
History is being written today.
One Love,
The FXPROFESSOR 💙
Disclosure: I am happy to be part of the Trade Nation's Influencer program and receive a monthly fee for using their TradingView charts in my analysis. Awesome broker, where the trader really comes first! 🌟🤝📈

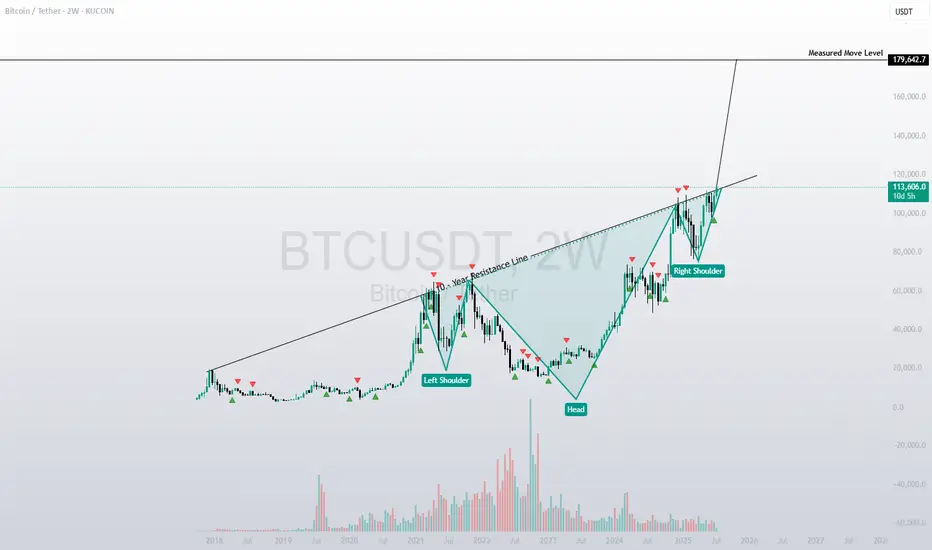
BTC Bull Run Idea - 10 Year Resistance Line BreakIf we break through that 10 Year Resistance Line - 180k is the measured move
BTC 1 hr technical analiysis Asset: BTCUSDT.P (Bitcoin Perpetual Futures)
Timeframe Provided: 1-Hour (1H)
BITGET:BTCUSDT.P
1. Higher Timeframe Bias (Assumed for 1H Context):
Based on the observed price action, specifically the strong impulsive bullish move around July 2nd-3rd, followed by a corrective pullback, it is reasonable to assume a bullish bias from the higher timeframes (Daily/4H). This assumption is crucial, as the 1H timeframe should ideally align with the dominant higher timeframe trend for high-probability setups. The strong push above previous resistance and the subsequent retracement suggest the potential for a continuation of an uptrend.
2. 1-Hour Structure Analysis:
Initial Structure: The price was generally ranging or in a slight downtrend until around July 2nd. We observe multiple internal bearish Break of Structures (1H BOS in red).
Change of Character (CHoCH): A significant bullish 1H CHoCH is observed around July 2nd, indicating a shift from a bearish to a bullish internal structure. This shift was followed by strong bullish momentum.
Break of Structure (BOS): After the CHoCH, the market showed clear bullish 1H BOS, confirming the new bullish impulse.
Current Structure: The market has recently pulled back significantly after the strong bullish impulse. This pullback has tested a key demand zone. We are looking for a continuation of the bullish trend from this pullback.
3. Liquidity and Inducement:
Sell-Side Liquidity (SSL): Prior to the bullish CHoCH, there were clear areas of sell-side liquidity that were swept, fueling the subsequent upward move.
Inducement: The current pullback, while corrective, may be acting as an inducement, drawing in early buyers or trapping sellers, before potentially continuing the upward movement. Price has swept some internal liquidity during this retracement.
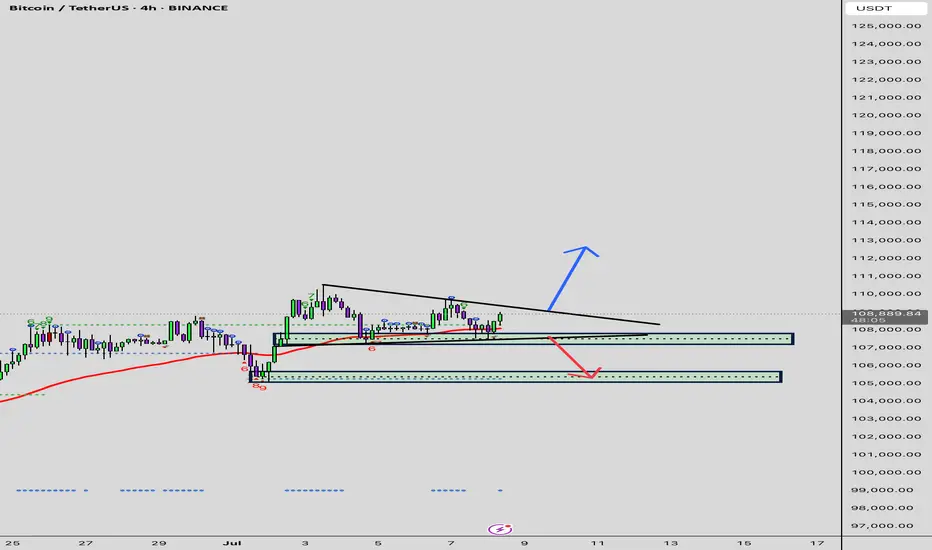
4. Valid Demand/Supply Zones (1H):
Primary Demand Zone: The most prominent demand zone of interest is located roughly between $107,000 and $107,300. This zone represents an unmitigated order block (or a clear area of strong institutional buying) that initiated the significant bullish impulse. It also aligns with previous resistance that was broken and is now potentially acting as support (a "flip zone"). This is our primary point of interest for a long entry.
Mitigation: Price has begun to tap into this demand zone, indicating a potential mitigation phase.
5. Trade Setup Proposal (High Probability Long Setup):
Considering the assumed higher timeframe bullish bias and the current 1H structure, a long setup from the identified demand zone presents a high-probability opportunity.
Bias: Bullish
Entry Strategy: We are looking for confirmation within the demand zone. Given the 1H chart, a refined entry could be sought on a lower timeframe (e.g., 15M or 5M) for further confirmation (e.g., an internal CHoCH, aggressive entry within the order block). However, based on the provided 1H chart:
Proposed Entry Price: Around $107,150 - $107,250. This is within the heart of the unmitigated demand zone. The visual suggests an entry around $107,200.
Stop Loss (SL): Slightly below the low of the demand zone/order block, and crucially, below any structural low that would invalidate the bullish short-term structure.
Proposed SL Price: Around $106,750 - $106,900. The visual places the SL at approximately $106,900. This allows for some wick hunting but protects capital if the demand fails.
Target (TP): We will target the high of the recent bullish impulse, and potentially higher if the higher timeframe bias confirms a sustained uptrend.
Proposed TP Price: Initial target at the recent high around $110,900 - $111,000. The visual suggests $110,950.
Rationale for TP: This target represents the next logical liquidity pool (buy-side liquidity) and a significant structural high that, if broken, would confirm further bullish continuation.
Risk to Reward Ratio (RRR):
Entry: ~$107,200
SL: ~$106,900 (Risk: $300)
TP: ~$110,950 (Reward: $3750)
Calculated RRR: Approximately 1:12.5. This is an exceptional RRR and highlights the potential of this setup.
6. Important Considerations & Trade Management:
Confirmation: While the 1H demand zone is strong, for institutional-level entries, further confirmation on lower timeframes (e.g., a CHoCH or clear bullish momentum shift on the 5M/15M chart once price enters the demand zone) would be ideal.
Market News/Events: Always be aware of upcoming high-impact economic news (e.g., CPI, FOMC minutes, NFP) that could induce high volatility and invalidate technical setups. For crypto, major exchange news, regulatory announcements, or large whale movements can also impact price. As of Saturday, July 5th, 2025, there are no immediate high-impact economic data releases on the calendar for this weekend, but traders should always check the economic calendar for the upcoming week.
Partial Take Profits: Consider taking partial profits at intermediate highs or psychological levels to secure gains and reduce risk.
Trailing Stop Loss: Once the trade moves significantly in profit, consider trailing your stop loss to break-even or beyond to protect capital.
This detailed analysis, even with the limitation of a single timeframe, provides a clear, high-probability long setup based on advanced SMC principles. Monitor price action closely at the entry point and manage risk diligently.
Disclaimer: This analysis is purely for educational and analytical purposes and does not constitute a buy or sell recommendation or financial advice. All trading decisions must be made based on individual analysis, proper risk management, and careful consideration of market conditions by the trader themselves. As an AI model, I bear no financial responsibility for the outcomes of your trades.

#BTC Rising Wedge📊#BTC Rising Wedge📉
🧠From a structural point of view, we are trading sideways above the support-resistance conversion zone, and the bullish force is gradually weakening. Only if we break through the blue turning point 109669, will new bullish expectations appear, otherwise we need to be alert to the correction at the daily level.
➡️From a graphical point of view, a rising wedge is formed here, and we usually fall according to this model. At present, it has fallen below the lower edge of the wedge and rebounded to the lower edge and was blocked. I expect a further decline.
Let's see👀
🤜If you like my analysis, please like💖 and share💬 BITGET:BTCUSDT.P

Bullish on BTC Here is a clean, professional analysis of your BTCUSDT 1D chart:
---
1️⃣ Chart Context
Pair: BTCUSDT.P (Perpetual Futures)
Timeframe: Daily
Current Price: ~111,350
Chart Type: Breakout and projection mapping
Key Levels Marked:
Resistance zone: 134,989 – 140,087
Support trendline (yellow): Ascending from March low
Local horizontal support (yellow): ~104,000 region
---
2️⃣ Structure Analysis
🔹 Trend
BTC is in a strong uptrend with higher highs and higher lows since March 2025.
A breakout from a flag/pennant pattern has recently occurred, signaling continuation.
🔹 Support & Resistance
Current resistance zone (~111,000–113,000): Price is testing this zone.
Major resistance zone (134,989 – 140,087): Strong supply zone for future targets.
Trendline support: Acts as dynamic support, currently near 100,000, rising weekly.
---
3️⃣ Price Action
A clean breakout candle is seen above the consolidation.
Retest of breakout zone possible (~108,000 – 110,000) before continuation.
A measured move aligns with a potential target to 135,000–140,000.
---
4️⃣ Projection Plan
Based on my white projection arrow: ✅ Base scenario: Price breaks above the local consolidation cleanly and heads toward 135,000–140,000. ✅ Retest of the breakout zone may occur to grab liquidity before the push. ✅ If price closes above 113,000 on a daily, momentum confirmation for the run is strong.
5️⃣ Trade Plan (Not Financial Advice)
Entry: On breakout confirmation above 113,000 or retest near 108,000–110,000 with bullish confirmation.
Target: 134,989 and partial close, then 140,087 final target.
Stop Loss: Below local support (yellow line) near 104,000 or trendline depending on risk appetite.
Risk Management: Size positions to risk max 1–2% per trade.
6️⃣ Potential Risks
⚠️ Global macroeconomic conditions or sudden BTC volatility. ⚠️ Fake breakout wicks trapping longs above 113,000. ⚠️ Daily close below 104,000 would invalidate bullish structure in the near term.
Summary
BTCUSDT is in a bullish continuation structure aiming for 135–140K.
Price is currently at a critical breakout level; a clear close above and retest would be optimal.
Manage risks with clear invalidation below 104,000

BTC/USD SCENARIO Bitcoin is trying to break out of the 110,000
If we break out we will see a new high
If we don’t break it we could see 105k possibly 100k
Bitcoin Bullish Flag Breakout Incoming?MARKETSCOM:BITCOIN is currently consolidating within a bullish flag pattern on the daily chart, following a strong impulse move from the $74,000 support zone marked in April. The price is hovering near a critical horizontal resistance zone ($ 108,000–$ 109,000), which has historically acted as a major barrier to further gains.
Technical Highlights:
Bullish Flag Pattern: Clear flag formation after a strong uptrend, suggesting continuation potential.
Strong Support Rebound: April's bounce from the ~$74K support zone marked a key higher low.
EMA: Price is currently trading above both the 50-day and 100-day EMAs — a bullish sign of momentum.
Breakout Potential: A confirmed breakout above the flag resistance (~$109K) could ignite a strong rally toward $130K+.
Breakout Move: If the flag pattern plays out, CRYPTOCAP:BTC could target the $125K–$135K zone in the coming weeks.
Buy Entry: Once the day candle closes above the flag resistance line

#BTCUSDTbearish side of the btc is slow, as the volume of sell is not that high...…any strategy doesn't fit the lower low, i am seeing btc to the 132k.
anyone overthere with a new different strategy regarding btc?
