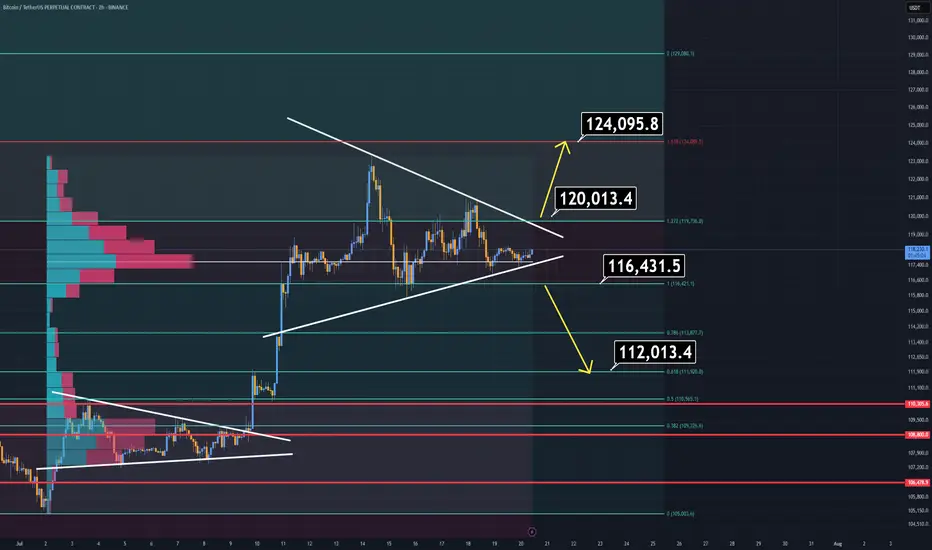
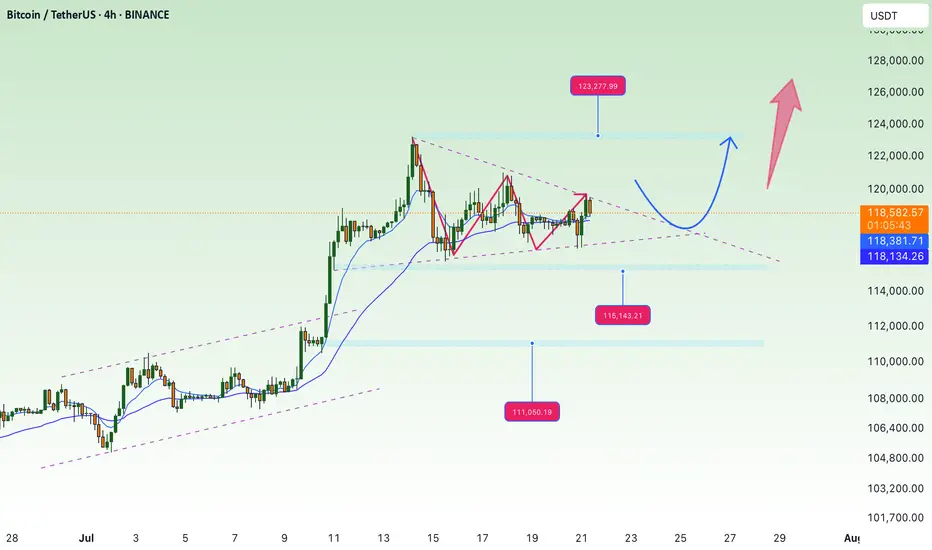
BTC Analysis (2H)Bitcoin is currently consolidating within a symmetrical triangle, suggesting indecision in the market. However, a breakout is imminent — and when it comes, it will likely be sharp.
🔹 Bullish Scenario:
A breakout above $120K would likely lead to a new All-Time High near $124K.
🔹 Bearish Scenario:
A breakdown below $116,400 opens the door for a quick drop toward the $112K–$110K zone, which should be considered a buy opportunity.
⚠️ Pro Tip:
There’s a volume imbalance just below the $116.4K level. If price breaks below it, the move down may be faster and more aggressive than expected — so plan accordingly.
Regardless of short-term volatility, the macro trend remains bullish, and Bitcoin will rise again.
Thanks for reading.
BTCUST trade ideas
Game Over. Bear market incomingYou can hate all you want. Historically I'm right. Bull run ends in July.
Save this and come back to it.

The 3-Step Rocket Booster Strategy Bitcoin Edition🚀 3 Key Features of Bitcoin
Decentralized Network – No central authority like a bank or government controls Bitcoin.
Limited Supply – Only 21 million bitcoins will ever exist, making it scarce and valuable.
Borderless Transactions – Send or receive money globally without needing permission or intermediaries.
✅ 3 Benefits of Using Bitcoin
Freedom from Inflation – Bitcoin resists inflation because of its fixed supply.
Fast & Low-Cost Transfers – Especially useful for international payments.
Financial Inclusion – You don’t need a bank to own or use Bitcoin—just a smartphone and internet.
⚠️ 3 Problems with Bitcoin
Price Volatility – The price can change rapidly in short timeframes.
Scams & Fraud – Many fake crypto projects use Bitcoin’s name to deceive people.
Technical Learning Curve – Beginners may find it hard to understand wallets, keys, and security.
🤔 3 Common Objections
“Bitcoin is too volatile—I might lose money!”
“It’s too complicated for me to use.”
“Governments will ban it eventually.”
💡 3 Ways to Overcome Objections
Use only what you can afford to lose. Start small and grow with knowledge and confidence.
Use beginner-friendly apps like Binance, Trust Wallet, or Paxful. These platforms make Bitcoin easier than ever.
Bitcoin is legal in most countries, and major companies are adopting it—its use is expanding, not shrinking.
🛒 Take Action Now!
Don’t wait for the price to explode again. Learn, test with small amounts, and start your Bitcoin journey today.
👉 Buy Bitcoin now and take control of your financial future!
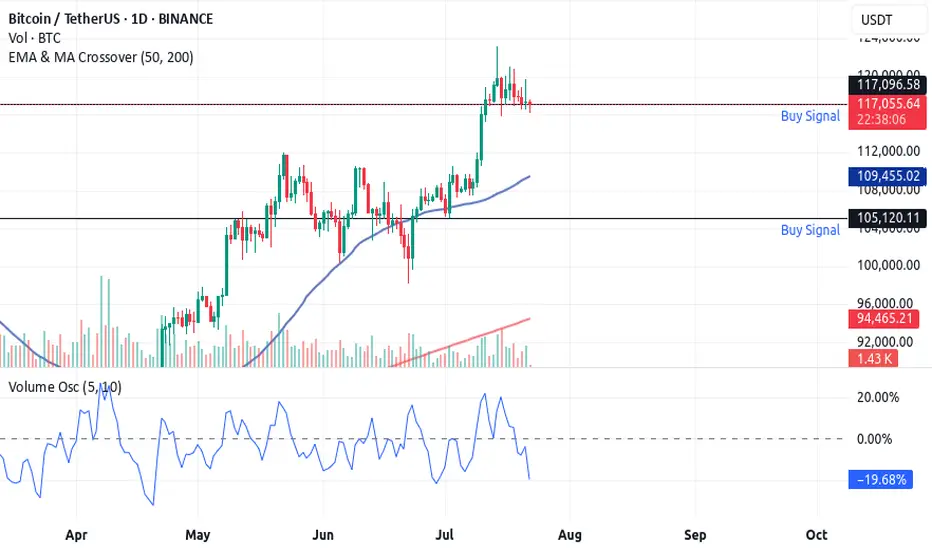
🚀 The 3-Step Rocket Booster Strategy
🔍 Step 1: Price Above the 50 EMA
What it means: The price is trending upward in the short-to-medium term.
Why it matters: This shows strength and upward momentum—price is above its recent average.
🔍 Step 2: Price Above the 200 EMA
What it means: The long-term trend is also bullish.
Why it matters: This confirms that the overall market direction is up, reducing the risk of fakeouts.
🔍 Step 3: Volume Oscillator Surge (Volume "Booster")
What it means: There is a spike in volume (measured using a volume oscillator).
Why it matters: Volume confirms that big players are involved. Price moves backed by high volume are more reliable and likely to continue.
✅ Optional Extra Filter: Check if the price has gapped up or if there's a bullish candlestick pattern (e.g. Marubozu, Engulfing, Morning Star) to increase confidence.
Rocket boost this content to learn more.
Disclaimer:Trading is risky please use a simulation trading account before you trade with real money.Also learn risk management and profit taking strategies.
BTC Weekly Recap & Outlook 20/07/2025📈 BTC Weekly Recap & Outlook
Market Context:
Price continued its bullish momentum, fueled by institutional demand and supportive U.S. policy outlook.
We captured solid profits by following the game plan I shared earlier (see linked chart below).
🔍 Technical Analysis
✅ BTC made a strong bullish move, breaking into new all-time highs.
📊 The daily RSI entered overbought territory, which signaled the potential for a short-term retracement or consolidation.
Currently, price is ranging, and RSI is cooling off. That tells me the market is likely building energy for the next leg up — but not before a significant liquidity run.
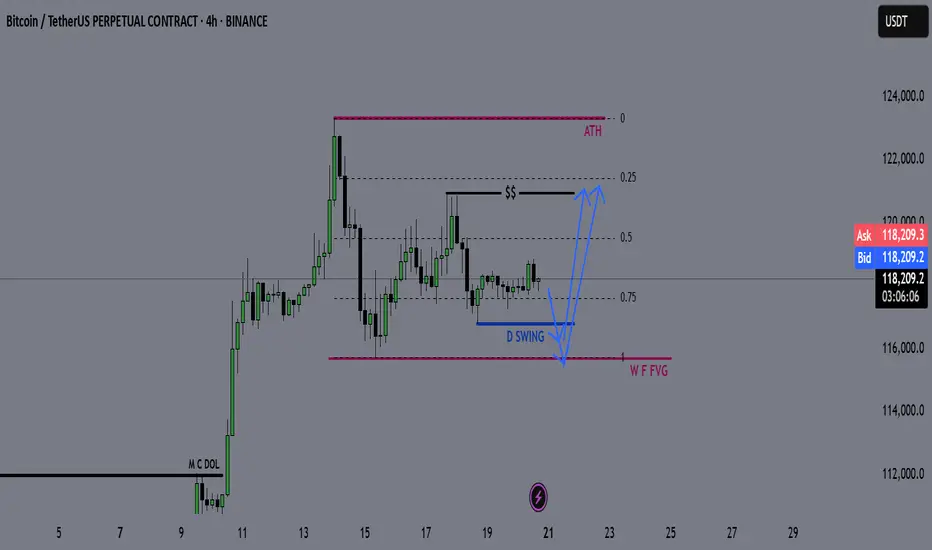
🎯 Game Plan
I'm watching for one of two potential setups:
1️⃣ Liquidity Sweep to the Downside
- A run of the daily swing low
- Into the most discounted range (0.75 Fib zone)
OR
2️⃣ Tap into the Weekly FVG Zone (marked with the purple line)
Either move would create the liquidity and energy needed to fuel a breakout above the equal highs (EQHs) marked by the black line.
🚀 Target
First Target: EQHs (Black Line)
Second Target: Price Discovery (new ATHs)
💬 Let me know your thoughts or drop your own chart ideas below!
📌 Follow for Weekly Recaps & Game Plans
If you found this useful, make sure to follow for weekly BTC updates, market outlooks, and detailed trade plans based on structure and liquidity.
Bitcoin longLong from 115k region.
Sweep 4h lows and then i think it will show some strength to the upside.
BITCOIN FINAL WARNING BEFORE HUGE MOVE!!! (urgent) Yello Paradisers! I am Sharing with you my idea about #Bitcoin of what's going on with Bitcoin right now: be very careful because the Fear and Greed Index, a special one, is at "Greed". We are seeing funding rates, the accumulated funding rates, as extremely positive. We are seeing bearish patterns forming.
In this video, I'm describing the confirmations we are waiting for that will confirm that Bitcoin is about to make a huge movement. Make sure that you are trading with professional trading strategies and that you are waiting for confirmations before any trade execution. Also, make sure that you have tight risk management because only the best, most professional traders will win long-term in this game.
Don't be a gambler. Don't try to get rich quick. Make sure that your trading is professionally based on proper strategies and trade tactics.

Bitcoin’s “four‑year” halving‑cycle rhythm by overlaying three c🔍 Key Highlights from the Chart
🟢 Bull Market Peaks
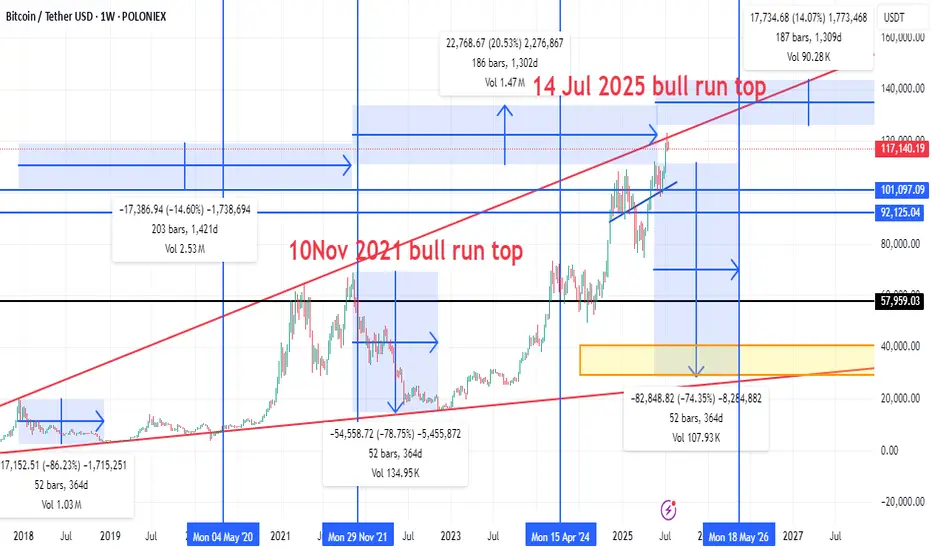
10 Nov 2021: Previous cycle top around ~$69,000.
14 Jul 2025 (Projected): Potential new bull market top (approx. $120K–$125K zone based on red trend line projection).
🔴 Bear Market Drops
2021–2022 Crash:
Drop of -78.75% from the 2021 top.
Lasted 52 bars (364 days).
Next Projected Bear Market:
Projected from July 2025 to May 2026.
Expected drawdown: -74.35%, possibly taking BTC down to the $30K–$40K range (orange box support zone).
📉 Correction Zones
Mid-cycle corrections like the one from Apr 2024, showing smaller drops (~20%).
📈 Trend Channel
Red diagonal lines form an ascending channel for bull market tops.
Current price (~$117,872) is nearing upper resistance of this long-term trend channel.
📊 Support/Resistance Levels
$120K & $125K: Horizontal resistance zones.
$57,959: Major historical support (former resistance).
$30K–$40K: Bear market bottom zone based on history and trendline confluence.
⏳ Cycle Timing
Historical cycles span about 4 years:
Peak → bottom → new peak = ~1,300–1,400 days.
This cycle’s timing aligns almost perfectly:
Nov 2021 → Jul 2025 = 1,300+ days (same as past cycles).
Suggests potential top is in or near.
📌 Summary & Outlook
Phase Estimate
Current Price ~$117,872
Projected Top ~$120K–$125K (likely topped 14 Jul 2025)
Next Major Drop -70% to -75% (target: $30K–$40K)
Next Cycle Low Mid 2026 (May–July 2026)
Strong Support Zone $30K–$40K (orange box)
🧭 Strategic Notes
If this chart pattern holds, major profit-taking should already be done or initiated.
Watch for weekly close rejections at trend channel top for confirmation of top formation.
Reentry in mid-2026 would historically offer a high reward/risk zone.
BTCUSD M15 NEW LOOKbtcusd buy from 117,500
TP1 118,000
TP2 119,000
TP3 120,000
Stope Lose 116,000
Trade at your own risk

Bitcoin Price Could test resistance 120K After DeclineBitcoin is consolidating within a range — not showing strong directional momentum yet — and is testing the resistance zone between 120K and 121K.
This is a critical supply zone, where buyers were previously liquidated. It’s a psychological level and might trigger profit-taking or heavy resistance from sellers. If BTC fails to break and hold above the 121K zone, there’s a high probability of a pullback toward the 116.2K–117K area to grab liquidity before a new move.
Former President Donald Trump signing new crypto laws could introduce market-moving fundamentals. However, the impact on price will depend on the content of those regulations:
You may find more details in the chart Ps Support with like and comments for better work.

BTC/USDT 125k? or 110k fall again?BTC/USDT 4H Analysis – July 20, 2025
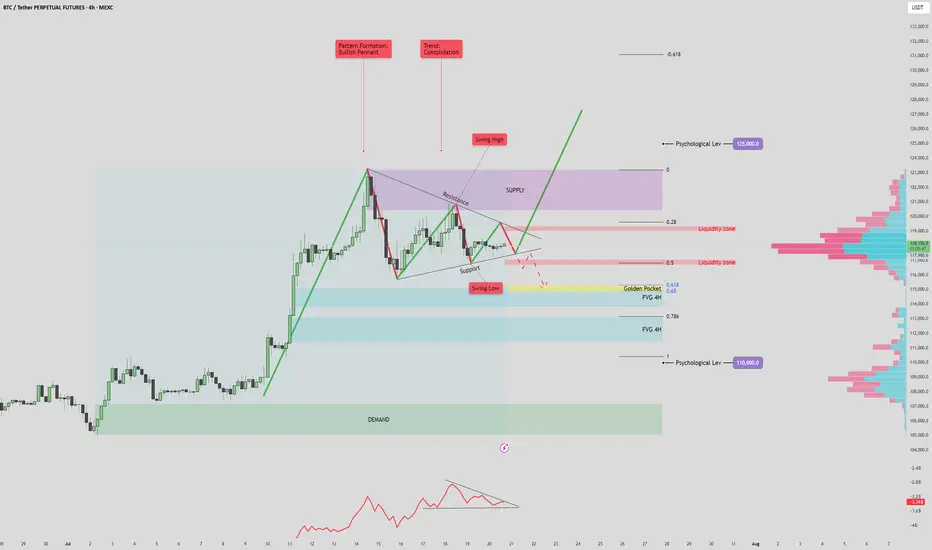
The current market structure shows a bullish pennant forming after a strong impulsive move upward, with price consolidating between key support and resistance levels. This pattern, combined with volume signals and key price zones, suggests a potential for a high-volatility breakout.
🔷 Volume Profile & OBV Insights
The On-Balance Volume (OBV) indicator is forming a symmetrical triangle, indicating a volume squeeze. This suggests a potential sudden spike in volume that could confirm the next major move.
Anchored Volume Profile (VPVR) on the right shows a notable low-volume area between 112K–115K. If price breaks below this zone, it could lead to a rapid selloff toward deeper fair value areas due to reduced liquidity support.
📈 Bullish Scenario
If price breaks above the pennant resistance and 119.5K liquidity zone, it may signal bullish continuation.
A successful retest of the breakout level as support would confirm strength, opening the door to:
Short-term target: 123K (supply zone and previous swing high)
Mid-term target: 125K (key psychological level and potential ATH)
Watch for confirmation via OBV breakout and strong bullish volume. Failure to sustain above the 118K–119K area could signal a bull trap.
📉 Bearish Scenario
A breakdown below pennant support and the 115K level would likely trigger a move into the low-volume range.
First key downside target: 114.7K–115.7K, which aligns with the Golden Pocket (Fib 0.618 zone) and a 4H Fair Value Gap (FVG).
This zone may act as a support or a liquidity grab reversal area.
If this zone fails to hold, deeper downside targets become likely:
FVG 2 (~112K)
Psychological support at 110K, which aligns with strong historical demand and a major VPVR node.
This bearish move may either confirm further downside momentum or present a fakeout opportunity if price sharply reverses from one of these deeper levels.
✅ Summary
BTC is coiled within a bullish pennant, with both bullish continuation and bearish breakdown scenarios in play. Volume confirmation and breakout direction will be key. Traders should monitor how price reacts around the 115K–118K zone for directional clarity. A move beyond this range, especially with volume support, will likely define the next trend leg.
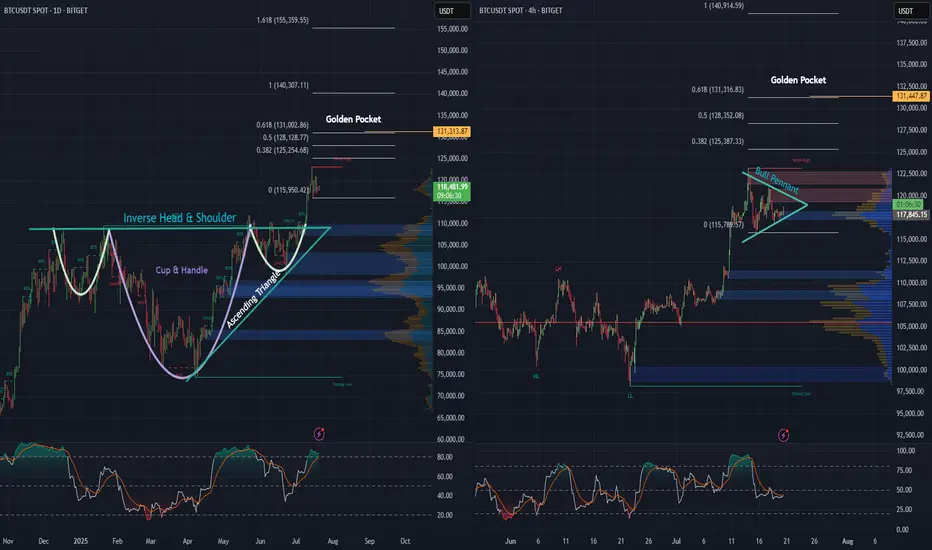
BTC daily, and 4 hr. Bullish Patterns Stack Up!Looking at the Daily and 4-hour charts for BTC, we can see multiple bullish formations unfolding.
An inverse head and shoulders - daily
A cup and handle - daily
An ascending triangle - daily
Price action looks strong, as we’ve begun the breakout from the neckline on the inverse H&S, as well as the cup and handle and ascending triangle simultaneously, and momentum is building fast.
Also, on the 4-hour chart, there’s a pretty substantial bull pennant taking shape. A breakout here could be the next leg up, and the push needed to keep momentum alive.
Zooming out, when we apply the trend-based Fibonacci extension, it reveals a $131,000 golden pocket, on both the the daily as well as the 4 hr. And that could be a major upside target if these bullish structures hold.
Stay tuned to see if BTC continues its move and sets a new all-time high.

Urgent Bitcoin Prediction: Longs Beware!!! Bitcoin longs should be careful, as we are below an important resistance and the market looks bearish. Wait for the confirmations I’ve shown in the video before making any moves! Trade professionally with a proper strategy and well-defined entry tactics!

accumulate, continue to aim for new ATH💎 Update Plan BTC (July 21)
Notable news about BTC
CEO of Charles Schwab, Rick Wurster, said the company plans to deploy Bitcoin and Ethereum transactions for customers.
This company aims to compete with Coinbase, where customers buy BTC.
This development takes place after the progress of cryptocurrencies when President Donald Trump signs the Genius bill into law.
In an interview on Friday, the CEO of Charles Schwab, Rick Wurster, said the company plans to launch Bitcoin (BTC) and Ethereum (ETH) to compete with Coinbase cryptocurrencies. The move took place after President Donald Trump signed the Genius bill, officially confirming the first cryptocurrency law in the United States.
Technical analysis angle
🟠 Main trend:
BTC is sideway accumulated in the amplitude of 117,000 - 122,000 after a sharp increase.
The chart shows the descending triangular model - a potential sign for Breakout.
🔍 important areas:
Resist:
122,000 - 122,700: Strong resistance area, fibonacci mold 1.0.
130,600 - 131,100: The expected area if Breakout is successful (Fibonacci extension 1.618).
Support:
116,000: Support close, coincide with EMA 200.
111,100: The support area is stronger if the current support breaks.
✅ Scenario 1 - Rise:
If the price turns from supporting 116k → Test the resistance area of 122k.
If the 122K break is definitive, the next goal is 130k - 131k.
❌ Scenario 2 - Discount:
If the 116k area is lost, the possibility of falling will fall more deeply at 111k.
This is also the strong EMA area Fibo 0.382 of the previous wave.
Please follow the channel to receive the latest and continuous updates on XauUSD, currency and BTC
BTCUSDTBitcoin, in case of protection of the long zone, will go to the final breakout to this peak. My vision of the situation and possible risks of short positions from the current ones. The scenario changes when the 0.5 zone is broken

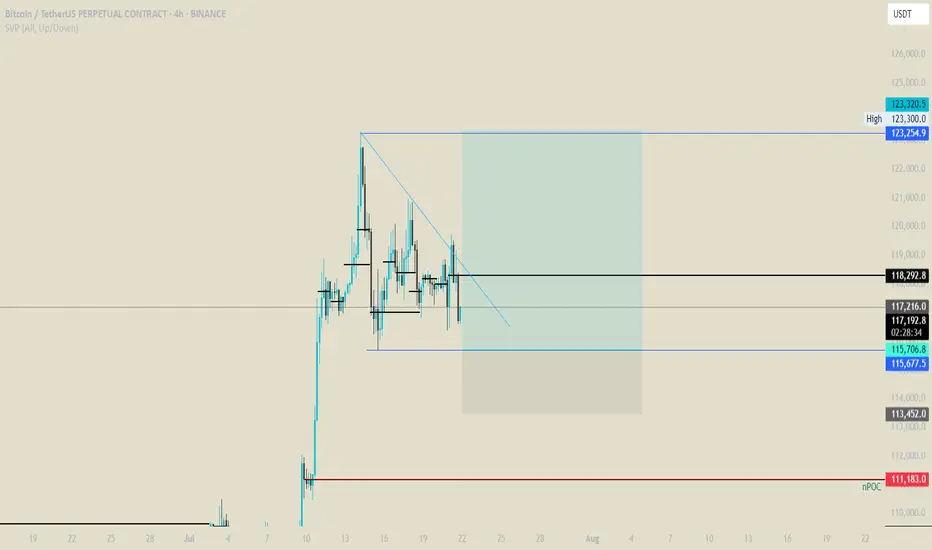
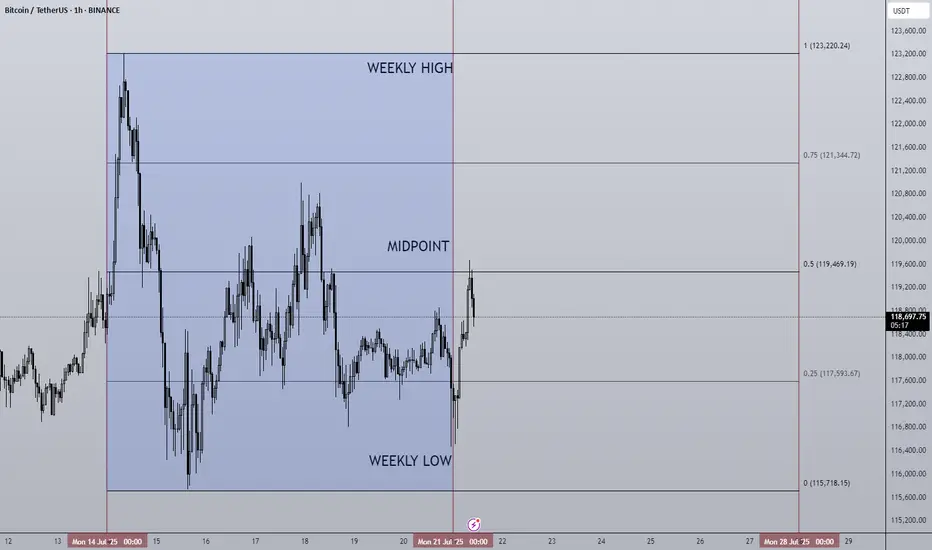
21/07/25 Weekly OutlookLast weeks high: $123,220.24
Last weeks low: $115,718.15
Midpoint: $119,469.19
New BTC ($123,220) & SPX ($6,315) ATH last week! We're really seeing progress being made on all fronts now, bitcoin saw its sixth week of net inflows into BTC ETFs ($2.39B).
The week began strong hitting the new ATH very early and then settled into a tight range to cool off. Altcoins however surged in relation to BTC to break out of HTF downtrends and begin to make up lost ground. One of the beneficiary's of this price movement has been ETH, breaking out from a multi year downtrend against BTC and hitting $3,800 in its USD pair.
For this week I do expect much of the same for BTC as momentum is with altcoins for now. However, as those altcoins reach HTF resistance levels it becomes very important for Bitcoins chop to be accumulation for the next leg up and not distribution for the way down. With so few pullbacks the threat of a sudden correction is present but the probability drops should BTC look to press higher with strong demand.
The ECB Interest rate decision takes place on Thursday but no changes to the 2.15% rate is forecast. In terms of news there are no planned upsets that I can see.
Good luck this week everybody!
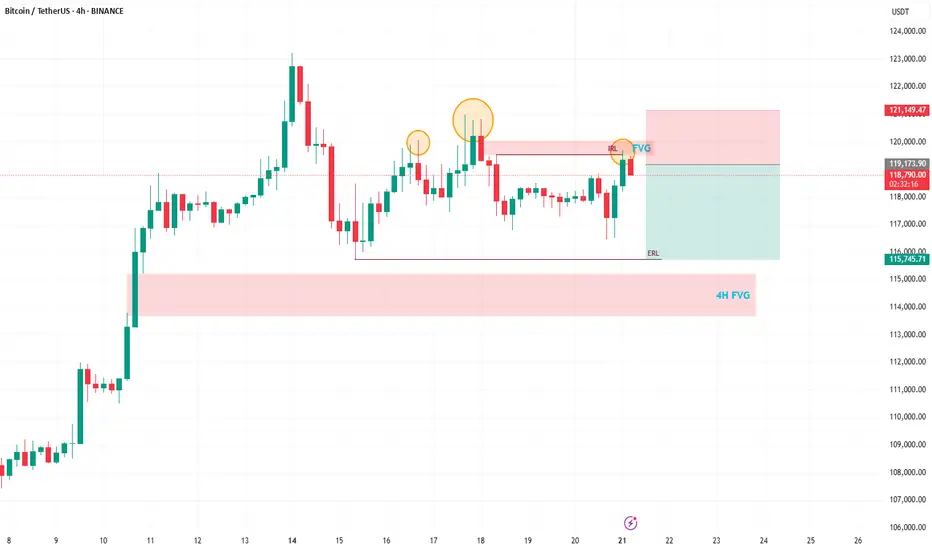
Bitcoin Trading Update: Consolidation, Patterns, and What's NextHey Fellow Traders! 👋
Bitcoin (BTC) has been on a wild ride after hitting its all-time high (ATH)! 📈 Since then, it’s been consolidating, generating liquidity, and setting the stage for the next big move. Meanwhile, altcoins are absolutely booming, stealing the spotlight! 💥 As we kick off the week, let’s dive into what’s happening with BTC and what to watch for.
📊 Technical Analysis Breakdown
Here’s what I’m seeing on the charts:
Head and Shoulders Pattern: A clear head and shoulders has formed on BTC, signaling a potential bearish move. 🐻
Daily Timeframe Order Blocks: These are in play, showing key levels of support and resistance.
Filled Fair Value Gap (FVG): A recent FVG on the daily chart has been filled, but there’s still a beautiful 4H FVG waiting to be tested below.
Liquidity Sweep: After the ATH, BTC needs to clear the liquidity from the past few days before it can push for new highs.
🔍 What’s Next for BTC?
I’m expecting a bearish reaction in the near term, with BTC targeting the sell-side liquidity around $115,800. This move should also fill the 4H FVG, setting the stage for a potential bounce and another shot at the ATH. 🚪 Keep an eye on these levels, as they’ll be critical for the next big move!
🔔 Stay in the Loop!
Let’s keep the conversation going! 💬 Follow for more updates, like if you found this helpful, and drop a comment with your thoughts or what you’re seeing in the markets. Are you trading BTC or riding the altcoin wave? Let’s hear it! 👇
Happy trading, and let’s make this week count! 💪
#Crypto #Bitcoin #Trading #TechnicalAnalysis
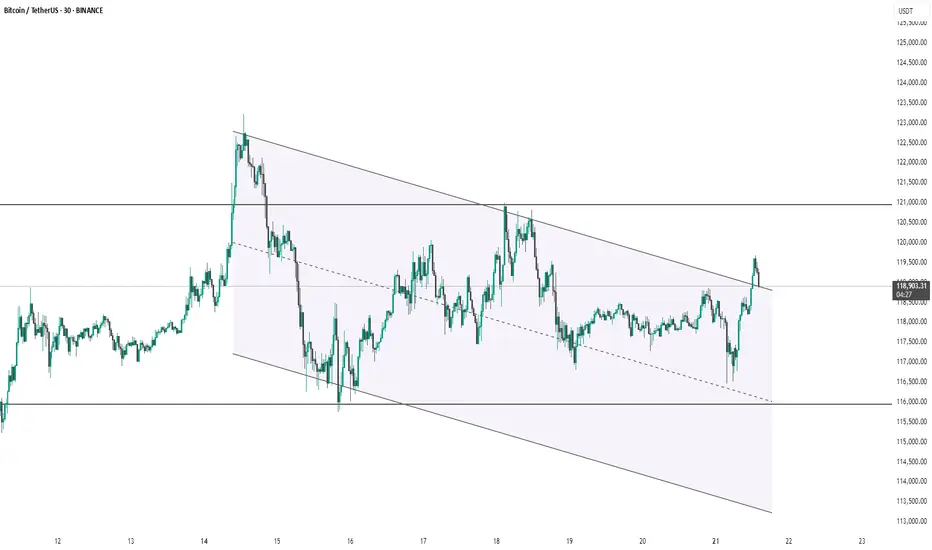
BTC #Bitcoin (BTC/USDT) 30-minute chartThis Bitcoin (BTC/USDT) 30-minute chart shows price action within a descending parallel channel. Recently, the price broke out above the channel's upper boundary, suggesting a potential bullish breakout. However, the price has slightly pulled back, now retesting the breakout zone near $119,000. Holding above this level may confirm the breakout and lead to further upside, while failure to hold could signal a false breakout and potential return into the channel. Key support and resistance levels are marked around $116,000 and $121,000 respectively.
thanking you
#BTC Update #8 – July 21, 2025#BTC Update #8 – July 21, 2025
Bitcoin isn’t moving in a textbook symmetrical triangle, but it’s trading in a similar, tight range, mostly bouncing around the highlighted box area in the chart. It’s attempting a new impulsive leg, but $120,000 remains a key resistance level, having rejected price several times already.
As long as $116,500 holds, there's no major risk for Long bias. However, considering the triangle-like structure, the short-term upside is limited to about 2% for now.
A breakout above the upper edge of this structure, particularly if $123,200 is broken with strong volume — would justify a Long position. Until then, I don’t plan on entering any trades.
The last corrective move has completed, and my next major upside target is $127,900. If further correction occurs, watch for potential support around $115,000, $113,000, and the strong base at $112,000 — though I don’t expect price to fall that low.

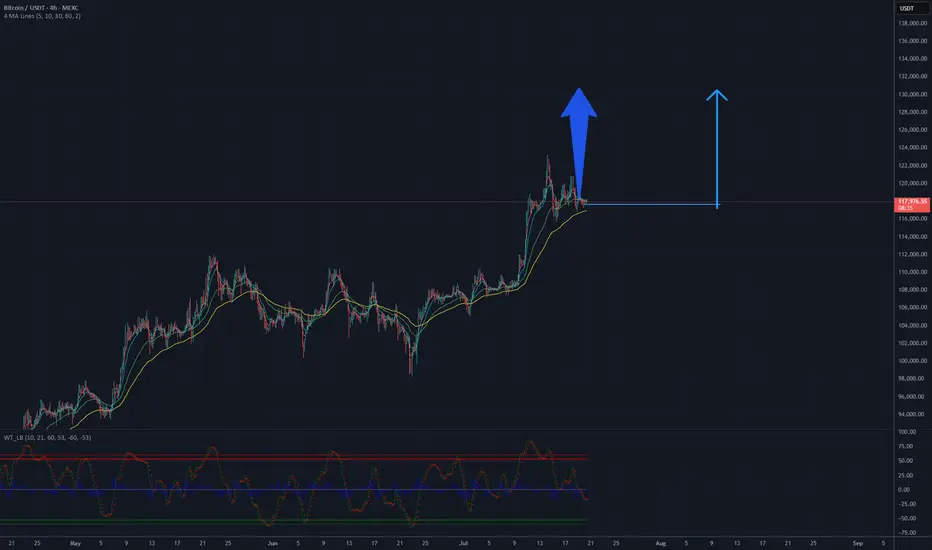
BTC will be 130 K USD? Potential target 130 000 USDAnalysis of the Bitcoin (BTC/USDT) chart on the MEXC platform indicates a positive upward trend. The price is currently hovering around $117,823, with clear support at approximately $100,000, as confirmed by the lower channel line. Moving averages (MA) suggest a sustained upward trend, and the trend line drawn from the lows points to potential for further growth. The current resistance is in the $120,000-$125,000 range, but if momentum holds and this level is breached, the price could head toward $130,000 in the short to medium term. It is recommended to monitor volume and key support and resistance levels to confirm further upward movement.
Potential TP: 130 000 $
Local Top Confirmed, Short-Term Bearish Pressure BuildingBTC/USDT 1H – Local Top Confirmed, Short-Term Bearish Pressure Building
📍 Timeframe: 1 Hour
📍 Exchange: MEXC
📍 Pair: BTC/USDT
📍 Bias: Short-term bearish, watching for support re-test near 116k
Market Context:
BTC broke out aggressively earlier in the week, pushing above the 120k psychological level before forming a local top near 122k. Since then, we’ve seen:
A strong rejection wick at the top
Lower highs forming
A bearish engulfing candle marking the shift in momentum
Technical Observations:
Bearish Signs:
MACD histogram rolling over, showing fading bullish momentum
QQE MOD flipping red, indicating a shift toward bearish control
RSI crossing below 50 and trending downward — loss of bullish strength
A clean rejection off recent highs, creating a double top feel
Volume on the recent sell candle is higher than average, suggesting strength in the move down
Support Zones to Watch:
116.5k: Prior breakout zone and most recent demand zone
114.8k – 115.2k: Volume consolidation area; if broken, may invite sharper downside
112k: Key structure zone from previous sideways range
Potential Scenarios:
Bearish Continuation (more likely short term):
Break below 116.5k could lead to fast drop to 114.8k support
RSI and MACD momentum align with this move
Look for breakdown confirmation with volume spike + close under structure
Bullish Reversal (less likely unless invalidation):
Hold above 116.5k + reclaim of 118.2k with strength
RSI must turn up above 50 and MACD histogram flip blue
Could target re-test of 120k–121k if bullish momentum returns
Trading Approach:
Short-term traders may look for pullbacks to short under 118k with 116.5k as the first target
Swing traders should be cautious and wait for confirmation at 116k–115k zone before considering long re-entries
Avoid chasing breakouts — let the market confirm direction first
Conclusion:
BTC on the 1H chart shows signs of exhaustion after a strong run. The market is leaning toward a correction phase. Watch the key support levels — they will dictate whether this is a short-term dip or the start of a deeper move.

**BTC/USDT Monthly Analysis: Navigating Key Resistance****Overview:**
On the monthly timeframe, Bitcoin (BTC) is exhibiting significant strength as it approaches a pivotal historical resistance zone. This multi-year resistance, ranging approximately from **$115,000 to $120,000**, represents a critical inflection point for the asset.
**Key Observations:**
1. **Historical Resistance Test:** The current price action sees BTC challenging a formidable resistance level that has previously acted as a major ceiling. A decisive breakout above this zone, supported by strong volume, would signal a continuation of the bullish trend towards new all-time highs.
2. **RSI Bearish Divergence:** A notable observation on the Monthly Relative Strength Index (RSI) is the presence of **bearish divergence**. While price has made higher highs, the RSI has printed lower highs, indicating a potential weakening in bullish momentum. This divergence suggests that the current upward move might be losing steam and could precede a healthy price correction or consolidation phase. This is a crucial cautionary signal for long-term holders and potential new entrants.
**Outlook:**
The bullish macro trend for Bitcoin remains intact, yet the confluence of strong historical resistance and a developing bearish divergence on the monthly RSI warrants caution. Traders should closely monitor for a clear break and sustained close above the $120,000 level to confirm further upside. Conversely, a rejection from this resistance zone could lead to a significant retracement to key support levels.
**Disclaimer:** This analysis is for informational purposes only and does not constitute financial advice. Always conduct your own research and manage your risk appropriately.
**M. Kiani**
```ش

Bitcoin is still bullish (4H)Bitcoin appears to be in a dual bullish structure, currently in the second bullish phase following wave X.
Considering the expansive nature of the correction in the second pattern, it seems we are within an expanding triangle or a diametric structure.
Based on the duration of wave C, it appears that the bullish wave of the second structure is not yet complete.
We expect such fluctuations for Bitcoin in the coming period.
A daily candle close below the invalidation level would invalidate this outlook.
For risk management, please don't forget stop loss and capital management
Comment if you have any questions
Thank You
