BTCUSD SHORT POSITION = SELLWe can see that BTCUSD consolidated a and ended up given us a possible sell.
To my point of view, we can take a sell position at an Entry = 117878.44 with a proper calculated risk of a SL = 118285.00.
With this short position we can expect to take our profits at the following zones:
TP1: 117509.65
TP2: 117386.65
TP3: 117267.62
TP4: 117066.41
The takes profits are a calculated Risk Reward Ratio of 1.00 to 2.00
It is advisable to use a small lot size or according to your account
BTCUST trade ideas

Bitcoin's Critical Zone: Breakout or Breakdown?
✨ Stay ahead of the market — follow for daily crypto insights & smart analysis.
🧠 Think smart. Trade smart.
🚀 Tap the rocket if you're ready for liftoff!
🔍 Bitcoin Analysis (BTC)
📌 Scenario 1:
For BTC to break above 122 this time, it’ll need a real whale push. There are still many micro sellers at that level, and a slow, gradual move like yesterday likely won’t work.
Since buyers already spent their dry powder, they might not have enough left to defend 110 if price gets rejected again.
📌 Scenario 2:
But if price doesn’t attempt 122 again from here, we probably won’t see the 110 bottom either — simply because buyers haven’t deployed capital yet and may be waiting for entries around 115. That forms a potential range between 115 and 122.
🕰️ Daily timeframe:
Market is resting for now.
🎯 Entry trigger: 120.35
If price struggles at this level and BTC dominance isn't strong, we’ll likely shift attention to altcoins.
If BTC gets rejected at 122 and dominance turns red, again — alts may outperform.
💡 Current BTC & ETH positions remain open. No interest in shorts.
As long as we stay above 115, the focus remains on alt/BTC pairs during dips.
📊 TOTAL Market Cap:
🟡 Although we moved above 3.78 yesterday, we don’t call that a breakout — unless price moves away from the level significantly. Right now, it’s still struggling near resistance.
Next key level to watch for a true breakout: 3.91
This is the same region BTC needs a whale to push through.
📈 TOTAL2 – Entry Trigger: 1.05
If any altcoin shows strong momentum and volume before this level breaks (⚠️ low weekend volume is expected), we can consider that a signal.
On Saturdays, volume confirmation is tricky, so we may take small breakout trades using only 0.25% of capital, with fewer positions.
💠 OTHERS.D:
If BTC dominance drops, BTC ranges, and OTHERS.D rises ⬆️
➡️ It suggests that non-top-10 coins are starting to move.
That’s when we should analyze dominance of each top 10 coin individually.
🎯 Entry trigger: 7.80
💵 USDT.D:
No clean level for now, but keep an eye on 3.80 going forward.
🌐 ETH/BTC:
Still bullish, showing no signs of pullback. Price continues to push up.
✨ Stay ahead of the market — follow for daily crypto insights & smart analysis.
🧠 Think smart. Trade smart.
🚀 Tap the rocket if you're ready for liftoff!

BTC/USD Fake out before Pump | Bullish Flag formationBTC/USDT (1D) Market Outlook – July 1, 2025
Introduction
BTC is currently consolidating within a bullish flag pattern after printing a swing high at 108.9K and a recent swing low at 98K. The price sits just below a major supply zone.
Context 1: Key Zones
Supply: 104.6K – 112.1K
Demand: 74.4K – 82.5K
Fair Value Gaps (FVG): 3 zones below price, with one near 88–90K
Context 2: Technical Confluence
Liquidation Zone: 106.2K
Golden Pocket (Fib 0.618): 102.1K
Psychological Levels: 105K and 110K
Context 3: Market Structure
Pattern: Bullish flag
Trend (LTF): Sideways/consolidation
Volume Profile: Heavy activity near 105K–110K
Bullish Scenario
Breaks above 106.2K (liq zone)
Pulls back to 102.1K (golden pocket), forms higher low
Retests resistance for continuation
Alt scenario: clean breakout above resistance → ATH retest
Bearish Scenario
Breaks below 106.2K and flag support
Fills FVG, breaks prior low at 98K
Triggers macro downtrend toward 88–90K zone
Summary
BTC is at a decision point inside a bullish flag, facing supply. A break above 106.2K favors upside continuation, while rejection and a lower low could trigger a deeper retracement. Watch key levels closely.

Bitcoin's Critical Zone: Breakout or Breakdown?
✨ Stay ahead of the market — follow for daily crypto insights & smart analysis.
🧠 Think smart. Trade smart.
🚀 Tap the rocket if you're ready for liftoff!
🔍 Bitcoin Analysis (BTC)
📌 Scenario 1:
For BTC to break above 122 this time, it’ll need a real whale push. There are still many micro sellers at that level, and a slow, gradual move like yesterday likely won’t work.
Since buyers already spent their dry powder, they might not have enough left to defend 110 if price gets rejected again.
📌 Scenario 2:
But if price doesn’t attempt 122 again from here, we probably won’t see the 110 bottom either — simply because buyers haven’t deployed capital yet and may be waiting for entries around 115. That forms a potential range between 115 and 122.
🕰️ Daily timeframe:
Market is resting for now.
🎯 Entry trigger: 120.35
If price struggles at this level and BTC dominance isn't strong, we’ll likely shift attention to altcoins.
If BTC gets rejected at 122 and dominance turns red, again — alts may outperform.
💡 Current BTC & ETH positions remain open. No interest in shorts.
As long as we stay above 115, the focus remains on alt/BTC pairs during dips.
📊 TOTAL Market Cap:
🟡 Although we moved above 3.78 yesterday, we don’t call that a breakout — unless price moves away from the level significantly. Right now, it’s still struggling near resistance.
Next key level to watch for a true breakout: 3.91
This is the same region BTC needs a whale to push through.
📈 TOTAL2 – Entry Trigger: 1.05
If any altcoin shows strong momentum and volume before this level breaks (⚠️ low weekend volume is expected), we can consider that a signal.
On Saturdays, volume confirmation is tricky, so we may take small breakout trades using only 0.25% of capital, with fewer positions.
💠 OTHERS.D:
If BTC dominance drops, BTC ranges, and OTHERS.D rises ⬆️
➡️ It suggests that non-top-10 coins are starting to move.
That’s when we should analyze dominance of each top 10 coin individually.
🎯 Entry trigger: 7.80
💵 USDT.D:
No clean level for now, but keep an eye on 3.80 going forward.
🌐 ETH/BTC:
Still bullish, showing no signs of pullback. Price continues to push up.
✨ Stay ahead of the market — follow for daily crypto insights & smart analysis.
🧠 Think smart. Trade smart.
🚀 Tap the rocket if you're ready for liftoff!
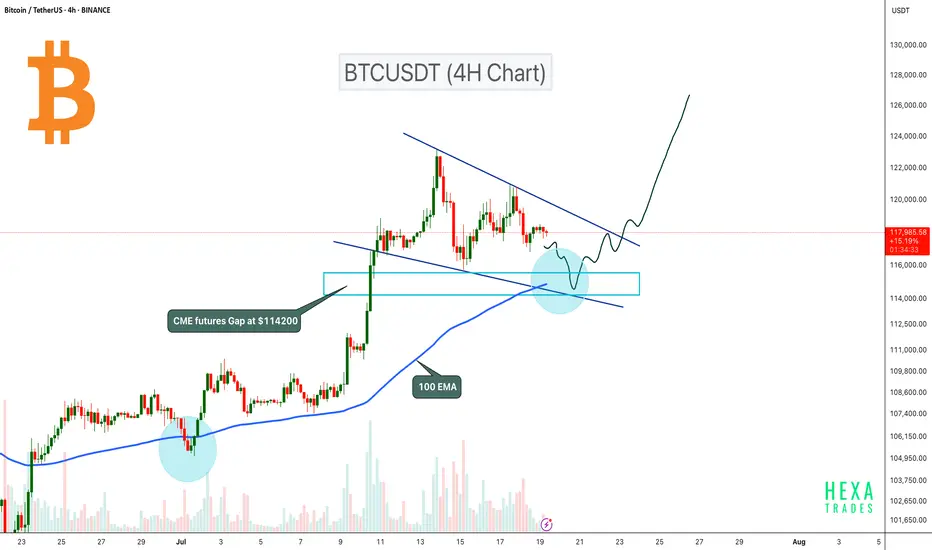
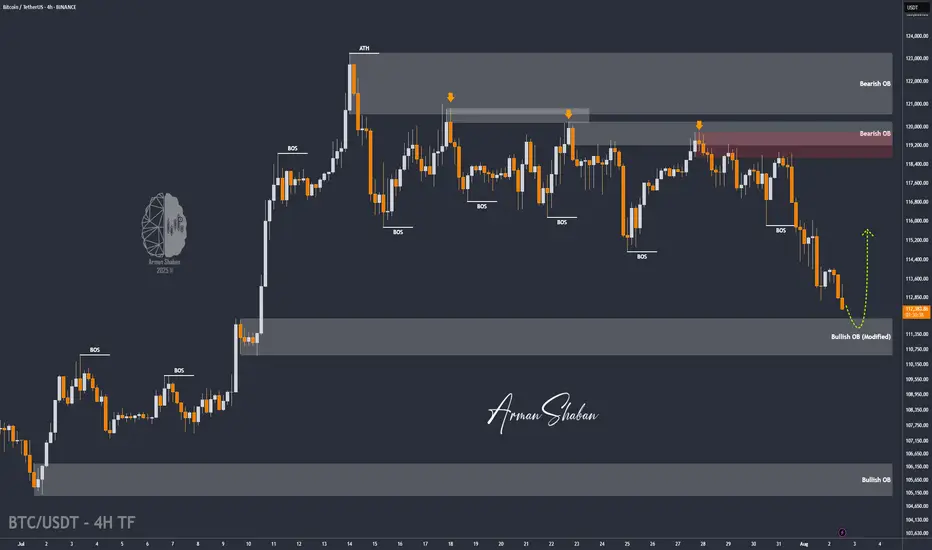
BTC Pullback Expected to $114K Before Next Leg Up!Bitcoin is currently consolidating inside a bullish flag pattern on the 4H timeframe. The price could retest the flag support, where the 100 EMA will act as dynamic support. Additionally, there is a CME futures gap at the $114,200 level, which also aligns with the 0.5 Fibonacci retracement level. Therefore, a retest to the $114,200 zone is likely before the next potential upward move.
A potential bullish reversal could occur if BTC retests this zone and confirms a bounce. A breakout from the bullish flag pattern could signal the next leg up.
Cheers
Hexa🧘♀️
BITSTAMP:BTCUSD CRYPTOCAP:BTC
The Only Bitcoin Chart You NeedUnderstanding Price Action is essential for successful trading as it allows traders to interpret market dynamics and make informed decisions based on pure price movements. By focusing solely on price movements, traders can eliminate noise and distractions caused by indicators or external factors, leading to a clearer understanding of market trends and patterns.

BTC - HOOOLLDDD!!!!Looks like we got our downside first.
Short update, but important level to watch is that 112k high from May this year. I longed on a ltf low hold, looking for a bounce into the highs of this sell-off cluster, then see what's what.
Flow is still very heavy; I expect to get stopped on this but it's one of those setups I just have to take, or I kick myself tomorrow.
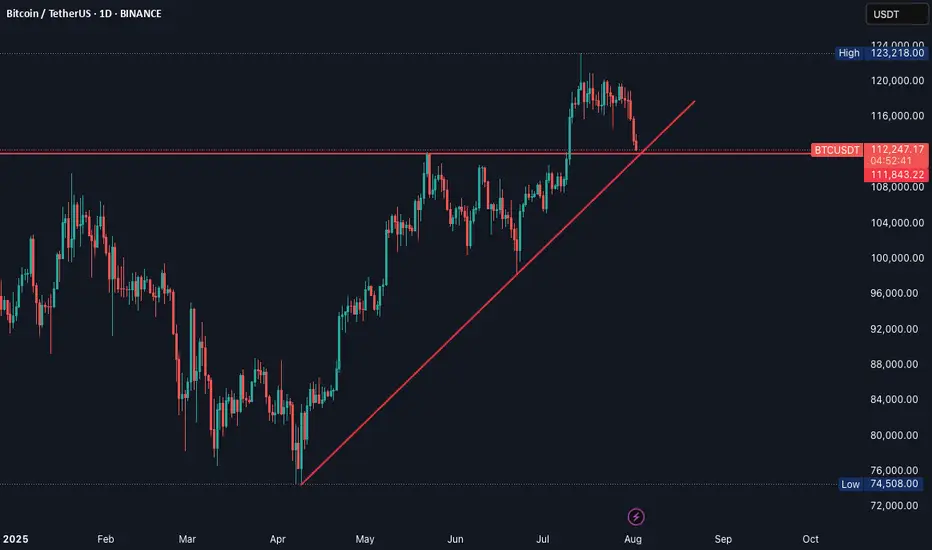
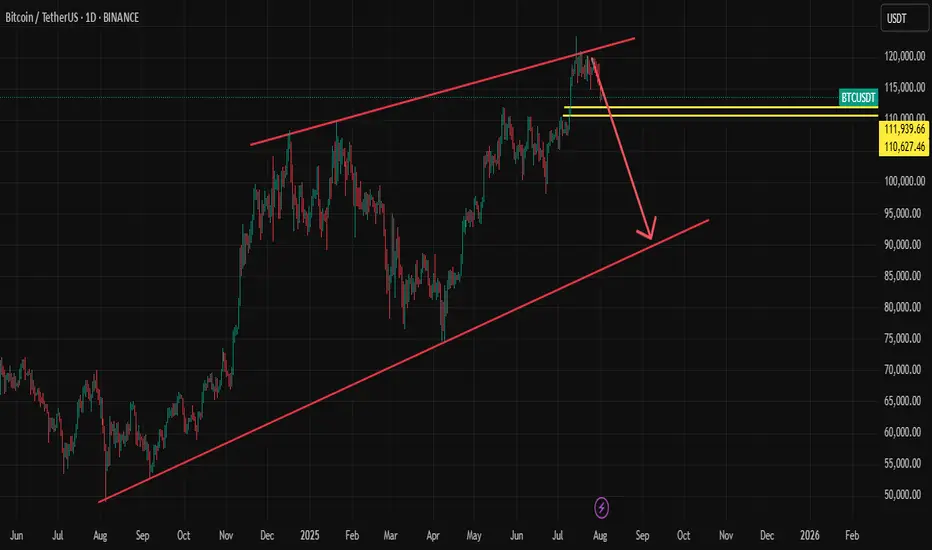
From Euphoria to Exhaustion – BTC's Next Move?BTC Idea – Bearish Divergence + Key Level Watch ⚠️
Summary / Bias:
BTC has tapped 120K and is now showing early signs of weakness. A bearish divergence on the MACD Histogram (weekly) is flashing caution, while price has retraced back to the critical 112K zone. I'm leaning bearish short-term, expecting a move towards 100K, and possibly as low as 93K, if key confirmations unfold.
Technical Context:
Weekly MACD Histogram shows a clear bearish divergence, signaling potential exhaustion.
BTC rejected from 120K and has pulled back to 112K.
Price crossed below the Yearly Camarilla L#, but we need a weekly close below to confirm further downside.
112K remains the key pivot – failure to bounce strongly here could open the door for deeper retracement.
Scenarios to Watch:
🟥 Bearish Continuation (Primary Bias)
Breakdown and close below 112K
Downside targets:
TP1: 100K
TP2: 93K
🟨 Neutralizing Risk
Hold above 112K with strong bounce = neutral bias, reassess
Close back above 115K+ with strength = invalidate bearish lean
Caution & Patience:
Now is not the time for aggressive longs. Signs of exhaustion + major level retest call for defensive positioning and high-quality setups only. Let confirmation guide entries.
NFA. Risk management always.
Will update if structure shifts.
btcThis is not a signal.
Just my outlook on BTC based on data
No fluff
No fancy indicators
And definetly no rectangles
Just watch and see how it plays out, as we are currently in a big indecision zone as well as the weekend I would not enter any positions now but rather wait for monday-wednesday to enter.

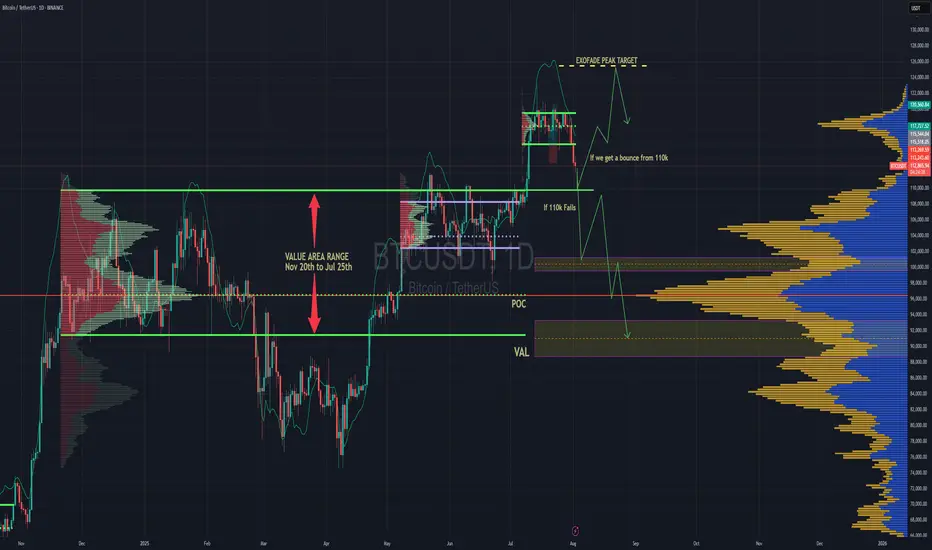
BTC Forecast For August & September. The Only Roadmap You Need !This is one is so obvious, its a no brainer , and would likely be very easy to trade as long as you follow this road map i have provided.
The Value Area High at 110k price range is most important upcoming battle line between bull vs bear. If bulls fail to get a strong bounce from 110k and we close at least 2 daily candles below it. Then it would mean bears have full control and the implication of that is that since we would at that point be closing back inside an established Value Area range, formed between Nov 20th to Jul 25th, then it would mean the probability of price selling all the way down to re-test the VAL (value area low) at $91.6k would instantly become very very high.
After re-testing $91.6k we'll watch and see what happens.
It'll either hold after grabbing some liquidity below and stay in the Value Area Range until further notice Or we lose it and the sell off continues. Bear market will be in full swing if that happens and you can bet a ton of weak hands will start to exit due to max pain & cascading long liquidations. Fear index will be back in the red at that point as capitulation starts to set in. Alot of new alts and meme coins will be completely obliterated.
Bullish Continuation Scenario
If bulls get a strong bounce from 110k and don't close back inside the Value Area Range below, then we could continue up to a make a new ATH for a classic trend pullback continuation trade. Once we get back above 115.4k, the dream of a new ATH will become much more realistic. There is an UFA(Unfinished Auction) at 120.8k which is only visible to traders using the market profile or footprint chart. This make poor high and needs to be taking out at some point.
For the Price target to the upside, we would be using the peak formation line of the ExoFade indicator.
BTC- On a Crucial Testing PointBTC Seems to be testing a strong support point, if it bounce back , it's good opportunity to buy, otherwise sell.
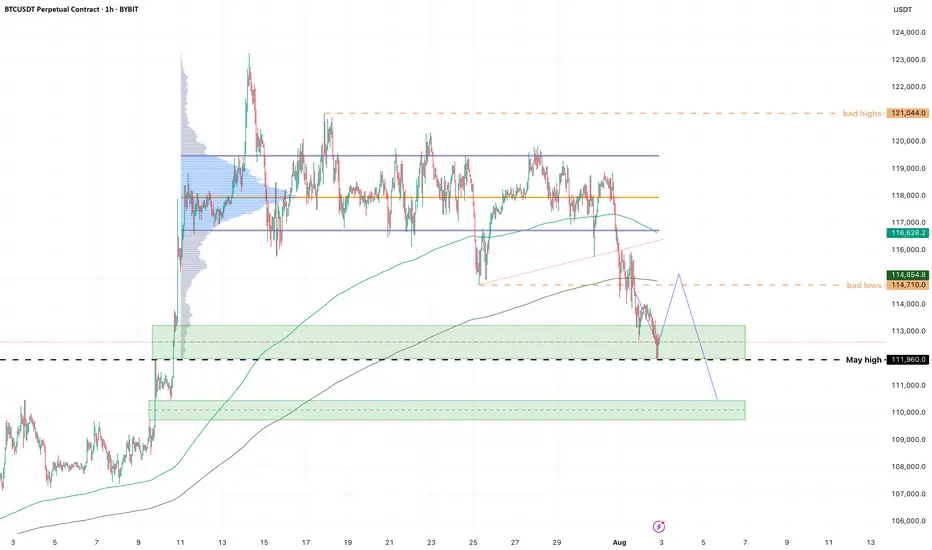
BTC/USDT | Bitcoin Eyes Rebound from $110K Support Zone! (READ)By analyzing the Bitcoin chart on the 4-hour timeframe, we can see that after reaching a new high at $123,218, the price began to pull back and has now corrected down to around $112,500. I expect the current volatility to ease soon. The next critical support zone lies between $110,500–$112,000 — watch price action closely here, as BTC could bounce from this area and push back toward $116,000+. Other key demand zones are located at $109,000, $107,900, and the $105,000–$106,000 range.
Please support me with your likes and comments to motivate me to share more analysis with you and share your opinion about the possible trend of this chart with me !
Best Regards , Arman Shaban
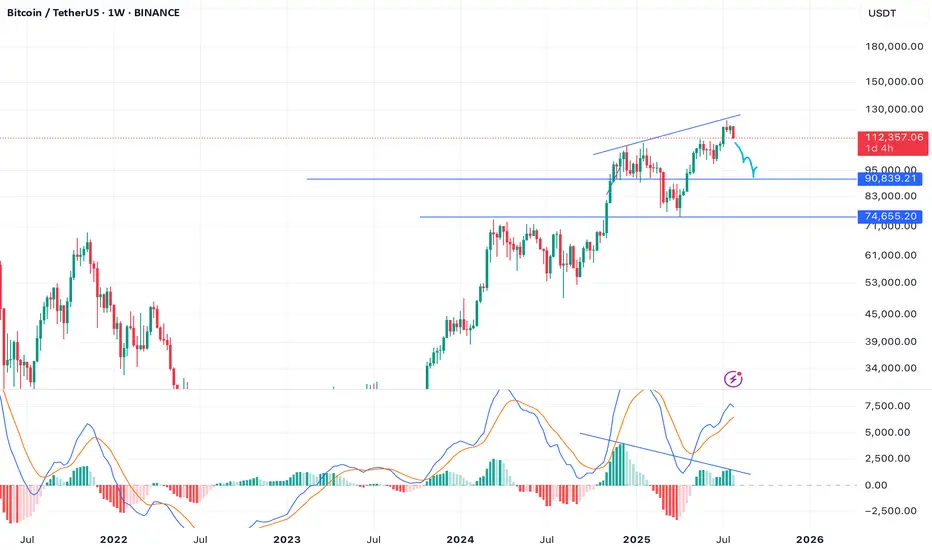
Bitcoin Enters Correction Mode?Bitcoin is already trading at support in the form of the previous all-time high and EMA55. Bitcoin is down more than 8% since its 14-July all-time high. We can see that a correction is already in, a retrace. This retrace we consider part of the normal workings of the market, price fluctuations which invariably always show up. The end result is a higher high, a rising wave, higher prices on the long haul.
Support is strong at current prices but even stronger is the support zone right above $100,000. As long as Bitcoin trades above $100,000, we will continue with a strong bullish outlook. If Bitcoin manages to move and close below $100,000 monthly or weekly, we will consider the short-term, the mid-term and update our map if necessary. For now, the bulls are still in control.
When Bitcoin peaked 22-May it went sideways for an entire month. From a peak of $112,000 it hit a low of $100,000. Now we have a peak around $123,000 and prices can easily swing around in this wide range.
After a few weeks, or several months, exactly as it happened last time, Bitcoin will go up. So you can expect retraces and corrections, but this is only short-term long-term we grow.
Namaste.

BTC/USDT Long Setup - Dual entry position
🟢 BTC/USDT Long Setup – Dual Entry Position
I’m going to be positioned long on BTC with two entries:
Entry 1: 109K if don't holds
Entry 2: 101k
Stop-loss: 97K
Target: 148.5K
R/R: ~5.4:1
Reasoning:
Market structure remains bullish with clean higher highs and higher lows.
The recent selloff is seen as a healthy pullback into a demand zone — not a trend reversal.
Both entries are placed to catch either a shallow bounce or a deeper liquidity sweep without overexposing risk.
Setup remains valid unless we see a clean daily close below 97K.
Letting price play out — no mid-range noise, no overtrading. Focused on structure, trend, and reward.
---

Bearish sign on BTC targeting 97kmy idea on btc as per the chart watch 110 level if broken then 102k then 97k

BTC190000 soonthis is way to btc going to 190000 soon or late after that i say btc should have very massive sell
but befor that we nead to btc go to up 190000

AUDIO Uptrand Soon ✏️ Use less funds 5% - 10%
💥 Wait & Get The Best Entry
🦊Pair : AUDIO/USDT 🟢
🐢 SPOT
🏎️ Buy :
♻️ 0.0555
♻️ 0.0540
🎉️Sell -
💵 0.0664
💵0.0779
BTCUSDT: Good Opportunity to buy Bitcoin has dropped sharply since NFP data came out. We can now see price reversing nicely from 109k area.

Bitcoin is experiencing a major collapse!Bitcoin will fall further from August 8th and crypto will officially end.

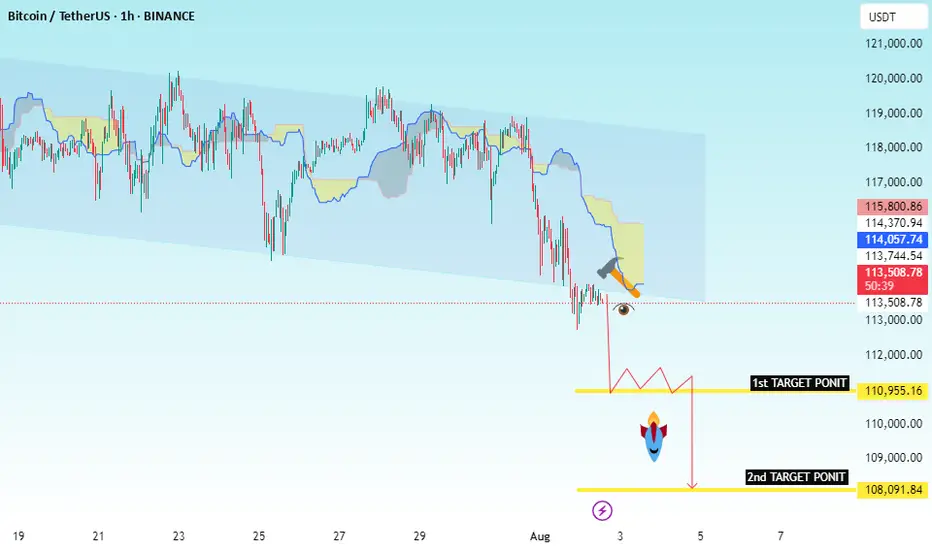
BTC/USDT Bearish Continuation SetupChart Identification:
Timeframe: Likely 1H or 4H
Pair: BTC/USDT
Indicators: Ichimoku Cloud
Pattern: Price broke down from cloud resistance and is retesting previous support
Setup: Bearish continuation with consolidation before next leg down
---
✅ Trade Setup (Sell):
🔹 Entry Point:
Sell Entry: Below 113,500.84
This level marks the neckline of a small consolidation zone.
Wait for clean candle close below this level.
---
🎯 Target Levels (Take Profit):
1. TP1: 110,955.16
Previous minor support
2. TP2: 108,091.84
Key support/demand area
---
🧠 Optional Confirmation:
You can wait for:
Bearish candlestick pattern at 112.1K zone
Rejection of retest near 113.7K–114.3K (top of cloud)
---
📌 Summary:
> BTC/USDT Short Setup
🟢 Entry: Below 113,500.84
🎯 Target 1: 110,955.16
🎯 Target 2: 108,091.84
Bearish bias as price remains below the Ichimoku cloud and shows signs of continuation.
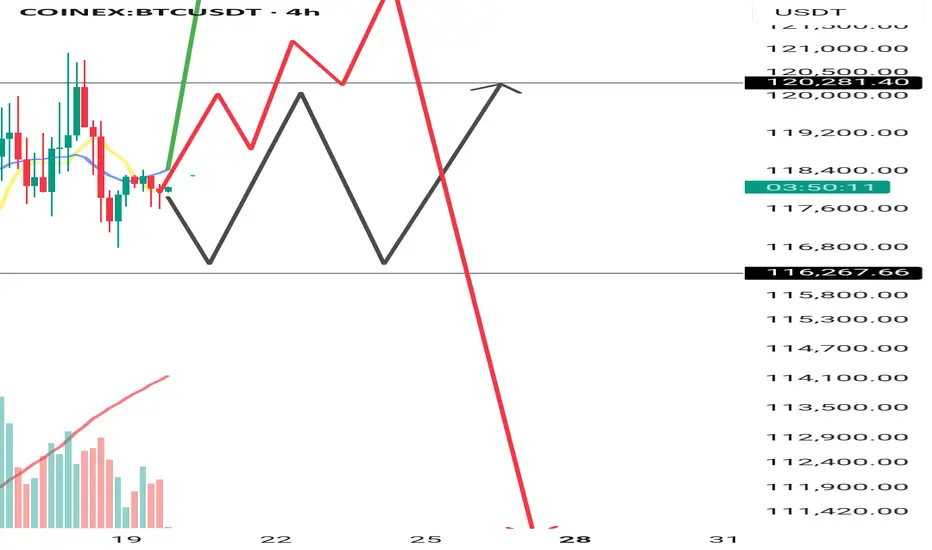
BITCOIN - Price can turn around and start to move upHi guys, this is my overview for BTCUSD, feel free to check it and write your feedback in comments👊
The price reversed its prior downtrend with a decisive breakout from a falling channel.
This breakout triggered a strong upward impulse, which then began to consolidate into a large symmetrical pennant.
However, the price recently failed to hold the lower support trendline of this pennant and broke to the downside.
The asset is currently trading just below this broken trendline, in what appears to be a liquidity grab.
To continue upwards, buyers must now overcome the immediate resistance located at the $116300 level.
I expect that this breakdown was a fakeout, and the price will soon reverse, break through the $116300 resistance, and continue its rally toward the $121000 target.

Overhyed Punishment This is what happens when everyone starts to fomo.
Lucky things, I sold some of my Altcoin with profit when BTC went into overbought band as in my chat.
BTC is bearish as long as below 117.6 to 118k :) . Good luck
