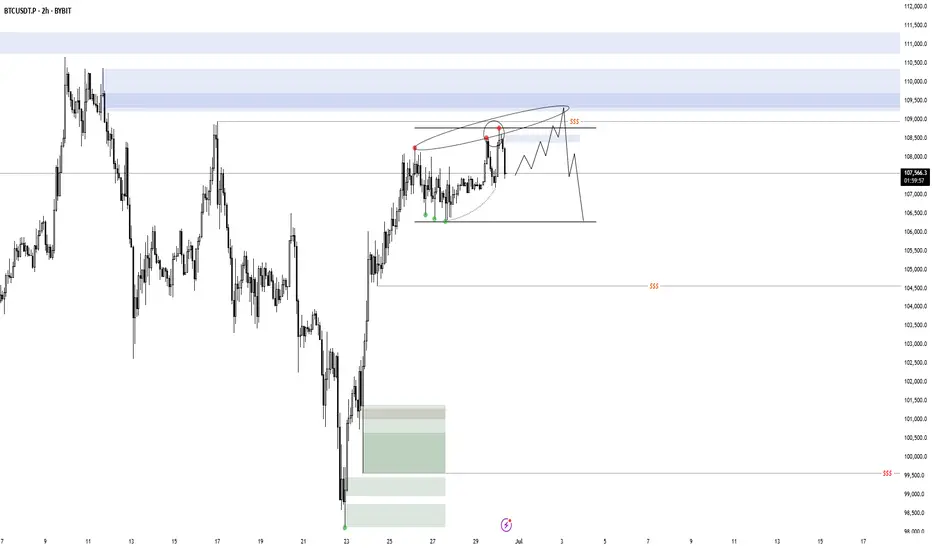
30/06/25 Weekly OutlookLast weeks high: $108,531.02
Last weeks low: $99,592.69
Midpoint: $104,061.86
Overall a positive week for BTC in isolation as price moves steadily all week reclaiming the losses made in the week from the 16th-23rd June. This comes after a $2.2B BTC ETF weekly inflow, the 3rd consecutive week of net inflows.
Having now hit the key S/R level of $108,500 it will be interesting to see where BTC goes from here. Jumping up above the level will require a lot from the bulls as ATH is within touching distance and so buying into major resistance is a tough ask. We also have Geo-political uncertainties to add to the situation, one bad tweet is all it takes sometimes to do a lot of damage.
On the other hand the SNP500 hits new ATH in the same conditions and so BTC is more than capable of doing the same.
So far in the first hours of this weeks trading we do have a SFP of the weekly high setup, not ideal for the bulls in any way and so from here the a retest of the range quarters, midpoint being the key area would make sense, invalidation would be a clean break above weekly high with acceptance and strong volume on the move to break the rangebound/choppy environment.
There is also the "window dressing" element to the months &quarter end today. History shows a de-risking going into these events and more money flowing back into risk-on assets in the days following monthly/ quarterly end. For that reason a bullish move (if there were to be one) would come later in the week IMO.
Good luck this week everybody!
BTCUST trade ideas

BTCUSDT in a sell zone Let's keep it simple.
The IOF is bearish on the H4 timeframe.
Price has retraced to a premium zone.
Technically, once we see a lower timeframe confirmation from these zones, we take a sell.
While I'm eyeing the liquidity at 109050, any break below 106415 will usher us into a sell towards 99000.
Use your proper entry confirmation and risk management.

BTC Efforts to break the trend to create a new ATHPlan BTC today: 30 June 2025
Related Information:!!!
As of Monday, Bitcoin (BTC) is trading around $108,500, approximately 3% below its all-time high. Ethereum (ETH) has closed above a key resistance level, indicating the potential for a sustained upward movement. Meanwhile, Ripple (XRP) is approaching a critical threshold; a confirmed breakout could strengthen bullish momentum in the near term.
Bitcoin approaches record highs
The price of Bitcoin surged by 7.32% last week, closing above the $108,000 mark. As of the latest update on Monday, it remains near $108,500.
Should the current upward trend persist, BTC may extend its rally toward the all-time high of $111,980 recorded on May 22. A decisive close above this level could pave the way for further gains, potentially establishing a new all-time high at $120,000."
personal opinion:!!!
BTC buying pressure is prevented by selling pressure according to H4 trendline, accumulating and soon surpassing ATH
Important price zone to consider :!!!
support zone : 107.000 ; 104.600
Sustainable trading to beat the market

BITCOIN - Price can continue grow inside flat to $107933 level#BTC
The price is moving within a descending channel on the 1-hour frame and is expected to break and continue upward.
We have a trend to stabilize above the 100 moving average once again.
We have a downtrend on the RSI indicator that supports the upward move with a breakout.
We have a support area at the lower boundary of the channel at 106500, acting as strong support from which the price can rebound.
We have a major support area in green that pushed the price upward at 106000.
Entry price: 106736
First target: 106996
Second target: 107434
Third target: 107933
To manage risk, don't forget stop loss and capital management.
When you reach the first target, save some profits and then change your stop order to an entry order.
For inquiries, please comment.
Thank you.

BTC 30.06.25So far BTC is behaving exactly as expected, i'm just waiting for a valid setup to appear. I would love to see a model 1, which takes out the high and mitigates supply, but i'm also not ignoring a potential model 2. These 2 deviations merge together on a higher time frame, where the range is also valid on, so they can be counted as one. There are many altcoins with similar behavior and USDT/C in potential accumulation. I'm waiting to see confirmations/ invalidations.
BTCUSDT Analysis – Bullish Focus Amid ConsolidationBTCUSDT Analysis – Bullish Focus Amid Consolidation
Bitcoin is currently mirroring the broader market sentiment, particularly tracking the S&P 500. After a false breakout above the psychological 100K level, BTC entered a distribution phase, followed by a consolidation range. This indicates a potential accumulation before a bullish continuation, although resistance levels remain key hurdles.
False Breakout at 100K: A failed breakout attempt triggered a sharp reversal, signalling short-term weakness. Price rolled back and found temporary support around 106,200, pausing further downside The pair is consolidating within a tight range, indicating a possible setup for a renewed bullish push.
Outlook: Despite the resistance cascade, BTC remains in a bullish structural zone as long as it holds above 106,000. A clean breakout above 108,500–110,000 could open the path back toward 114,000–117,000. However, failure to break may result in a deeper pullback towards 104,000–102,500.
Ps Support with like and comments for more analysis Thanks for supporting.

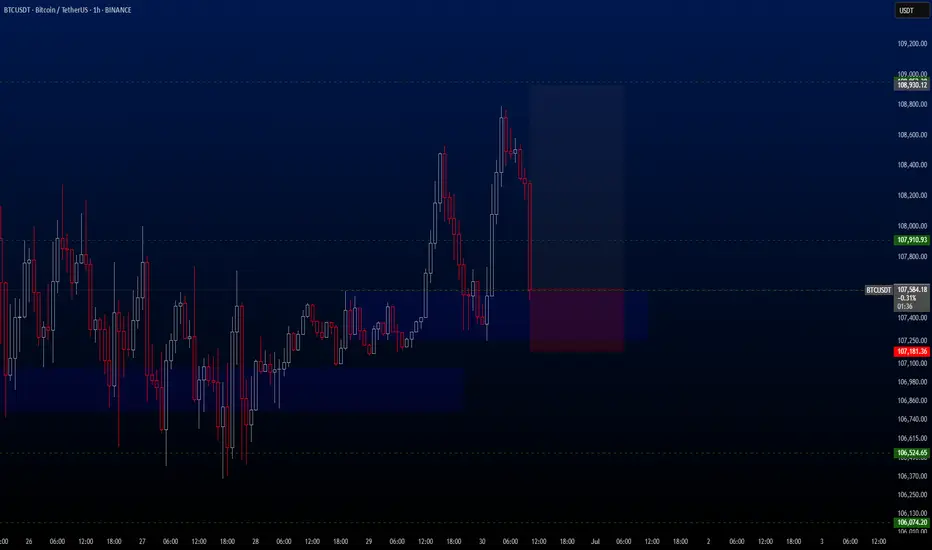
BTCUSDT Hello traders. Wishing you a great start to the week!
This week’s first trade opportunity comes from the BTCUSDT pair. Over the weekend, the pair showed significant volatility, dropping from 108,776 to 107,565 in just a few hours. However, I see this drop as a potential buying opportunity.
In my view, the price is likely to bounce back towards the 108,930.12 level in the short term. Therefore, I’ve activated the trade and I’m sharing the details with you below:
🔍 Trade Details
✔️ Timeframe: 1-Hour (H1)
✔️ Risk-to-Reward Ratio: 1:3.20
✔️ Trade Direction: Buy
✔️ Entry Price: 107,590.73
✔️ Take Profit: 108,930.12
✔️ Stop Loss: 107,181.36
🕒 If momentum weakens or price consolidates in a tight range, I will keep this trade open only until 23:00 (UTC+4). After that, I’ll manually close it—whether in profit or loss—based on how price action evolves.
🔔 Disclaimer: This is not financial advice. I’m simply sharing a trade I’ve taken based on my personal trading system, strictly for educational and illustrative purposes.
📌 Interested in a systematic, data-driven trading approach?
💡 Follow the page and turn on notifications to stay updated on future trade setups and advanced market insights.
Let’s break down what the chart shows for BTCUSDT on the daily Chart key points
Price: Currently around $108,129
Key levels:
There are EQH (equal highs) around $111,500–$112,000 acting as liquidity.
There’s a smaller Daily FVG (Fair Value Gap) between ~$105,500–$107,000.
A larger Daily FVG lower around ~$99,000–$103,000.
Weekly Fibs mark retracement levels below.
Two projected paths: One a break above the EQH liquidity; the other shows a deeper pullback before that.
📈 Scenario 1: Bullish continuation + liquidity sweep
Idea:
BTC pushes up to sweep the EQH liquidity near $111,500–$112,000.
Breaks above, hits stops, and either:
Continues higher to the next resistance zone near $115,000–$118,000.
OR fakes out, sweeps liquidity, and retraces to the Daily FVG.
What to watch:
If price closes strongly above EQH with volume, look for continuation buys.
Confirmation: Break/retest of $111,500 as support.
📉 Scenario 2: Deeper pullback before continuation
Idea:
Price fails to break the EQH cleanly.
Pulls back into the small Daily FVG or deeper into the larger Daily FVG.
Reaccumulates around the $99,000–$104,000 zone.
From there, look for a bullish reaction for a safer long.
What to watch:
Weakness at EQH: Wicks or rejection candles.
Entry triggers: Strong bullish PA in the Daily FVG zones + confirmation.
✅ Key takeaways
Liquidity above EQH means there’s incentive for smart money to run stops.
FVGs are your high-probability reaction zones.
wait for price to trade into imbalance with signs of bullish order flow.

Bitcoin Overall: Likely Short to SupportI think bitcoin will likely find resistance at the current range, or slightly higher, and move down in a stepwise fashion to the indicated supports in the near future.

BTC/USDTSince last November, price action has been ranging above and below a rising wedge which is typically a bearish structure. This has created plenty of market indecision with bears poised to regain control at every dip.
However, the recent pullback didn’t reach the wedge’s support line which is a subtle bullish sign and we’ve now clearly formed an inverse head and shoulders, a classic bullish reversal pattern.
A breakout is on the table with a target at $143K.

BTC/USD Technical Analysis – Weekly Elliott Wave StructureIn this video, we analyze the weekly chart of Bitcoin ( BYBIT:BTCUSDT ) using Elliott Wave theory.
The current structure suggests the beginning of a new bullish impulse (waves 0, 1, and 2) following a clearly completed and technically correct corrective phase.
We explore potential impulsive scenarios starting from wave 2, using Fibonacci extensions to project possible targets and identifying key support zones and invalidation levels.
This analysis aims to provide a macro perspective based on price action, helpful for traders and investors following BTC from a medium- to long-term technical view.
🛑 Disclaimer: This content is for educational and informational purposes only. It does not constitute investment advice. Each user is responsible for their own trading decisions.

BTCUSDT 30min Breakout Retest | Micro Wedge into Macro ConfluencBTC 30m chart shows ascending wedge, followed by a bullish retest of prior resistance (now support ~107.4K). Price now consolidating just under diagonal resistance near 108.8K. EMAs are aligned bullish, volume surged during the breakout, and remains elevated—suggesting further upside potential.
🔄 Higher Timeframe Confluence
4H: Price pressing upper boundary of a rising wedge within a larger symmetrical pattern. Trendline pressure is real—either breakout above $109K or fade to $106.5K–$105K retest.
1D: Third touch on descending trendline from previous swing highs. Momentum building, and candles holding above EMAs. Breakout above $109.2K can trigger a move to $112K–114K (red expansion zone).
1W: Still inside a macro bull flag. Support from the 20 EMA is firm. Weekly close above ~$110K = confirmed flag breakout with target above $120K.
⚠️ Key Levels
Immediate Resistance: 108.8K → 109.2K → 110K
Support Zones: 107.4K → 106K → 104.5K
Bullish Targets: 110.8K → 113.5K → 114.8K
Invalidation (Short Bias Trigger): Break below 106K on volume
📌 Idea Summary
Micro breakout (30m) leading a potential macro breakout (4H/1D/W). Bulls control short-term trend. Eyes on volume follow-through above $109K. Rejection = potential revisit of 106K. Consolidation under resistance = breakout watch.

BTCUSDT 30min Breakout Retest | Micro Wedge into Macro ConfluencBTC 30m chart shows clean ascending wedge, followed by a bullish retest of prior resistance (now support ~107.4K). Price now consolidating just under diagonal resistance near 108.8K. EMAs are aligned bullish, volume surged during the breakout, and remains elevated—suggesting further upside potential.
🔄 Higher Timeframe Confluence
4H: Price pressing upper boundary of a rising wedge within a larger symmetrical pattern. Trendline pressure is real—either breakout above $109K or fade to $106.5K–$105K retest.
1D: Third touch on descending trendline from previous swing highs. Momentum building, and candles holding above EMAs. Breakout above $109.2K can trigger a move to $112K–114K (red expansion zone).
1W: Still inside a macro bull flag. Support from the 20 EMA is firm. Weekly close above ~$110K = confirmed flag breakout with target above $120K.
⚠️ Key Levels
Immediate Resistance: 108.8K → 109.2K → 110K
Support Zones: 107.4K → 106K → 104.5K
Bullish Targets: 110.8K → 113.5K → 114.8K
Invalidation (Short Bias Trigger): Break below 106K on volume
📌 Idea Summary
Micro breakout (30m) leading a potential macro breakout (4H/1D/W). Bulls control short-term trend. Eyes on volume follow-through above $109K. Rejection = potential revisit of 106K. Consolidation under resistance = breakout watch.

BITCOIN WATCH the break and close of 108k level,this will open a buy into 114-113k supply roof and it will be a quick take profit at that level.
if we close below 108k from the channel on 4hr then we are looking at sell into 94-95k 4hr demand floor .
#btc #bitcoin

BITCOINBITCOIN , we need a clear breakout of the channel supply roof ,for next directional bias .
if we break above 108k then we are test 113-118k zone .
but if the reject 108k then 94k-96 will be the next good buy position

BTCUSDT SHORT SIGNAL Setup Type: Liquidity Trap & Distribution
Trade Idea (SHORT):
Entry Zone: $108,000 – $110000
Stop Loss: Above $113000
Take Profit Targets:
TP1: $104,000
TP2: $100,000
TP3: 98000
TP4: 74000
This analysis is for educational purposes only and does not constitute financial advice.
Always do your own research and apply proper risk management.
Trading involves risk, and you are solely responsible for your decisions.
Use this information as a guide — not a guaranteed outcome.
Wait for clear confirmation before executing any trade.

Bitcoin Weekly & $120,000This weekly Bitcoin chart says it all... Please, allow me to reveal to you what the future holds!
Good evening my fellow Cryptocurrency trader, what a wonderful day.
Only one week ever produced a higher close than the current price. Only once, 19-May, Bitcoin managed to close above $107,000... What happens if Bitcoin closes above $107,000? New all-time high confirmed.
Two days remain for the week to close and we—the bulls—only need to maintain a price of $107,000 or higher to send such a strong bullish signal that everybody will come out and start buying.
The next target on this timeframe is $120,000.
Bitcoin is using EMA13 as support. This level was tested and holds, the same for EMA8. When Bitcoin moved above these levels in April, it produced an advance from $83,000 to $112,000, more than 33%. The price now is $107,000 but instead of recovering from below EMA8/13, BTCUSDT is trading above; this means that the bullish bias is fully confirmed.
The weekly timeframe looks great. We can expect higher prices soon, with growth happening for an extended period of time. Bitcoin is very strong now and this is only the start.
I will continue to share proof that shows the entire Cryptocurrency market going up.
Thank you for reading.
Leave a comment with your questions.
Thanks a lot for your support.
Namaste.

Analyzing the new month, new week, new day
Hello, traders.
If you "follow", you can always get the latest information quickly.
Have a nice day today.
-------------------------------------
(BTCUSDT 1M chart)
A new month begins in one day.
The key is whether it can hold the price by rising above 109588.0.
If not, there is a possibility that it will fall below the 94172.00 StochRSI 50 indicator point that the arrow is pointing to.
We need to see if it can rise with support near the Fibonacci ratio of 1.618 (89050.0).
Since the current low-point trend line is not complete, it is not surprising that it can show a downward trend at any time.
However, if it rises above 109588.0 and maintains the price, it is expected that there will be an attempt to rise near the Fibonacci ratio of 2.618 (133889.92).
I think it is likely to be the last target of the target bull market in 2025.
-
(1W chart)
It is a period of volatility around the week including June 23.
That is, from June 16 to July 6 is the volatility period.
The key is whether it can rise to the right Fibonacci ratio 2.24 (116940.43) during this volatility period.
Even if it fails to rise, if the price maintains above 104463.99, it is expected to show an upward trend around the next volatility period.
The next volatility period on the 1W chart is expected to be around the week of August 18.
-
When it falls below 104463.99, we need to check whether the HA-High indicator is newly generated.
If not, it is important to check whether there is support around the current HA-High indicator point of 99705.62.
Since the M-Signal indicator on the 1W chart is passing around 99705.62, its importance can be said to be high.
If it falls below the M-Signal indicator of the 1W chart, it is expected to determine the trend again when it meets the M-Signal indicator of the 1M chart.
-
(1D chart)
The key is whether it can maintain the price by rising above the HA-High indicator point of 108316.90 on the 1D chart.
If it fails to rise,
1st: 104463.99
2nd: 99705.62
You should check for support near the 1st and 2nd above.
If it falls below the M-Signal indicator of the 1W chart,
1st: 89294.25
2nd: M-Signal of the 1M chart
There is a possibility that it will fall near the 1st and 2nd above.
-----------------------------------------
(1W chart)
The chart above is a trend line chart drawn on the 1W chart.
It looks complicated, but what's important to look at is the correlation between the high-point trend line and the low-point trend line.
That is, even if the price rises above 109.588.0, if it doesn't rise above the high-point trend line, it is likely to fall near the low-point trend line.
Fortunately, since it is forming an upward channel, it is expected that the price will eventually rise even if it falls.
-
(1D chart)
Unlike the trend line on the 1W chart, the high-point trend line on the 1D chart forms a downward trend line.
Accordingly, the period around July 7, when the low-point trend line and the high-point trend line intersect, can be considered an important period of volatility.
However, the volatility period starts around July 2nd and is expected to end around July 10th.
----------------------------------------------
As shown above, many lines were drawn to analyze the chart.
I have roughly explained which of the lines drawn in this way should be prioritized.
Since chart analysis is for creating a trading strategy, the support and resistance points drawn on the 1M, 1W, and 1D charts are ultimately the most important.
Therefore, it is most important to check how the support and resistance points were created and find the reason for them.
Other analyses are only additional elements.
As I always say, chart analysis that does not show support and resistance points is only an analysis chart that can be used for trading.
You cannot trade with such analysis charts.
Also, if support and resistance points are shown, you should check the basis for setting the support and resistance points.
In order to serve as a support and resistance point, there must be a basis.
When you cannot confirm the basis for the support and resistance point, it is important to ask questions and find out the basis.
Fibonacci ratios are not suitable for actual trading.
However, when the ATH or ATL is updated, it is valuable enough for analysis.
Other than that, there must be support and resistance points drawn on the 1M, 1W, and 1D charts.
-
Thank you for reading to the end.
I hope you have a successful trade.
--------------------------------------------------
- This is an explanation of the big picture.
(3-year bull market, 1-year bear market pattern)
I will explain more details when the bear market starts.
------------------------------------------------------

BTC/USDT high win scalping signals in 15 minutes are as follows- Signal: SHORT
- Admission: 107,480 ~ 107,620
- Take Profit: 107,100, 106,860


Trading the Impulse Rally Retracement — Price and Time Symmetry The Stop Loss Triangle is back!
This time with BITSTAMP:BTCUSD coming off its recent impulse rally. For those of you that aren’t familiar with my strategy — let me start from the beginning…
This concept involves positioning against the opposing decline in price and time as a precursor to our theoretical projection. If the underlying enters our predetermined faded cross-section, the stop loss is triggered to prevent sideways consolidation and the erosion of contract premiums or leverage decay.
This inherently ‘sclene’ triangle is constructed by drawing a straight trend line through the bottoming reversal candle and the furthest projection in price and time symmetry (78.6%) of the retracement. Once connected, draw a vertically positioned straight line from the highest or lowest point in the previously identified retracement to the bottom reversal candle area once again. To create a ‘right triangle’, now turn 90 degrees towards the final point, which is determined by the nearest projection in price and time symmetry (38.2%). This allows time after the imposed price and time date, yet not enough for premium or leverage decay to become significant.
In its entirety, this forms the stop loss triangle.
I encourage my followers to identify and explore the system on their own. As always, feel free to ask me anything related to it. We’ll follow along and you’ll be amazed at the precision of Fibonacci symmetry.
CHEERS

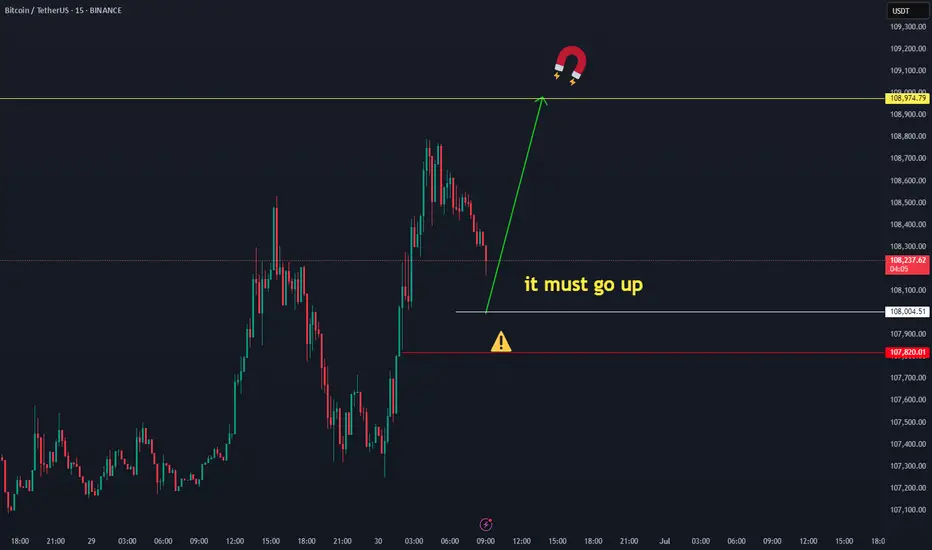
BTC/USDT – Intraday Plan (15m, Ichimoku) by RiscoraToday’s idea:
I’m expecting a retracement to the 107,867 level as a pullback to the recent impulse. The move we observed earlier aligns with my prediction from last Friday — liquidity was taken out above the highs, and now I anticipate a deeper correction against the overall bullish move.
My main scenario for the day is a move down into the 106,400 area at minimum, targeting the liquidity below.
Ideally, I’d like to see a push to 107,870 first, as that would provide the best entry for a short setup. I’m willing to open a short in that scenario, but it’s important to remember the higher timeframe trend remains bullish, so any short should be approached with caution.
Key levels:
Retracement target: 107,867
Main downside target: 106,400
Cautious shorting only — trend still bullish overall
Let’s see how the price develops. Will update if conditions change.
#BTC #Crypto #Trading #Ichimoku #Riscora
