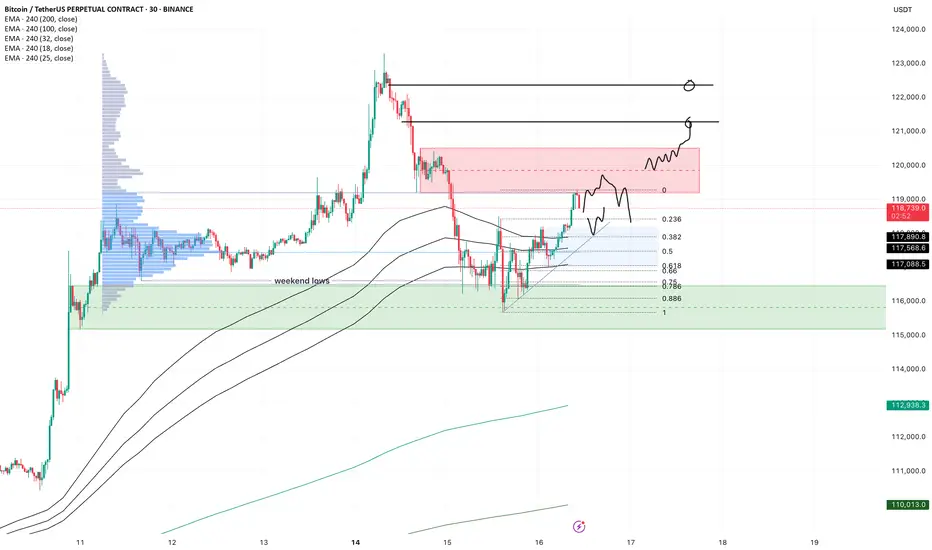
BTC - intradayA lot of volatility, which is nice for trading either way.
The high we set on Monday morning gave a very strong rejection, but in the end we simply took out the weekend lows, then reclaimed and are now grinding higher into the imbalance we left.
Price is now coming into the first resistance, so we watch for either a reversal or see if price keeps grinding through this orderblock, in which case we expect the higher imbalance also to get taken out.
If that happens, I expect a lower high which creates bad highs, then into some ranging price action before we sweep the highs again. (a range trader can dream, rigth?)
For today, look for pullbacks into the blue zone. If the slow grind trend is strong, somewhere between the 0.618 and 0.382 is where I'd expect a reaction if we flush a bit at nyo. We have confluence with H4 trend, trendline, fibs and range poc here.
For now all the m1 lows are holding on low timeframe, I wouldn't get overly bearish or even looking for hedges before that breaks.
If price rejects here and loses the poc, look for a sweep of the lows first. There is a lot of OI build up and I expect some longs to be flushed, but that's no excuse to get bearish at the lows before they break. Just like yesterday, price reclaimed the low immediately, that was your moment to long.
BTCUST trade ideas
BTC 141000Hello friends
I think Bitcoin has another correction to 113662 and then it will climb to 141000.

Bitcoin breaks through $120,000Bitcoin breaks through $120,000: long opportunities under the resonance of fundamentals and technical aspects
I. Fundamentals: Multiple positive factors drive the bull market
Institutional funds continue to pour in
The net inflow of US spot Bitcoin ETFs reached US$2.7 billion in a single week (a single-week record in 2025), and BlackRock IBIT's management scale is close to US$100 billion410.
Listed companies (such as MicroStrategy) continue to increase their holdings, with a total holding of more than 850,000 BTC, worth nearly US$100 billion6.
Policy easing expectations strengthen
The US "Cryptocurrency Week" deliberates on three key bills (the "GENIUS Act" and the "Clarity Act", etc.). If passed, it will clarify the regulatory framework and eliminate market uncertainty210.
The Trump administration promotes crypto-friendly policies, including the "National Strategic Cryptocurrency Reserve" plan, to boost market confidence69.
Macroeconomic environment support
Expectations of Fed rate cuts are rising, funds are flowing into risky assets at an accelerated pace, and Bitcoin's safe-haven properties as "digital gold" are strengthened13.
2. Technical aspects: Breaking through key resistance, upward space opens
Key breakthrough confirmed
Bitcoin breaks through the $120,000 mark, completely gets rid of the $90,000-110,000 oscillation range, and forms a daily level "ascending triangle" breaking through 210.
RSI (daily) is in the healthy range of 60-70, no overbought signal appears, MACD golden cross continues, showing strong upward momentum 69.
Support and target
Short-term support: $118,000 (previous high conversion support), if it falls below, look at $112,000 (20-day moving average).
Upward target:
Short-term: $135,000-140,000 (Fibonacci extension level + institutional bullish consensus) 910.
Medium- to long-term: $200,000 (forecast by Standard Chartered Bank, Bitwise and other institutions) 48.
Derivatives signal
Short positions intensify the rise: $740 million of short orders were liquidated within 24 hours, forming a "short squeeze" positive feedback 26.
The options market is piled with bullish bets, and the open interest of $150,000 call options expiring in December has surged by 10.
Long-term ideas, entry strategies
Positions can be opened in batches at the current price (around $120,000), with a stop loss set at $115,000 (key psychological support).
If it stabilizes in the range of $118,000-115,000, you can increase your position.
Target and risk control
First target: $135,000 (technical resistance + institutional consensus).
Second target: $150,000 (trend continuation + policy catalysis).
Be wary of short-term fluctuations: If it falls below $115,000, the trend needs to be re-evaluated.
Configuration suggestions
Main position is Bitcoin, and auxiliary position is Ethereum (ETH breaks through $3,000, with great potential for catch-up) 10.
Avoid high leverage, and pay attention to the volatility that may be caused by the implementation of US regulatory details in August 18.
Conclusion: Bitcoin is driven by policy, capital, and technology, and the bull market pattern is clear. There may be short-term fluctuations, but the trend has not changed, and buying on dips remains the main strategy.
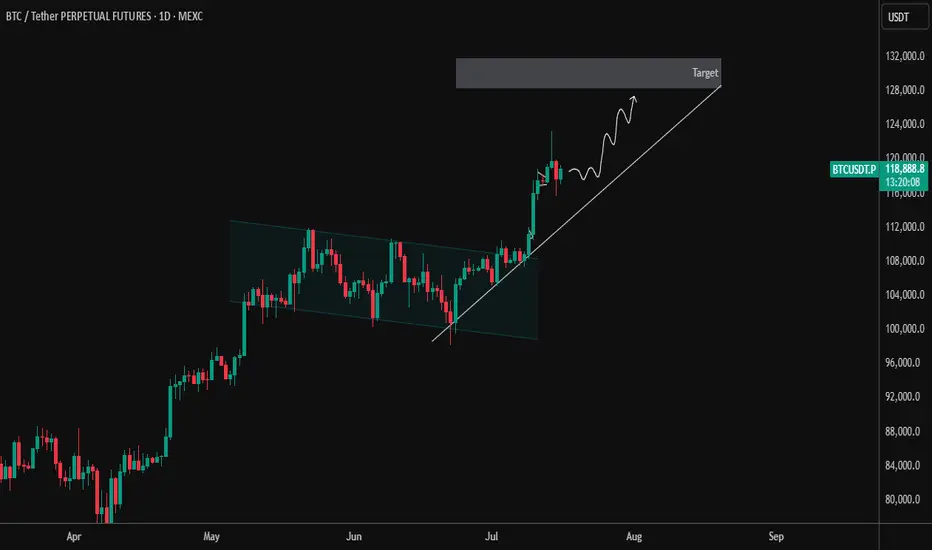
BTCUSDT 1 Day – Breakout and Retest Completed | Next TargetBTC has officially broken out of the descending parallel channel that dominated price action from mid-May to early July. After a successful breakout, price pulled back for a clean retest of the channel resistance, which has now flipped to support — a classic bullish continuation signal.
🔹 Key Technical Highlights:
✅ Breakout from descending channel structure
✅ Retest of breakout zone confirmed with strong bullish candles
🔼 Current Price: ~$118,971 (as of chart time)
📈 Short-Term Structure: Following a clean higher-low formation with ascending trendline support
🎯 Target Zone: $128,000–$130,000 (next key resistance area)
As long as BTC maintains this ascending support line, the momentum remains with the bulls. Any dips toward the trendline may offer good long opportunities with proper risk management.
📌 Watch for:
Rejection near the target zone
Bullish continuation patterns like flag/pennant on lower timeframes
Volume confirmation during breakout attempts
Let the trend be your friend. Trade safe! ⚡
BTC AI Prediction Dashboard - 6h Price Path (16.07.25)
BTCUSDT Forecast:
Crypticorn AI Prediction Dashboard Projects 6h Price Path (Forward-Only)
Forecast timestamp: ~10:15 UTC
Timeframe: 15m
Prediction horizon: 6 hours
Model output:
Central estimate (blue line): -119,635
Represents the AI’s best estimate of BTC’s near-term price direction.
80% confidence band (light blue): 119,101 – 119,820
The light blue zone marks the 80% confidence range — the most likely area for price to close
40% confidence band (dark blue): 118,473 – 120,801
The dark blue zone shows the narrower 40% confidence range, where price is expected to stay with higher concentration
Volume on signal bar: 153.73
This chart shows a short-term Bitcoin price forecast using AI-generated confidence zones.
Candlesticks reflect actual BTC/USDT price action in 15-minute intervals.
This helps visualize expected volatility and potential price zones in the short term.

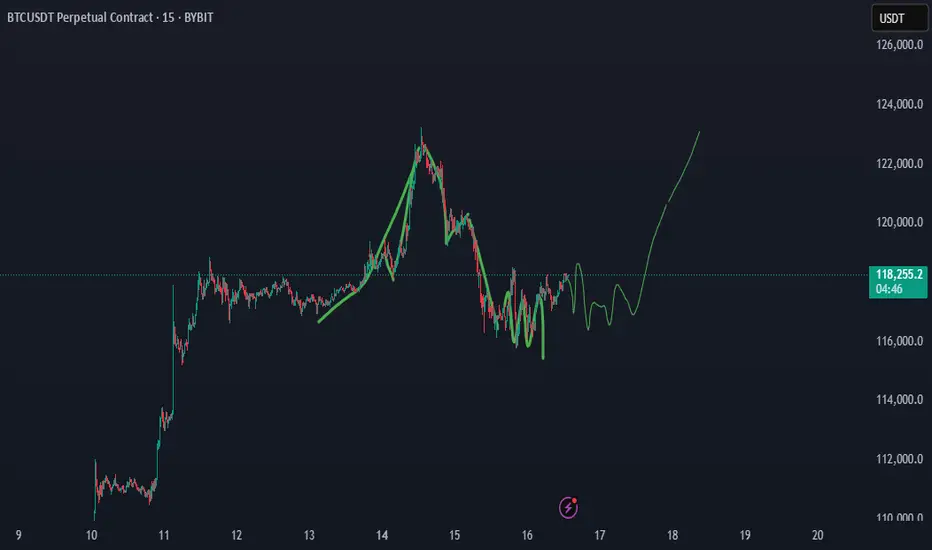
Bitcoin (BTC): Ready For $120K | Maybe Even $140K? Buyers are back in control; after a decent correction we had since forming a new ATH, the price has fallen 8K, which is more than enough.
We see the buyside dominance near the neckline area and now we are seeing more and more bullish volume coming in, which indicates just one thing—we are heading for a retest of the local ATH (and we even might break it).
Swallow Academy

BTC/USDT, 1H chart, Futures - Bearish projection.the price looking for high areas without time in the SQZ minitor or strength, I hope that during the morning today it will fall and begin its journey to low areas between $115,500 and $114,500.

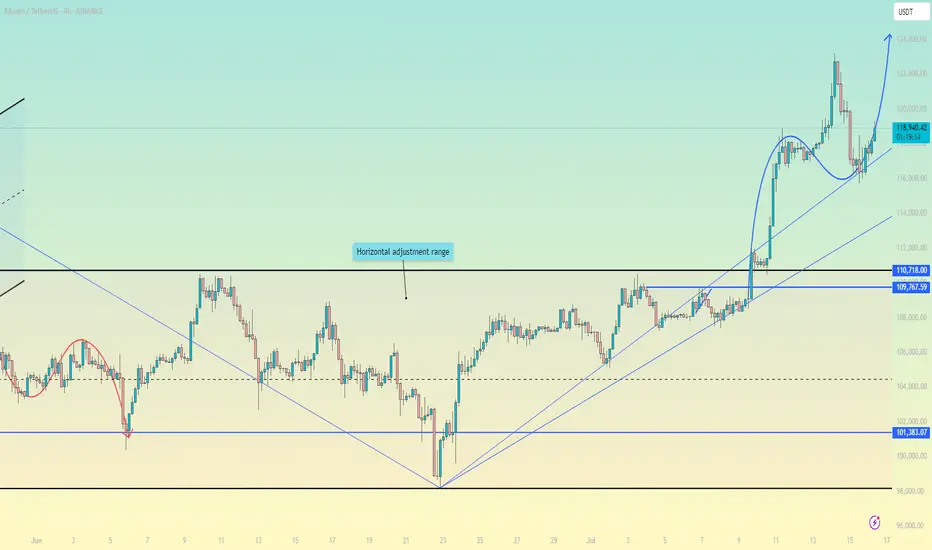
Bitcoin to 128kThere is a strong support between 113k to 115k for Bitcoin, as you see that is the 61% of the Fibonacci, and it is just the start for the rally.

Where Is BTC Headed in the Next 7 Days?As Bitcoin (BTC) continues to dominate headlines, investors and traders are eager to understand its next move. With a current price of around $117,465 and a recent all-time high (ATH) of $122,980 on July 14, 2025, the cryptocurrency market is buzzing with excitement. Drawing from real-time data on social media platforms like X, web sources, and technical analysis, this article explores Bitcoin’s potential market direction over the next seven days, blending fundamental and sentiment insights for a comprehensive outlook. Whether you're a seasoned trader or a curious HODLer, here’s what you need to know about Bitcoin’s short-term trajectory.
Bitcoin’s Current Market Landscape
Bitcoin boasts a market capitalization of $2.34 trillion and a 24-hour trading volume of $88.63 billion as of July 16, 2025. Its market dominance stands at 62.92%, though it dipped slightly by 0.54% recently, hinting at competition from altcoins. The market is driven by strong fundamentals, including institutional adoption and supply constraints, but short-term volatility looms as traders monitor key price levels. Let’s break down the factors shaping Bitcoin’s path and forecast its movement through July 23, 2025.
Fundamental Factors Driving Bitcoin’s Momentum
Over 265 companies hold Bitcoin, with portfolios valued in the billions. Spot Bitcoin exchange-traded funds (ETFs) recorded $1.69 billion in inflows this week, reflecting strong institutional confidence in Bitcoin as a store of value.
The April 2024 halving reduced miner rewards, tightening supply—a pattern that has historically fueled bullish cycles. Analysts predict sustained upward pressure as demand grows against a constrained supply.
Bitcoin’s correlation with risk assets like the S&P 500 (0.73–0.90 in Q2 2025) underscores its role as a hedge against inflation and geopolitical uncertainty, amplified by recent U.S. policy shifts favoring crypto.
Over 95% of Bitcoin addresses are in profit, and declining exchange reserves suggest long-term holders are confident in higher prices, reducing available supply.
However, risks like profit-taking after the recent high and macroeconomic uncertainties, such as trade tensions, could introduce short-term fluctuations. These fundamentals set the stage for Bitcoin’s next moves.
Sentiment Analysis. Gauging the Market’s Mood
Market sentiment, gathered from online discussions and news, leans bullish with some cautionary undertones.
Recent analysis indicates that bearish sentiment often signals market bottoms, suggesting a potential bullish reversal. Whale accumulation amid retail uncertainty further supports optimism. Bitcoin’s sentiment score averages 82/100, with 45.49% bullish, 11.49% bearish, and 54.51% neutral commentary, reflecting high engagement.
Institutional enthusiasm, ETF inflows, and pro-crypto policy developments drive positive sentiment, particularly in the U.S. and Europe. However, concerns about price manipulation—evidenced by a +1,550% surge in related online searches—and potential profit-taking temper short-term optimism.
High trading activity during European hours (08:00–17:00 GMT) often extends Asian session trends, while weekends see increased volatility due to lower institutional participation.
The overall sentiment is bullish, with short-term bearish signals potentially creating buying opportunities for savvy investors.
Technical Analysis
Technical analysis across 15-minute (15m), 1-hour (H1), and 4-hour (H4) time frames offers insights into Bitcoin’s short-term behavior
15m and H1 Time Frames: Recent chart patterns show a rejection below $117,800, indicating a short-term bearish structure. Support lies at $115,000–$116,600, with resistance at $117,800–$118,000. Indicators like the Relative Strength Index (RSI at 68) and MACD suggest neutral momentum, with a bearish bias if Bitcoin remains below $118,000. A break below $115,000 could push prices toward $109,000–$110,000.
H4 Time Frame: The market is consolidating, with the 9-period Exponential Moving Average (EMA) catching up to price. The long-term trend remains bullish, supported by rising 50-day and 200-day moving averages. Overall, technical indicators rate Bitcoin as a “Buy,” with 13 Buy signals from moving averages and neutral oscillators, pointing to a potential retest of $120,000–$123,000 if support holds.
The charts suggest a bullish long-term trend with short-term consolidation, making support levels critical for traders.
Bitcoin Price Forecast for Next 7 Days
Synthesizing fundamental strength, sentiment trends, and technical signals, here’s Bitcoin’s likely direction by July 23, 2025
Bullish Scenario: If Bitcoin holds above the $115,000–$116,000 support zone, it could rally to $120,000–$123,000, fueled by institutional demand, ETF inflows, and positive sentiment. Rising moving averages and a bullish H4 trend support this, with analysts eyeing even higher long-term targets. A breakout above $118,000 could trigger a push toward the recent high or beyond.
Bearish Scenario: Short-term bearish signals on 15m and H1 time frames, combined with profit-taking risks, suggest a potential dip to $115,000–$116,000. A break below could target $109,000–$110,000, particularly if macroeconomic concerns or altcoin competition intensify.
Bitcoin may test $115,000–$116,000 in the next few days due to short-term bearish pressures, but strong fundamentals and bullish sentiment make a rebound to $120,000–$123,000 likely by July 23, 2025. Any pullback should be viewed as a buying opportunity, given the robust institutional and on-chain metrics.
Key Levels to Watch
Support: $115,000–$116,600 (short-term), $109,000–$110,000 (secondary)
Resistance: $117,800–$118,000 (immediate), $120,000–$123,000 (next target)
Catalysts: Keep an eye on ETF flows, macroeconomic developments (e.g., inflation, trade policies), and online sentiment for potential market shifts.
Bitcoin’s market is in a dynamic phase, balancing short-term volatility with a strong bullish foundation. Traders should monitor the $115,000–$116,000 support zone for signs of a bounce or further correction, while long-term investors can take comfort in the robust fundamentals driving Bitcoin’s growth. The next seven days could see BTC testing $120,000–$123,000 if key levels hold, though a brief dip is possible. Stay informed on market developments and be ready to seize opportunities in this exciting crypto landscape.
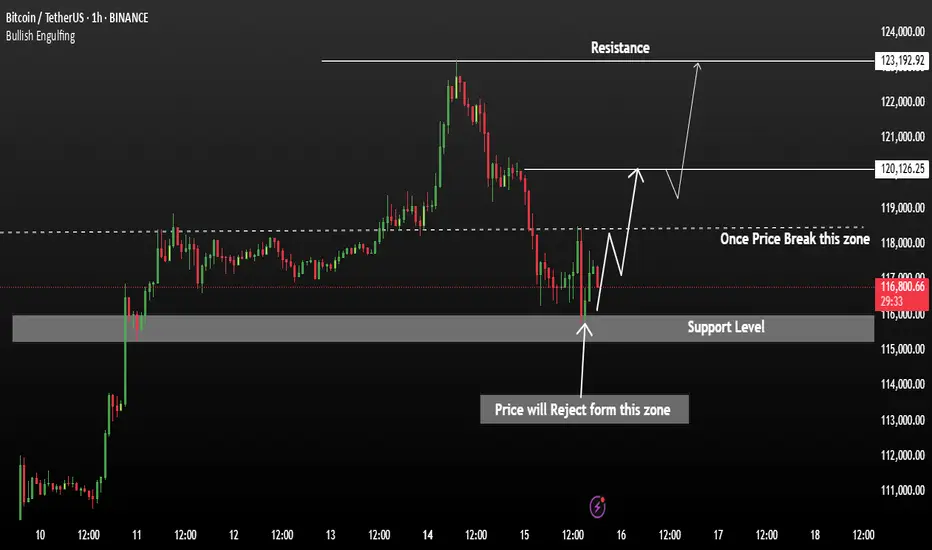
Bitcoin Price in Clear Bullish TrendBTCUSDT has formed a strong support zone around 115,500, where the price recently faced rejection, signalling potential bullish momentum. This zone is acting as a solid base, and any sustained move above the current levels could trigger an aggressive upward move.
Breakout Confirmation: A 1H candle close above 118,500 would confirm bullish continuation Upside Targets: 120,150 and 123,200,
A successful breakout above 118,500 could open the path toward 120K investor needs to monitor our chart.
PS:: Support with like and comments for more better analysis Thanks.
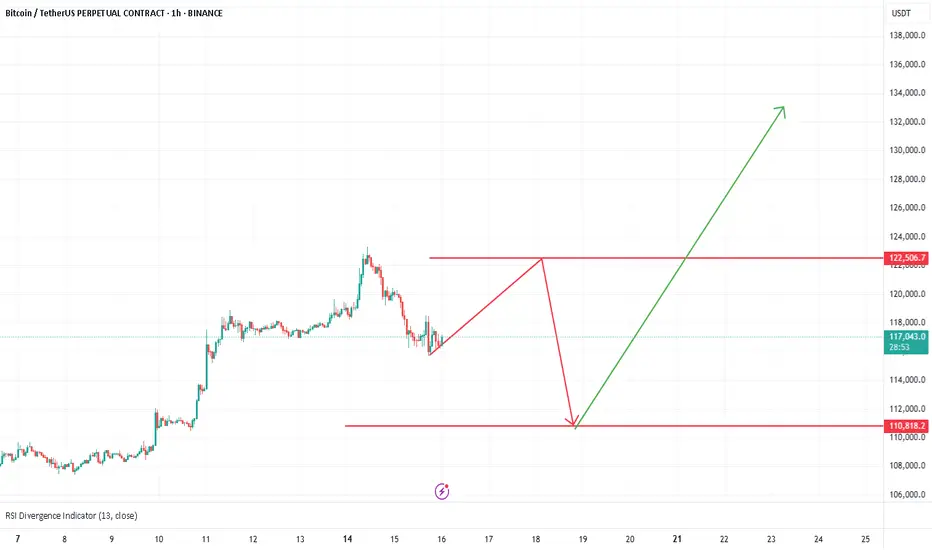
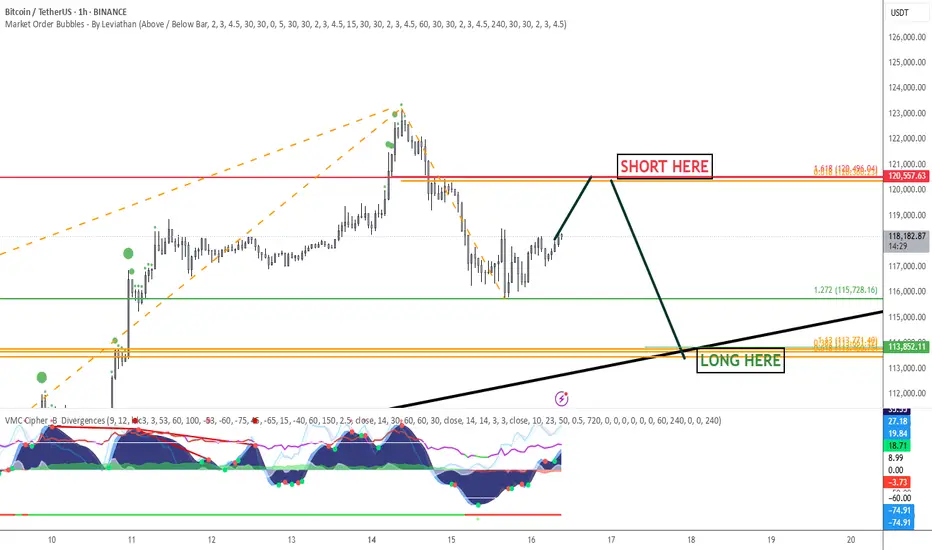
Bitcoin playbookSetup simple AF.
Everything is on the chart. First a small bounce into resistance 120 550 $, followed by a continuation to the downside, to the support level at 113 850 $ (to complete a classic ABC corrective structure)
HF & GL
Phemex Analysis #97: What's Next for Bitcoin, After $123k?!Bitcoin ( PHEMEX:BTCUSDT.P ) recently made history by hitting an all-time high of $123,251 on July 14, 2025. However, enthusiasm was quickly tempered as BTC retraced by approximately 6%, dropping sharply to around $115,696 on July 15. Currently, the price has partially recovered and is trading at about $118,200.
With the market sentiment at a pivotal juncture following this volatile movement, traders and investors are carefully considering their next steps. Let's dive into several possible scenarios that might unfold in the coming days.
Possible Scenarios
1. Bullish Continuation (Breakout Above $123k)
If Bitcoin quickly regains bullish momentum, it may retest and surpass its recent high at $123,251. Breaking decisively above this resistance could trigger another strong rally, driven by renewed market optimism and potential institutional inflows.
Pro Tips:
Entry Strategy: Look to open or add to existing positions upon confirmation of a clear breakout above $123,251, especially if accompanied by high trading volume.
Profit Targets: Key resistance zones for profit-taking after a breakout include psychological levels at $128,000, and the significant milestone at $130,000.
Risk Management: Use protective stop-loss orders placed below the recent low around $115,000 to manage downside risks effectively.
2. Extended Consolidation (Range-Bound Scenario)
Bitcoin could enter a period of price consolidation, fluctuating between support at approximately $115,000 and resistance near $123,000. This scenario often occurs when the market awaits clearer directional cues.
Pro Tips:
Range Trading: Employ a grid-trading strategy, placing buy orders near support ($115,000–$116,000) and sell orders around resistance ($122,000–$123,000) to maximize profits from short-term volatility.
Monitoring Indicators: Keep an eye on declining trading volume, which often signals the potential for an upcoming breakout or breakdown.
3. Bearish Pullback (Correction Scenario)
Given the rapid recent surge to all-time highs, a deeper market correction remains possible. If BTC decisively breaks below support at $115,000 with strong selling pressure, further declines towards $107,218 or even $98,132 could ensue, especially if accompanied by negative broader market sentiment.
Pro Tips:
Short Opportunities: Experienced traders might explore short positions if BTC convincingly breaks below the $115,000 support level.
Accumulation Strategy: Long-term investors can strategically accumulate positions around significant lower support levels such as $107,218 and $98,132, provided price stabilization signals are evident.
Conclusion
Bitcoin is currently at a crucial technical and psychological level after hitting its latest all-time high. Traders should closely monitor the outlined scenarios—particularly watching key resistance at $123,251 and essential support at $115,000. By utilizing disciplined risk management, proactive profit-taking strategies, and careful market analysis, investors can effectively navigate BTC’s ongoing volatility and strategically position themselves for the next significant move.
🔥 Tips:
Armed Your Trading Arsenal with advanced tools like multiple watchlists, basket orders, and real-time strategy adjustments at Phemex. Our USDT-based scaled orders give you precise control over your risk, while iceberg orders provide stealthy execution.
Disclaimer: This is NOT financial or investment advice. Please conduct your own research (DYOR). Phemex is not responsible, directly or indirectly, for any damage or loss incurred or claimed to be caused by or in association with the use of or reliance on any content, goods, or services mentioned in this article.
BTCUSDTI expect a bottom to hit 110,000, then another peak. Then to around 130,000. The triple-drive will be complete and I expect a big drop.

Volume Spread Analysis (VSA) reflects increasing selling!🚨 Bitcoin Market Update 🚨
Bitcoin recently hit an All-Time High (ATH) but is now experiencing a downward correction. Multiple technical indicators suggest continued bearish momentum:
📉 Volume Spread Analysis (VSA) reflects increasing selling pressure.
📊 A bearish engulfing pattern confirms the market is trending lower.
📕 The synthetic order book reveals a heavy concentration of sell orders.
📈 The 50 & 100 SMA are acting as strong resistance levels, keeping price action suppressed below them.
🔍 Key Watch Level: If BTC breaks above the 50 SMA, we could see a potential pump. However, as of now, all confirmations point toward a bearish continuation.
💡 DYOR – Do Your Own Research
🛑 Not Financial Advice

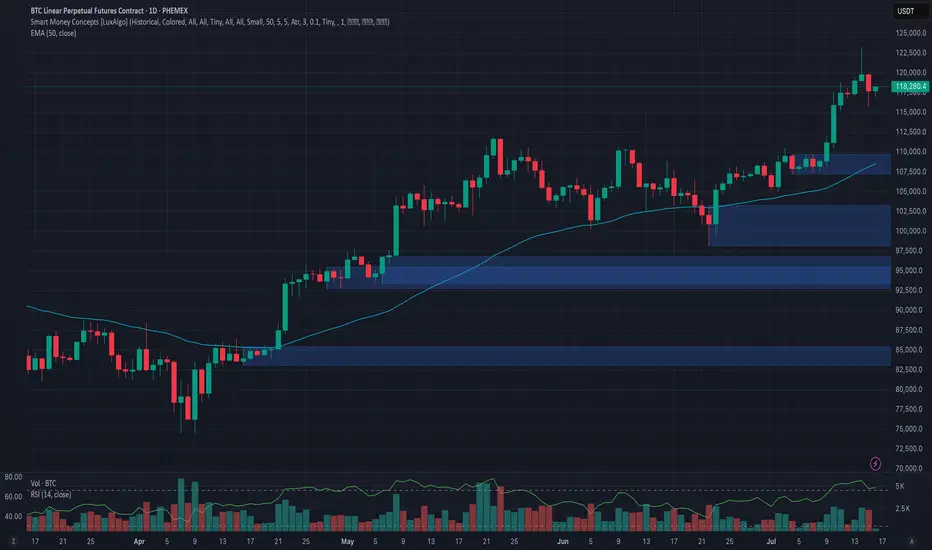
Bitcoin Analysis – 2W Timeframe
📌 As long as price holds above $113K, the trend remains bullish.
🎯 Next targets:
• T1: $151,635
• T2: $175,596
🔍 Any pullback toward $113K is a buying opportunity in a strong uptrend.

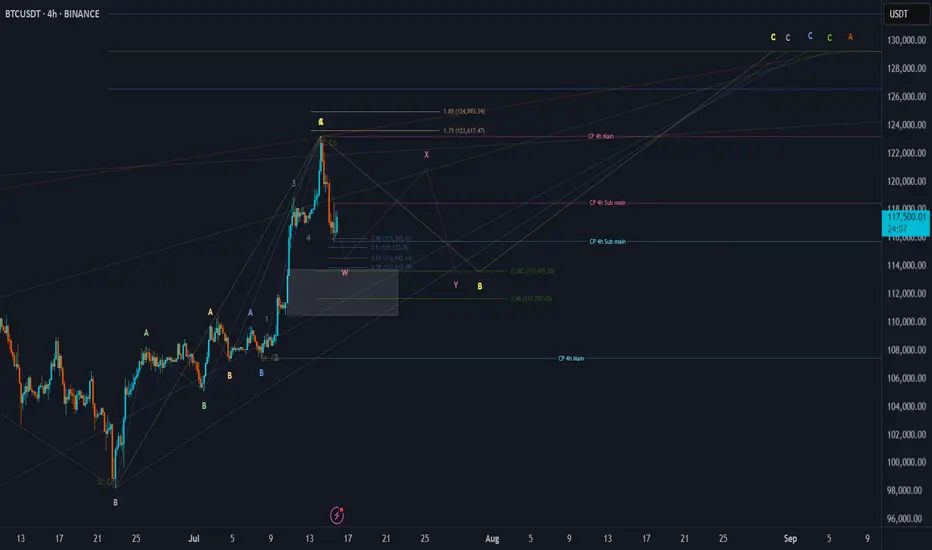
BTC Price Prediction and Elliott Wave AnalysisHello friends,
>> Thank you for joining me in my analysis. I think we have started the Yellow wave B as a micro correction. In my opinion, we will watch three waves wxy as in pink color, or it will extend to be an Irregular flat pattern where x will cross 123250
>> Till now, I am waiting to cross 118500 and stay above it after crossing for double the same time frame (my strategy).
keep like and support me to continue, See you soon!
Thanks, Bros
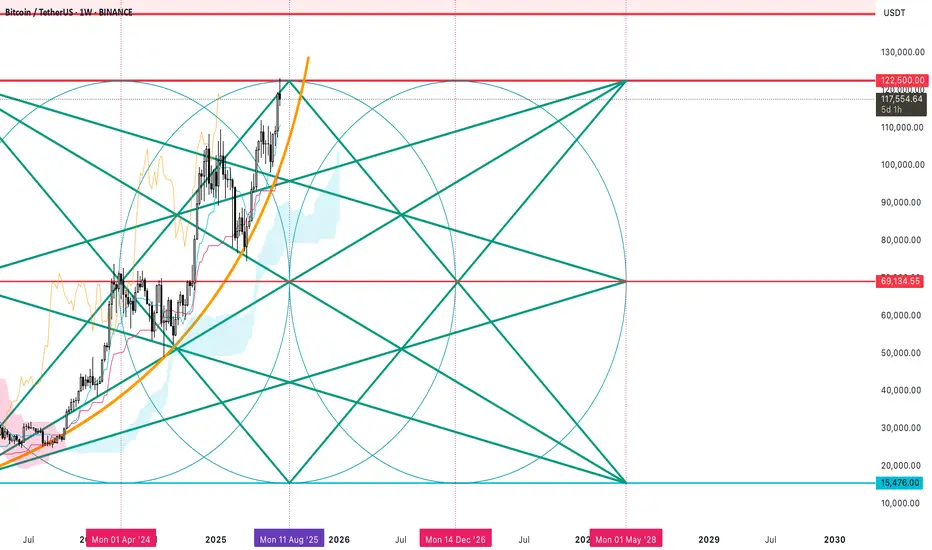
Bitcoin Geometry x IKAGI 2025 - 2028 (Solar Peak)Harmonic angles, and geometry in price and time for Bitcoin.
$122K (Major Level for the system). Potential top
Bitcoin Next Breakout Pump?So far the $117k support seem to have held which is good news for the bulls. Now we should anticipate a reclaim of the $120Ks; this should form a pretty good double bottom for CRYPTOCAP:BTC to surge to $130Ks and more, of course.
BITCOIN PULLBACK 110.000🔹 The uptrend remains intact
After setting a new high, the price may enter a mild correction toward the $110K zone.
Key support levels in this uptrend are:
✅ $115K
✅ $110K
✅ $105K
As long as the price holds above $105K, any pullback is considered healthy and the uptrend is likely to continue.
📊 A shallow correction is part of a healthy market structure.

Support and resistance zones: 115854.56-116868.0
Hello, traders.
Please "Follow" to get the latest information quickly.
Have a nice day today.
-------------------------------------
(BTCUSDT 1D chart)
This decline created a new trend line.
This added a period of volatility around July 31st.
If the HA-High indicator is generated at the 115854.56 point, the key is whether it can be supported and rise around that point.
If it falls below the HA-High indicator, there is a possibility of a downward trend.
Therefore, it is necessary to look at which support and resistance points the price is maintained at as it passes the volatility period around July 18 (July 17-19).
-
Since the StochRSI 80 indicator is formed at the 116868.0 point, it is important to be able to maintain the price above 116868.0 if possible.
Therefore, assuming that the HA-High indicator will be generated at the 115854.56 point, the key is whether there is support around 115854.56-116868.0.
Next, since the M-Signal indicator on the 1D chart is rising above 116696.20, we need to check if it is supported by the M-Signal indicator on the 1D chart or around 116696.21.
-
So far, we have talked about how to maintain an upward trend by breaking through a certain point or section.
That is,
- The K of the StochRSI indicator should be below the overbought section and should show an upward trend with K > D.
- The PVT-MACD oscillator indicator should show an upward trend. (If possible, it should be above the 0 point.)
- The OBV indicator of the Low Line ~ High Line channel should show an upward trend. (If possible, it should be maintained by rising above the High Line.)
I said that when the above conditions are met, there is a high possibility that the upward trend will continue.
On the other hand, in order to change to a downward trend,
- The DOM (60) indicator should be created and show resistance near the DOM (60) indicator.
- When the HA-High indicator is generated, it should show resistance near the HA-High indicator.
- When the K of the StochRSI indicator falls from the overbought zone, it should switch to a state where K < D and show a downward trend. (However, caution is required as volatility may occur when K reaches around the 50 point.)
- The PVT-MACD oscillator indicator should show a downward trend. (If possible, it is better if it is located below the 0 point.)
- The OBV indicator of the Low Line ~ High Line channel should show a downward trend. (However, it should show a downward trend in the state where OBV < OBV EMA is present.)
When the above conditions are satisfied, there is a high possibility of a downward trend.
Among these, the most intuitive thing to know is whether the DOM (60) indicator and the HA-High indicator are generated.
This is because, in order to first switch to a downward trend, a signal that the current price position is a high point must appear.
The DOM(60) indicator is an indicator that indicates the end of the high point.
Therefore, if the DOM(60) indicator is generated, it is likely to be a high point.
However, since it can be supported and rise near the HA-High indicator, you should check whether there is support in the HA-High ~ DOM(60) section and respond accordingly.
The HA-High indicator is an indicator created for trading on the Heikin-Ashi chart, and if it falls below the HA-High indicator, it is likely to be a point where a downtrend will begin.
-
Since the same principle applies to any time frame chart you trade, it is easier to understand the chart and determine the timing of the start and end of the transaction.
However, the basic trading method must be a split trading method.
The reason is that if it rises in the HA-High ~ DOM(60) section, it is likely to show a stepwise upward trend, and if it falls in the DOM(-60) ~ HA-Low section, it is likely to show a stepwise downward trend.
This basic trading method, that is, buying near the HA-Low indicator and selling near the HA-High indicator, will eventually make you familiar with day trading, which will have an effective influence on finding a buying point when making mid- to long-term investments.
It is wrong to say that you are good at mid- to long-term investments when you are not good at day trading.
You were just lucky.
Unfortunately, this kind of luck cannot last.
-
Thank you for reading to the end.
I hope you have a successful transaction.
--------------------------------------------------
- This is an explanation of the big picture.
(3-year bull market, 1-year bear market pattern)
I will explain more details when the bear market starts.
------------------------------------------------------

More up📈 Trading Tip – Long Position on Bitcoin (BTC)
As of today, Bitcoin is trading around $117,395, after retreating from an intraday high of $120,196. The price action follows a recent rally toward $123,000, followed by a healthy correction to the $116,000 area.
Technical Overview:
• The resistance zone at $119,000–$120,000 has been broken and could now act as future support.
• A potential inverse head and shoulders pattern is forming, suggesting a breakout toward the $160,000 level, if the support at $114,000–$115,000 holds.
• On the 4-hour chart: MACD is showing a renewed bullish crossover, and RSI is rising steadily without entering the overbought zone — both supporting further upside toward $125,000–$130,000.
🔹 Suggested Entry: Between $117,000 – $118,000, ideally after confirmation of support near the previous breakout zone.
🔹 Target 1 (TP1): $125,000
🔹 Target 2 (TP2): $130,000–$135,000 (depending on momentum continuation)
🔹 Stop Loss (SL): A confirmed break below $115,000 (preferably on the daily close or with strong sell pressure)
⚙️ Risk Management: Do not risk more than 2–3% of your total capital on this trade.
📅 Watchlist Note: Keep an eye on major economic data (e.g., U.S. CPI or Fed announcements) as they can heavily affect market liquidity and volatility.
BTCshort term sell positionDuring the retracement phase, there’s a good opportunity to take a short position

Btc chartBtc harmonics chart.
Price should go up to hit 122k to form a bearish pattern, if the pattern will not get invalidated the target area is around 100k - 98k, and that will form a bullish harmonics pattern that will push the price to 132 - 137k and above, if 100k will hold support.