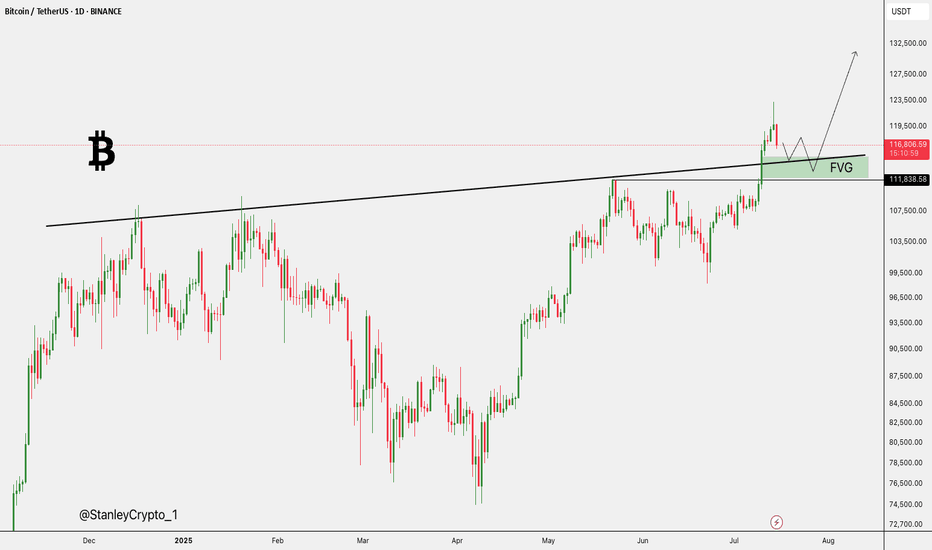
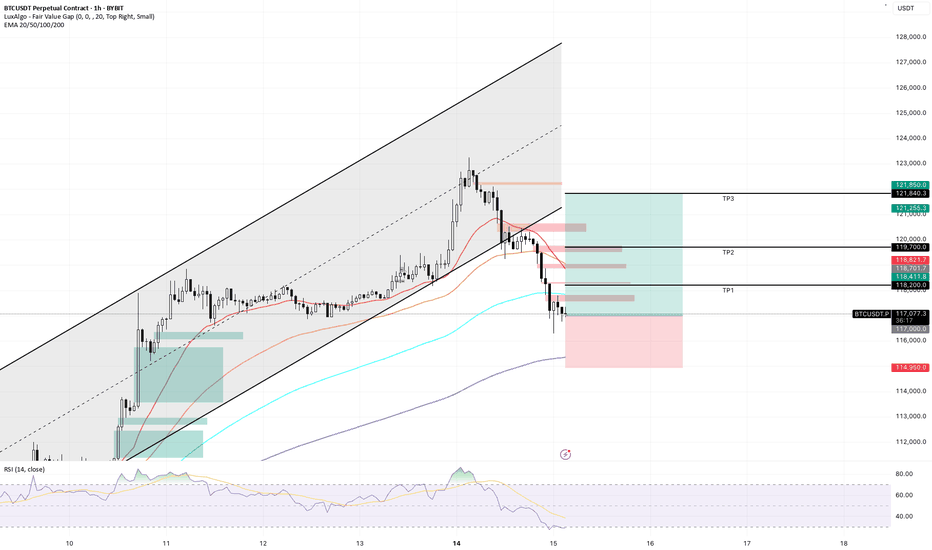
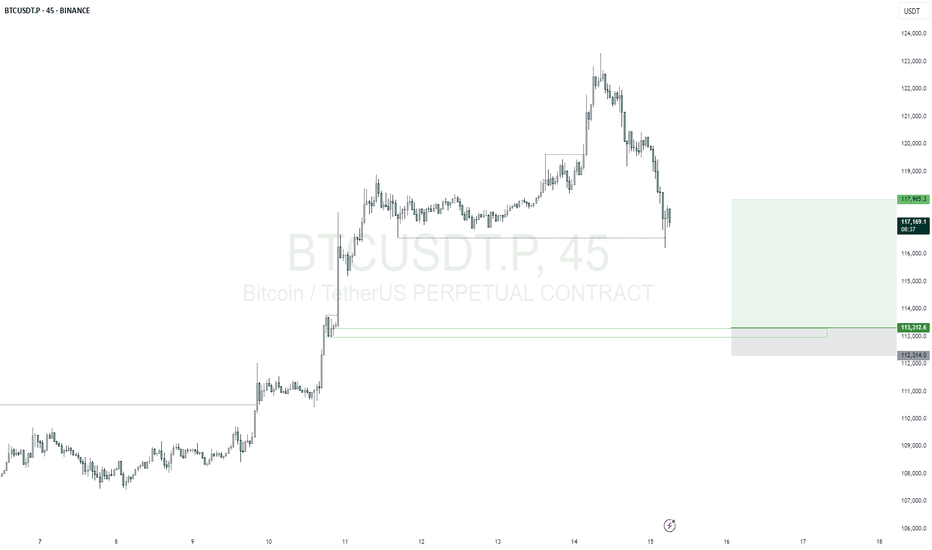
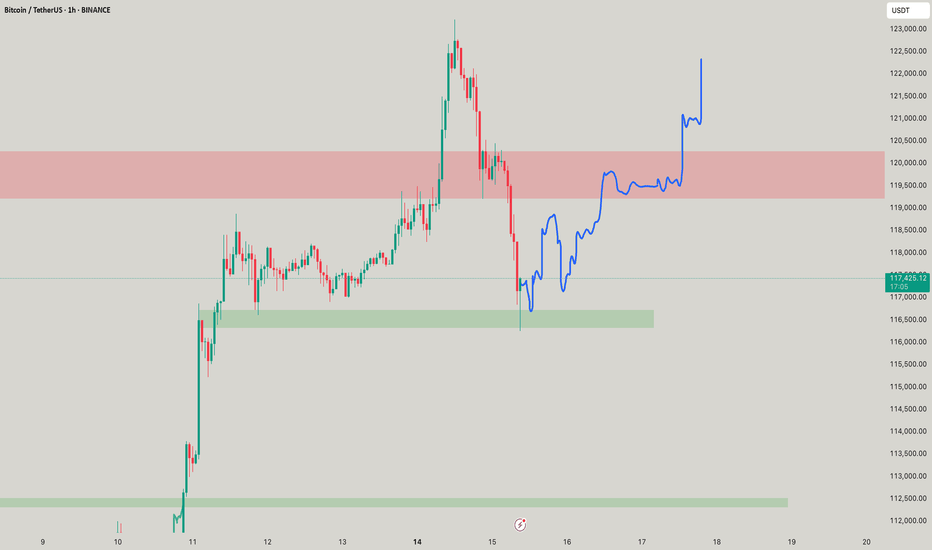
BTCUST trade ideas
DeGRAM | BTCUSD 📊 Technical Analysis
● Price exited a 3-month descending channel and is climbing inside a new rising channel; $91 500 support keeps bulls in control.
● Price just under the $95k supply zone; a break unlocks the upper rail near GETTEX:98K and the next objective at $106k.
💡 Fundamental Analysis
● Spot-BTC ETFs hauled in ≈ $3.4 B last week, underscoring persistent institutional demand.
● US JOLTS openings fell to a four-year low, boosting Fed rate-cut odds and softening the USD—both tail-winds for Bitcoin.
✨ Summary
Rising-channel structure, hefty ETF inflows, and softer U.S. data favor a push above $95 K toward $98 K–106 K; bias invalidated below $91 500.
-------------------
Share your opinion in the comments and support the idea with a like. Thanks for your support!
To be one of the best in trading BTC - BTC HTF HL Hypothesis Price closed below the support-level on the 1D (red line) ----> price should come back to these lows.
Price closed above the resistance-level on the 1D (green line) ----> price should SFP the lows
-----------------------------------------
I expect (or should I say: hope?) price to do a MSB here, meaning: price coming below all that structure below the green level. This will provide a short setup to the dashed line where the TP and spot limit buy orders are 'rested'.
To be one of the best in trading BTC.
BTCUSD - NFP WILL DECIDE!!MARKET UPDATE
After price ranged for most part of the week we've seen an impulsive move to the upside pre NFP. Heading up into NFP News Release I still remain Bearish on BTC (But NFP will decide).
MARKET PROFILE
I'm viewing the market profile of this week as an ACCUMULATION, MANIPULATION & DISTRIBUTION Model. We've seen price Accumulate earlier in the week heading into Thursday, and the displacement on Thursday to the upside I'm viewing as a Manipulation into the daily key Supply Level so my anticipation is for NFP News Release to bring about the Distribution to the downside.
IN SUMMARY
This is only my view on BTC current price action and not a financial advice. You're free to share your opinion on this down in the comment.
Mastering chart patterns - How to use them in trading!Chart patterns are visual formations created by the price movements of a financial asset—like a stock, currency, or cryptocurrency, on a price chart. Traders use these patterns in technical analysis to predict future market direction based on historical behavior. The main chart patterns are the reversal and continuation patterns.
-------------------------------
What will we discuss?
- Bullish reversal patterns
- Bearish reversal patterns
- Bullish continuation patterns
- Bearish continuation patterns
-------------------------------
Bullish reversal patterns:
Double bottom
A double bottom in trading is a bullish reversal pattern that signals the potential end of a downtrend and the beginning of an uptrend. It forms when the price of an asset falls to a low, bounces back up, then drops again to roughly the same low before rising once more. This creates a "W" shape on the chart.
How to trade it:
Before entering a trade, wait for the price to break back above the neckline with strong volume, as this indicates a potential bullish reversal. Once the breakout is confirmed, look for an entry on the pullback to the neckline.
Inverted head and shoulders
An inverted head and shoulders is a bullish reversal pattern that typically forms after a downtrend and signals a possible shift to an uptrend.
It consists of three parts:
* The left shoulder, where the price makes a low and then bounces.
* The head, which is a deeper low followed by another bounce.
* The right shoulder, a higher low similar in level to the left shoulder.
How to trade it:
Before entering a trade, wait for the price to break above the neckline with strong volume, as this confirms the pattern and signals a potential upward move. After the breakout, it's important to wait for a retest of the neckline to look for an entry. Traders typically place a stop-loss just below the right shoulder to manage risk.
Falling wedge
A falling wedge is a bullish chart pattern that often signals a potential reversal or continuation of an uptrend, depending on where it forms in a price trend.
It appears when the price is moving lower but within a narrowing range, creating two downward-sloping, converging trendlines. Both the highs and lows are falling, but the lower highs are coming down faster than the lower lows, which shows that selling pressure is losing strength over time.
How to trade it:
Wait for the falling wedge to break above the downward trendline and for the price to reclaim the most recent lower high. A breakout alone isn’t always reliable, sometimes the price moves briefly above the trendline without making a higher high, resulting in a fake-out. To confirm the move, wait for a clear higher high and then look to enter on the retracement that follows.
-------------------------------
Bearish reversal patterns
Double top
A double top is a bearish reversal pattern that signals a potential shift from an uptrend to a downtrend.
It forms when the price reaches a high, pulls back, then rallies again to the same or similar high but fails to break above it. This creates an "M" shape on the chart. The neckline is the support level at the low point between the two peaks. When the price breaks below this neckline with strong volume, it confirms the pattern and suggests that selling pressure is taking over.
How to trade it:
Before entering a trade, wait for the price to break below the neckline with strong volume, as this indicates a potential bearish reversal. Once the breakout is confirmed, look for an entry on the pullback to the neckline.
Head and shoulders
A head and shoulders is a bearish reversal pattern that typically forms after an uptrend and signals a potential shift to a downtrend.
It consists of three peaks:
* The left shoulder, where the price rises and then falls.
* The head, which is a higher peak followed by another decline.
* The right shoulder, a lower high that is roughly equal in height to the left shoulder.
How to trade it:
Before entering a trade, wait for the price to break below the neckline with strong volume, as this confirms the pattern and signals a potential downside move, After the breakout, it’s important to wait for a retest of the neckline to look for an entry. Traders typically place a stop-loss just above the right shoulder to manage risk
Rising wedge
A rising wedge is a bearish chart pattern that often signals a potential reversal or continuation of an downtrend, depending on where it forms in a price trend.
It appears when the price is moving higher but within a narrowing range, creating two upward-sloping, converging trendlines. Both the highs and lows are rising, but the highs are increasing at a faster rate than the lows. This suggests that buying pressure is weakening over time, and the market may be preparing for a downturn.
How to trade it:
Wait for the rising wedge to break below the upsloping trendline and for the price to reclaim the most recent high low. A breakout alone isn’t always reliable, sometimes the price moves briefly below the trendline without making a lower low, resulting in a fake-out. To confirm the move, wait for a clear lower low and then look to enter on the retracement that follows.
-------------------------------
Bullish continuation patterns
Bullflag
A bull flag is a continuation pattern that signals the potential for a price to continue moving upward after a brief consolidation or pullback.
It forms when the price experiences a strong upward move (the flagpole), followed by a period of consolidation or a slight downward movement (the flag). The flag typically slopes downward or moves sideways, and the consolidation phase usually occurs within two parallel trendlines, creating a rectangle or slight downward channel.
How to trade it?
Before entering a position, wait for the price to break above the downsloping trendline and establish a higher high. If the price doesn’t make a higher high, it could be a fake-out. Once a higher high is confirmed, look for an entry on the retracement. The target is typically the length of the flagpole projected upward from the breakout point.
Bullish pennant
A bullish pennant is a continuation pattern that indicates the potential for a price to continue its upward trend after a brief consolidation. It forms when a strong upward move (the flagpole) is followed by a period of consolidation, where the price moves within converging trendlines, creating a small symmetrical triangle or pennant shape. The consolidation typically shows lower highs and higher lows, and the pattern suggests that the market is taking a "breather" before continuing its upward momentum.
How to trade it?
Before entering a position, wait for the price to break above the downsloping trendline and establish a higher high. If the price doesn’t make a higher high, it could be a fake-out. Once a higher high is confirmed, look for an entry on the retracement. The target is typically the length of the flagpole projected upward form the breakout point.
Ascending triangle
An ascending triangle is a bullish continuation pattern that typically forms during an uptrend, signaling that the price is likely to continue moving higher.
It is characterized by a horizontal resistance line at the top, formed by a series of peaks at roughly the same price level, and an ascending support line at the bottom, formed by higher lows. This creates a triangle shape, where the price is gradually compressing between the horizontal resistance and the rising support.
How to trade it?
Before entering a position, wait for the price to break above the horizontal resistance level with strong volume. Once the breakout occurs, look for an entry on the retracement back to this area.
-------------------------------
Bearish continuation patterns
Bearflag
A bear flag is a bearish continuation pattern that suggests the price is likely to continue moving downward after a brief consolidation or upward pullback.
It forms when there is a strong downward move (the flagpole), followed by a period of consolidation or slight upward movement (the flag). The flag typically slopes upward or moves sideways, and the consolidation occurs within two parallel trendlines, creating a rectangular or upward-sloping channel. This pattern shows that, despite the short-term pullback, the overall downtrend remains intact.
How to trade it?
Before entering a position, wait for the price to break below the upsloping trendline and establish a lower low. If the price doesn’t make a lower low, it could be a fake-out. Once a lower low is confirmed, look for an entry on the retracement. The target is typically the length of the flagpole projected downward for the breakout point.
Bearish pennant
A bearish pennant is a bearish continuation pattern that signals a potential continuation of a downtrend after a brief consolidation.
It forms when there is a strong downward move (the flagpole), followed by a period of consolidation where the price moves within converging trendlines, creating a small symmetrical triangle or pennant shape. The consolidation typically shows lower highs and higher lows, indicating that the price is taking a pause before continuing its downward movement.
How to trade it?
Before entering a position, wait for the price to break below the upsloping trendline and establish a lower low. If the price doesn’t make a lower low, it could be a fake-out. Once a lower low is confirmed, look for an entry on the retracement. The target is typically the length of the flagpole projected downward for the breakout point.
Descending triangle
A descending triangle is a bearish continuation pattern that typically forms during a downtrend, indicating that the price is likely to continue moving lower after a period of consolidation.
The pattern is characterized by a horizontal support line at the bottom, formed by a series of lows at approximately the same price level, and a descending resistance line at the top, formed by a series of lower highs. The price contracts between these two trendlines, creating a triangle shape with a downward-sloping upper boundary and a flat lower boundary.
How to trade it?
Before entering a position, wait for the price to break below the horizontal support level with strong volume. Once the breakout occurs, look for an entry on the retracement back to this area.
-------------------------------
Thanks for your support.
- Make sure to follow me so you don't miss out on the next analysis!
- Drop a like and leave a comment!
Bitcoin (BTC): Buyers Overtaking Zones | Break of StructureBuyers have formed a break of structure where sideways movement resulted in a breakout. Now price needs to re-test the broken zone or form another BOS to confirm the upside movement but we have to be careful as we are entering the weekend markets.
During weekends we are forming the CME gaps, which act as magnets so ideally we should see not another BOS but the re-test of the previously broken zone so eyes on $95,700.
Swallow Academy
Bitcoin is poised for a 95K breakout. 100K target?After a fairly rapid growth (rally) bitcoin did not correct, the price could not reach 0.382 within the local correction, the range is squeezed between resistance and 0.236, which indicates a bullish interest in the current situation
The price has been in consolidation for the last 4-5 days. This is enough to break the resistance at 95600 and give us a good momentum.
Scenario: If bitcoin continues to slowly and gradually approach the 95600 resistance, there is a high probability of triggering a crowd when the resistance is broken, which will push the price to 100K.
TradeCityPro | Bitcoin Daily Analysis #79👋 Welcome to TradeCity Pro!
Let’s dive into Bitcoin and key crypto index analysis. As usual, in this analysis, I’ll walk you through the futures session triggers for the New York session.
⏳ 1-Hour Timeframe
On the 1-hour timeframe, as you can see, yesterday the price stabilized above the 95370 zone and continued its movement up to 97139.
✔️ The reason the price couldn’t move higher is that the RSI failed to stay above the 70 level and didn’t enter the Overbuy zone — it got rejected there. As a result, the price also got rejected from the 97139 resistance and is currently in a corrective phase.
🧩 The SMA25 indicator has now caught up to the price, and this could bring upward momentum into the market. If that happens, the price might resume its upward move, and breaking the 97139 high could lead to a continuation toward the 98828 zone.
📊 Volume increased during the bullish candles, but after reaching the 97139 high, volume returned to previous levels, and the price has been ranging.
⚡️ Today, if RSI enters the Overbuy zone, a bullish move is very likely — in that case, I recommend definitely holding a long position.
🔽 As for short positions and bearish sentiment on Bitcoin, as I’ve been saying for a while, we should wait for a proper trend reversal before entering short trades.
📈 If the price doesn’t respond to the SMA25 and keeps ranging, the next parameter that could drive bullish momentum is the SMA99.
👑 BTC.D Analysis
Moving to Bitcoin Dominance — BTC.D is still trending upward. Yesterday, after breaking the 64.72 ceiling, it started a new bullish leg, and so far, there’s no sign of trend weakness.
🎲 I suggest waiting for a new structure to form. For now, it’s still rising, and if this continues, Bitcoin will likely outperform altcoins.
📅 Total2 Analysis
Looking at Total2, this index was rejected from the 1.05 resistance yesterday. The reason is that Bitcoin dominance surged, meaning not much money flowed into altcoins, and Total2 couldn’t break its ceiling.
🔼 If BTC.D reverses and pulls back, a lot of capital could move into altcoins — in that case, we can consider opening long positions on altcoins.
📅 USDT.D Analysis
Now to Tether Dominance — another reason Bitcoin couldn’t extend its bullish leg yesterday was this indicator. Support at 4.99 held, preventing money from entering the market, and causing the correction phase.
💫 Currently, the 4.99 level remains a crucial trigger. If it breaks, the main bullish trend in the market could begin. On the other hand, a break above 5.10 would likely push the market into a deeper correction.
❌ Disclaimer ❌
Trading futures is highly risky and dangerous. If you're not an expert, these triggers may not be suitable for you. You should first learn risk and capital management. You can also use the educational content from this channel.
Finally, these triggers reflect my personal opinions on price action, and the market may move completely against this analysis. So, do your own research before opening any position.
BTCUSDT BuyHello traders,
I realized I haven’t shared any signals for BTCUSDT before, so I wanted to post a new one.
You can open a **Buy** trade on BTCUSDT.
The TP target is **97,133.71** and the SL level is **96,223.99**.
The trade is currently active on my side.
Wishing everyone lots of profits!
🔔 I post detailed trade ideas and daily market analysis like this every day on my TradingView profile.
👉 Follow me to get notified and read the full breakdowns.
Bitcoin Daily Chart Update – Momentum Intact!📢 Bitcoin (BTC) has surged from $84,800 to nearly $96,000 in just 10 days, following a strong breakout on the daily chart. Price is holding well, showing bullish continuation.
🚩 The next key level is $97,200 – a clean breakout above this can open the door to $99,520 and possibly a retest of recent highs, assuming global sentiment remains stable.
🔒 Stop-loss for the setup: $93,000
📈 This setup was spotted using the iSparkIndicator, which is designed to identify early momentum shifts and breakout zones. It’s been a game-changer in catching such moves with confidence.
📬 If you're curious about how it works, feel free to DM me for insights or a hands-on trial.
#Bitcoin #BTC #Crypto #Breakout #CryptoTrading #TechnicalAnalysis #TradingView #iSpark #BitcoinUpdate #TrendFollowing
Bitcoin is at a critical decision pointBitcoin:
Currently, Bitcoin is at a key resistance zone around the $97,500 level, which holds significant technical importance as it has acted as a price barrier multiple times in the past. In a bullish scenario, if Bitcoin manages to decisively break through this resistance and stabilize above this level, a strong upward movement could begin. With increased trading volume and buyer support, the price could target the next level at around $115,000. This scenario is particularly likely if positive fundamental factors, such as favorable news regarding Bitcoin adoption or improving macroeconomic conditions, support this move.
However, in a bearish scenario, if Bitcoin fails to overcome the $97,500 resistance and faces selling pressure, a price correction becomes more probable. In this case, the first significant support level is around $92,000, which could serve as an initial correction target. If selling pressure persists and this level is breached, the next support lies at approximately $89,500, which may act as a temporary price floor. Given the current market conditions and recent volatility, my personal view leans more toward a potential price decline, as technical factors and market uncertainty may strengthen sellers.
Risk Warning: Investing and trading in the cryptocurrency market involves high risk. Prices can be highly volatile, leading to significant profits or losses. Please conduct thorough research and seek professional financial advice before making any trading decisions. This analysis is solely a personal opinion and should not be considered financial advice. You are solely responsible for any trading decisions you make.
Good luck
Pooya Salehipour
Bitcoin’s Short Squeeze Pushes Into Key Resistance — Reversal?Bitcoin has staged an aggressive recovery — but it’s not just any bounce. The move looks to be driven by a classic short squeeze, where extreme bearish sentiment and overcrowded short positions result in a sharp upward spike. This rally has now brought BTC right into a thick wall of resistance, and the next few candles could define the trend for weeks to come.
What’s Happening:
The short squeeze began after BTC reached heavily oversold levels. As price began to bounce, it forced short positions to unwind — fueling a momentum rally. But the rally hasn’t been supported by sustained demand; it’s been largely reactive. That’s where the caution comes in.
BTC is now sitting at a dense confluence of resistance, including
- The descending trendline from the broader channel
- The 0.618 Fibonacci retracement
- The point of control from the recent volume profile
- A major price level around $98,300
Why This Zone Matters:
Rejections from this area in the past have triggered sharp pullbacks. The fact that we haven’t seen immediate rejection yet raises eyebrows — but without strong volume and a decisive breakout, it’s premature to call this a full trend reversal. If the squeeze loses steam here, sellers could pile back in.
The Bullish Case:
If price grinds through this zone and closes above $98,300 with sustained volume, the landscape shifts. That level flips from resistance to support, potentially unlocking another leg higher.
The Bearish Case:
However, if this is just a squeeze without follow-through, expect a rejection to form soon. Watch for signs of slowing momentum, especially lower highs or sell pressure into resistance — classic signals of a local top forming.
Final Thoughts:
This is a make-or-break moment. The current structure is vulnerable to rapid moves in either direction. If BTC can’t hold this push, it may confirm a local high and set the stage for a deeper correction. But if bulls punch through resistance, momentum could snowball.
Stay cautious and let price confirm direction.
BTC 2025.05.01***Follow SEOVEREIGN to receive alerts.
**Boosts help SEOVEREIGN analyze more assets.
**Our team regularly publishes analysis reports on the cryptocurrency market.
🎯 Short-Term Bitcoin Downside Scenario
While we still envision long-term upward potential,
we are sharing a short-term bearish outlook based on the 15-minute chart for those engaged in futures trading.
A classic Crab Pattern has been identified,
which may serve as a helpful reference for those interested in harmonic patterns.
Target 1: 95,705
Target 2: 94,650
As long as the pattern remains valid, a correction toward these levels can be considered a natural move.
Please exercise caution and manage your risk appropriately when trading.