Quick Bitcoin Analysis – 30-Minute TimeframeQuick Hey friends 👋
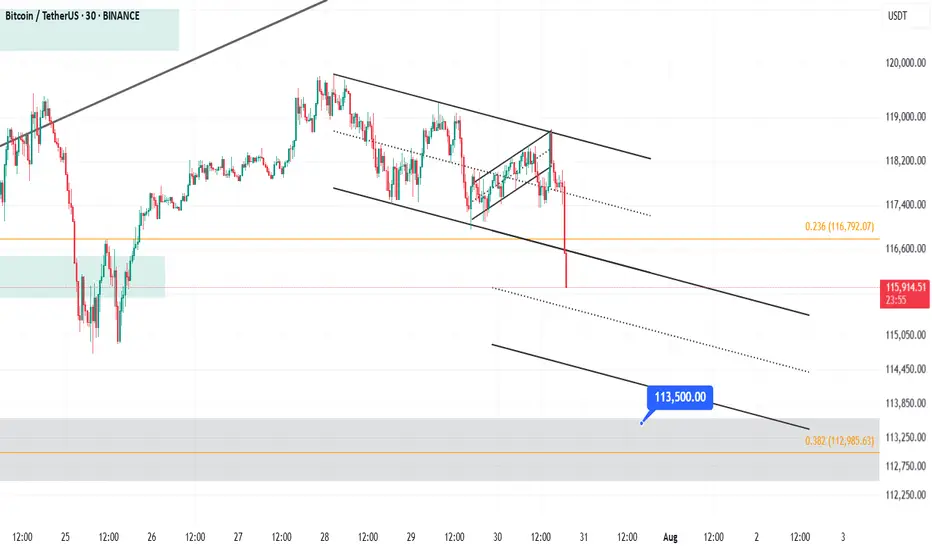
Bitcoin was recently moving inside a weak upward channel on the 30-minute chart. But now, it has broken below the channel with a strong bearish candle. This suggests we’re entering a short-term correction.
🔹 However, don’t forget — the overall trend is still bullish.
This drop looks more like a healthy pullback, not the start of a full downtrend.
🎯 Possible Targets for This Correction:
✅ Target 1: Around $114,500
(This comes from measuring the width of the broken channel.)
✅ Target 2: Strong support near $113,500
(This level has shown solid buyer interest in the past.)
📊 The RSI is also approaching the oversold zone, which means we might see a small bounce or slowdown in the drop soon.
📌 In short:
This is likely just a dip in a bigger uptrend. Be patient, watch key support zones, and don’t rush into trades.
Always stick to proper risk management! 💼
Bitcoin Analysis – 30-Minute Timeframe
BTCUST trade ideas
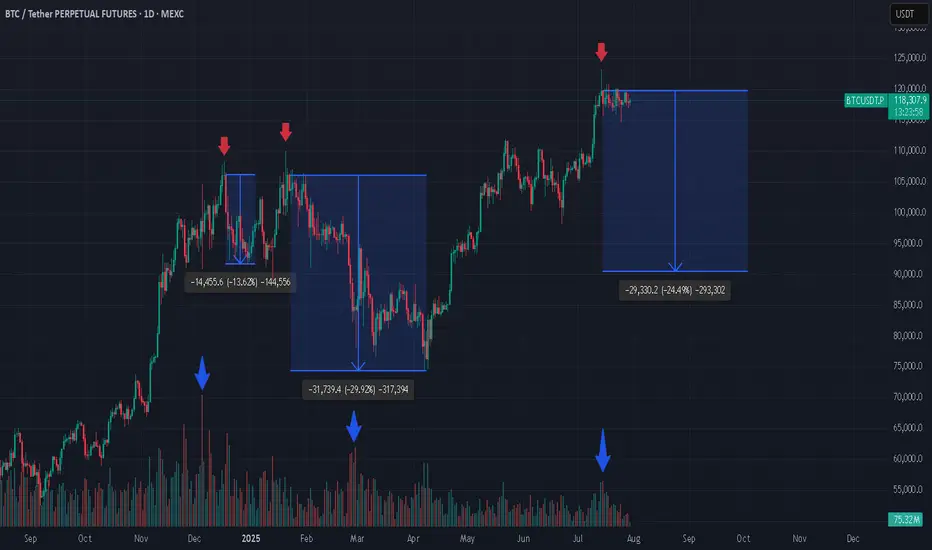
3 Bitcoin Tops, Weak Green Candles, and What’s Next? If you're closely monitoring the Bitcoin (BTC) market, patterns often begin to reveal themselves in surprising ways. In the attached chart, I’ve highlighted three major local tops that Bitcoin has made, each marked by a weak green daily candle. What’s even more striking is what comes next: a dramatic increase in trading volume, followed by steep corrections.
Spotting the Pattern: Weak Green, Heavy Volume
At each pointed top (see red arrows), BTC formed an all-time high (ATH) with a relatively weak green candle, hardly the sign of euphoric buying strength.
Look closely at the volume bars below (blue arrows). Each time, as price struggled to push higher, volume surged after the top, often a signal of major sellers stepping in or longs closing en masse.
What followed? Significant corrections: -13.6%, -29.2%, and, now it might be shaping up for another potential drop (-24.1%) if history rhymes.
Why Does This Matter?
From a technical analysis perspective, volume is the fuel behind price moves. When a new high is reached with limp buying (weak green candles) but is swiftly met with rising volume on the way down, it’s a classic sign of distribution, a strong hand selling into retail euphoria.
Is Another Drop Coming?
Given the consistency in behavior, it’s not unreasonable to ask: are we about to witness another similar correction now that BTC has again hit a top with a weak green candle and volume is ticking up? The historical evidence certainly makes it plausible.
Long-Term Perspective: Still Bullish
Despite these corrections, my long-term outlook remains bullish. Every cycle has corrections, they’re opportunities for healthy consolidation, allowing strong hands to accumulate and the market to reset for its next leg higher.
*not investment advice
#crypto #btc #bitcoin #finance #trading
Accumulate waiting for btc price increase💎 BTC PLAN UPDATE – End of July (31/07)
📊 BTC Technical Analysis (4H Timeframe – End of July)
✅ Positive Signals:
• BTC has broken out of the consolidation triangle pattern (blue diagonal line), indicating a potential strong uptrend.
• The current price is retesting the breakout support zone around 117,800–118,000 → showing a good reaction and creating upward momentum.
• MA50 and MA200 are starting to slope upwards → confirming increasing buying strength.
📈 Bullish Scenario:
• If BTC holds above 118,000, it is likely to move toward the nearest resistance zone at 119,900.
• After breaking 119,900, the next targets are:
→ 122,792 (Fibonacci 1.618)
→ Further target: 127,900 (Fibonacci 2.618)
🛑 Risk Note:
• If the price drops below 117,000, it’s important to monitor again, as it may retest a deeper support zone around 114,500.

daily #bitcoin analysisBitcoin is fluctuating between the two price areas of $115,000 and $120,000 and I don't think it will trend either up or down anytime soon. Unless it breaks the two mentioned areas from above or below. As we can see, the new RSI indicator also shows a sideways trend. This analysis is not a financial recommendation in any way.

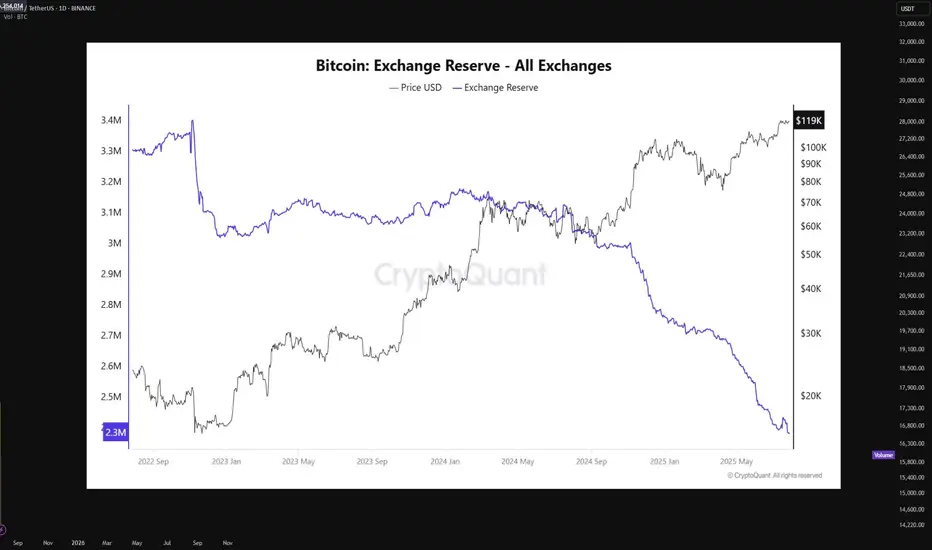
Bitcoin supply on exchanges is at an all-time lowBitcoin is currently undergoing a textbook supply-side shock, a rare phenomenon that historically precedes vertical price expansion. The latest on-chain data from CryptoQuant shows that BTC exchange reserves have declined to an all-time low of just 2.3 million BTC, down from approximately 3.3 million BTC in mid-2022. This marks a 27% drop in immediately sellable supply — a net outflow of over 900,000 BTC from centralized exchanges.
This trend signifies that a substantial portion of BTC holders have opted for long-term self-custody, indicating growing conviction among market participants. When coins leave exchanges, they are typically sent to cold wallets for long-term storage, effectively removing them from the liquid supply pool. This restricts the ability for large-volume sell orders to materialize, especially during rapid price appreciation, thereby creating a supply squeeze.
In parallel, the price of Bitcoin has risen steadily, now trading around $119,000, with a clear break above prior resistance clusters in the $75K–$85K zone. The price has shown strong momentum divergence against exchange reserves, with reserves falling while price rallies, a bullish continuation signal. This decoupling indicates aggressive spot accumulation in the background, often a signal of institutional or whale-level interest.
Technically, BTC is also showing signs of a parabolic structure forming, supported by rising volume on upward moves and decreasing volume on retracements — confirming bullish market structure. Price action has respected key Fibonacci levels throughout the rally, and is currently pressing into a price discovery phase with minimal historical resistance above.
The macro backdrop further supports this narrative. With Bitcoin ETFs now live and facilitating regulated inflows, capital has increasingly favored BTC as a store-of-value hedge amid fiat debasement and monetary policy uncertainty. Combined with the 2024 halving, which cut block rewards from 6.25 to 3.125 BTC per block, new supply issuance has halved, while demand remains elevated.
When supply dries up — as it clearly is — and demand persists or increases, price must equilibrate higher. This is a fundamental economic principle now playing out in real-time. The current environment mirrors late 2020 to early 2021, when a similar supply drop from exchanges preceded Bitcoin’s rally from $20K to $64K.
In summary, Bitcoin is entering a phase of constrained supply coupled with aggressive demand, pushing the asset toward price discovery territory. With on-chain reserves at historic lows, minimal overhead resistance, and strong macro alignment, the technicals now point to a structurally bullish setup.
If this trend persists, a sustained breakout beyond $120K could trigger a feedback loop of FOMO-driven spot bids, further deepening the supply shock and accelerating the next leg of the bull cycle.
BTCUSD As I prepare for the continuation of the weekly Bitcoin bullish trend, I foresee a potential price retracement down to the 109k zone. This dip could offer a valuable opportunity for a robust bullish continuation, setting the stage for upward momentum in the market. The anticipation of this movement encourages a strategic approach, as we watch for signs of strength and confirmation in buying pressure. I'm preparing to capitalize on the ongoing weekly bullish trend in Bitcoin. I anticipate a price retracing to 109k zone, which could provide a strong opportunity for bullish continuation

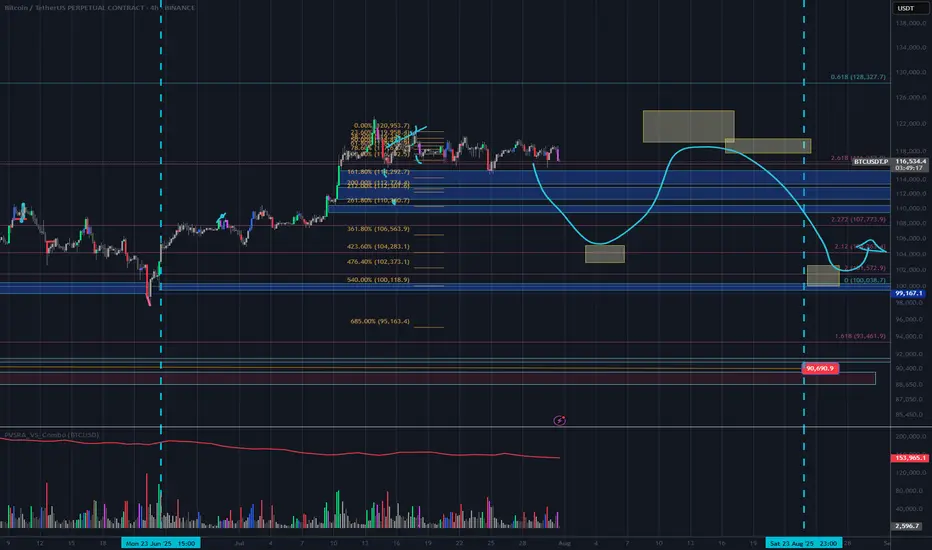
BTCUSD – Wyckoff Accumulation + Elliott Wave SynergyTimeframe: 1H
Title: "A textbook Wyckoff Accumulation with Elliott Wave Confirmation – Sign of Strength Next?"
This chart presents a textbook Wyckoff Accumulation structure seamlessly combined with Elliott Wave Theory, highlighting how the two methodologies can complement each other in timing and structural validation.
🔍 Wyckoff Accumulation Phases:
SC (Selling Climax) and AR (Automatic Rally) define the range.
ST (Secondary Test) and STB (Secondary Test in Phase B) confirm horizontal support.
A classic Spring and Test pattern occurs in Phase C, marked by a sharp downward probe below support (Spring), followed by a successful retest with no new low (Test).
The LPS (Last Point of Support) is forming above the Spring low and near the 61.8% Fibonacci retracement level, showing bullish absorption of supply.
The recent rally and pullback suggest we're entering Phase D, with the Sign of Strength (SOS) expected next.
🌀 Elliott Wave Alignment:
The Spring aligns with the end of wave (iv) of a larger impulse, and the structure unfolding from the Spring appears to be the start of wave (v).
The move from Spring to SOS shows impulsive qualities, labeled as wave (i), with the corrective pullback forming wave (ii), ending near the golden Fibonacci ratio (61.8%).
This alignment of wave (ii) with the LPS further validates the accumulation and sets the stage for a strong wave (iii) within wave (v), likely to coincide with a Sign of Strength breakout.
💡 Key Takeaways:
This is a classic Wyckoff Accumulation with all major phases visible: A to D.
Elliott Wave counts confirm the internal structure and suggest bullish continuation.
Watch for the SOS rally above resistance at ~120k to confirm the transition into Phase D/E and a potential trending move.
🔔 Conclusion:
Combining Wyckoff and Elliott Wave provides a high-probability setup. A successful break above resistance will signal the start of a trend phase. LPS offers a favorable risk-reward area, especially with wave (ii) possibly completing soon with a test of Fibonacci ratio (61.8%).

Bitcoin at Descending Channel Resistance – Rejection Imminent?🔻 Bitcoin at Descending Channel Resistance – Watch This Level Closely!
📉 BTC/USDT is currently testing the top boundary of a well-defined descending channel on the 2H chart.
🟨 This zone has acted as strong resistance in the past, and the current reaction suggests the potential for a short-term rejection.
Unless we see a clean breakout above $120K with strong volume and follow-through, the more probable scenario is a pullback towards the midline or lower boundary of the channel.
💡 Notably, this area also aligns with a local supply zone and prior liquidity sweep, making it a key decision point.
⸻
🧭 CryptoPilot’s Take:
This is where patience pays off. No breakout = no FOMO. Watch for confirmation before acting.
⸻
❓ What’s your view?
Will BTC break out and flip bullish here — or is a deeper correction on the way?
👇 Share your thoughts in the comments!
💬 Follow for daily high-probability setups using Smart Money & Wave Theory. Let's grow together!

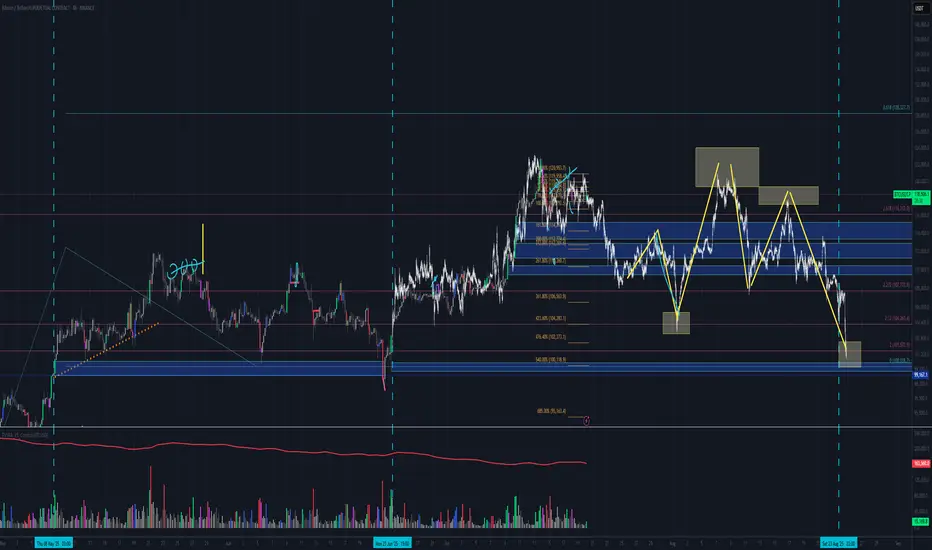
Targets and their point in timewe use the threshold breaks to determine targets AKA areas of liquidity. we also utilize pattern detection paired with the threshold breaks to validate cycles and where we are in said cycle.
Bitcoin: Pennant - Bullish Continuation PatternI spotted a bullish continuation pattern called Pennant in Bitcoin chart
Support and resistance are marked with yellow trendlines
There is also a Flag Pole (white trendline)
The model is clean as we already see a bullish breakup and a textbook pullback
to the broken resistance.
The target is established at the height of the Flag Pole applied to the broken resistance
at $135k.
For final confirmation the price should overcome the top of breakout at $119,800
The invalidation point is located at the bottom of the Pennant at $114,700

BTCUSDTHello Traders! 👋
What are your thoughts on BITCOIN?
After setting a new all-time high, Bitcoin remains in a corrective phase, marked by sideways price action and choppy movements.
There's a notable gap around the $114,000 level, which may act as a magnet for price during this correction.
The ongoing pullback is likely to extend toward the key support zone, which aligns with the previous breakout level and the bottom of the ascending channel.
Once this support holds, we could see a bullish reversal, targeting the upper boundary of the channel once again.
As long as Bitcoin remains above the marked support zone, the overall structure stays bullish and this correction may present a buy-the-dip opportunity.
Will Bitcoin fill the gap and bounce back toward new highs? Let us know your thoughts! 🤔👇
Don’t forget to like and share your thoughts in the comments! ❤️

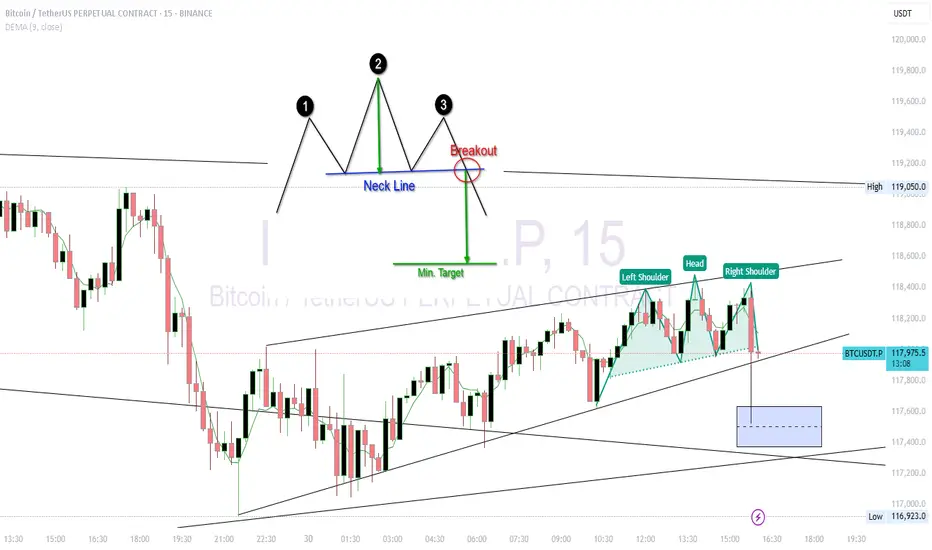
BTC USDT Forming Head and shoulder in 5 MinChart Breakdown
🟢 Pattern:
Left Shoulder: 118,450
Head: ~118,600
Right Shoulder: ~118,400
Neckline: Sloping slightly upward, around 118,050
📌 Bearish Breakdown Scenario
If BTC breaks below the neckline (~118,000) with volume, the expected drop (measured move) is:
Height of pattern:
Head (118,600) – Neckline (118,000) = 600 pts
Target on breakdown:
118,000 – 600 = ~117,400
🔻 Target: 117,400–117,300
🔒 Invalidation: Price closes above 118,300 with strong volume.
BTCUSDT – Key Support Holding! Next Targets if 115,827 BreaksBitcoin is currently holding above a crucial support zone around 115,220. After a recent drop to the 114,979 area, buyers stepped in strongly, preventing further downside.
📊 If price stabilizes above 115,220 and successfully breaks through the resistance at 115,827, I expect bullish continuation towards the following targets:
🎯 Target 1: 117,900
🎯 Target 2: 119,076
These zones acted as strong resistances previously, and breaking through them could open the path to further upside.
⚠️ However, if BTC closes below 114,500, we may see a bearish breakdown with potential downside towards 108,000 – 106,000 range.
📌 Personally, I hope Bitcoin holds this support as it’s a key level to maintain bullish momentum.
Let’s see how the market reacts in the next few candles! BINANCE:BTCUSDT

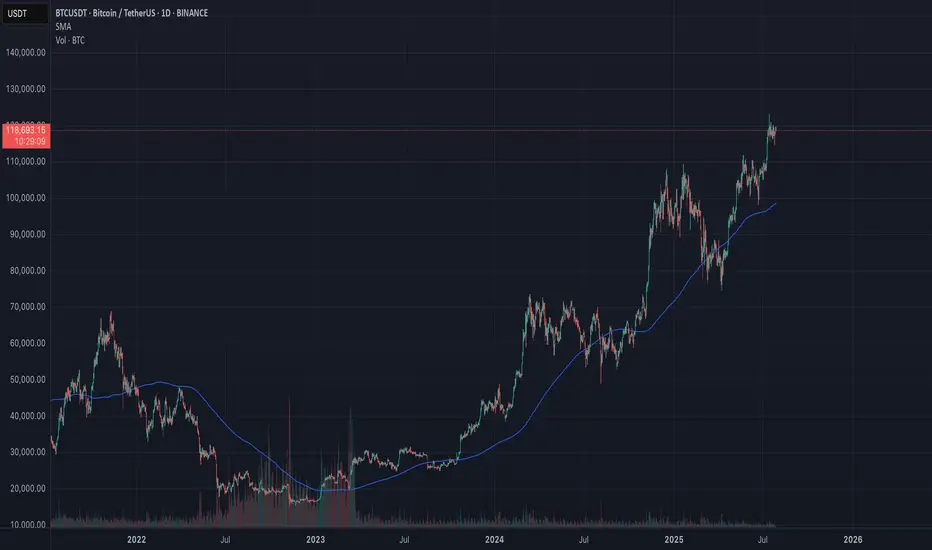
BTC Macro Trend ViewDaily chart of BTCUSDT with MA200 and volume. Used to monitor short-term market structure and trend support.
Have been warned multiple times....BTC will FALL on retailersBTC has been consolidating at the top for a while, which is not very common. Have a feeling that crypto bros have been getting the scratch for more profit taking, but no sensible person will keep buying at the top when the market is already WAY overheated. Picked up early UltraBear signal on this, don't be the person holding to the bag for years. This bubble will burst, just like every other time! Always do your own due diligence, stay safe and get out if you can....

Short- Sell Bitcoin Target 107000 $ in next few monthsBitcoin is on way to it's down side in next 5-6 months. If it will not sustain, then it can fall down to 85000$.

Pattern detection bitcoinusing hourly btc analysis we can breakdown this move and its time cycles
pvsra volume threshold breaks indicating price instability allows us to break down these moves starting point
present
past pattern repeating
barpattern-overlay
BITCOIN CRASH PREDICTED! HERE’S WHAT HAPPENS NEXT! (scary)Yello Paradisers, Bitcoin crashed exactly as we predicted in the previous videos that it will happen with the highest probability.
In this video I am explaining to you what's gonna happen next.
Head and shoulders, neckline, is be breaking to the downside, we need a clear confirmation of a reclaim Our channel on high timeframe is getting breakout to the downside and confirmation was that a reclaim was already successful.
In this video I'm sharing with you Elliott Way theory on low timeframe and what needs to be done for confirmation perspective in order for us to continue to go to the downside or have a reversal to the upside.
Don't be a gambler. Don't try to get rich quick. Make sure that your trading is professionally based on proper strategies and trade tactics.

BTC poised to rise further! Market volume remains the problemBTC poised to rise further! Market volume remains the problem
From our chart we can see that BTC likes to make big corrections before moving higher. Over the weekend, BTC transformed from a bearish picture to a clear bullish triangle with a bullish breakout.
The prevailing trend should push BTC higher as shown in the chart, but again the problem is with the volume.
Suppose BTC has not accumulated enough volume during the development of the pattern. In that case, it is very likely that it will fall even further to develop an even larger pattern like the previous one that we can see at the end of the wave.
However, at the moment, BTC has a bullish pattern and the scenario could develop in the way shown in the chart. We cannot assume further transformations at the moment.
You may find more details in the chart!
Thank you and Good Luck!
PS: Please support with a like or comment if you find this analysis useful for your trading day

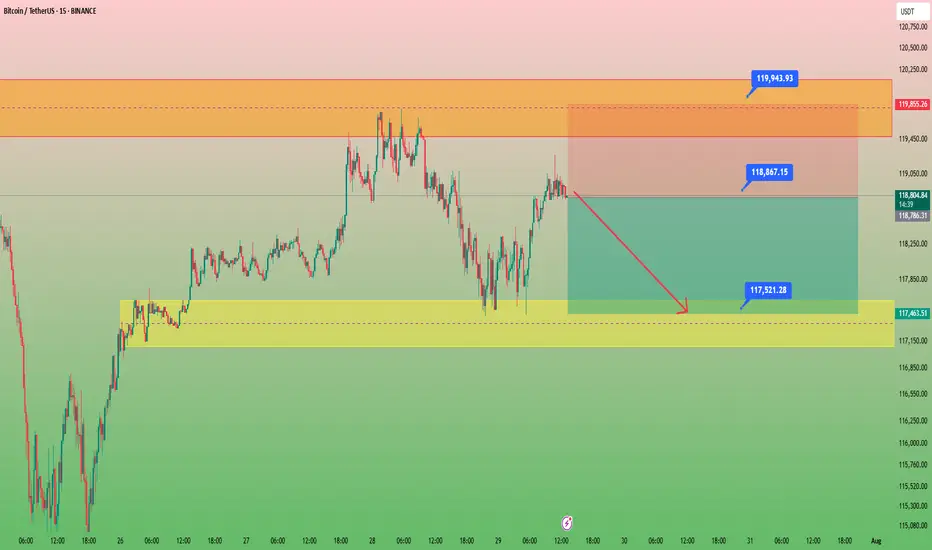
Bitcoin in 15minCaption important🛑🛑🛑
Hello to all traders. 😎😎
I hope all your deals will hit their targets. 🎉🎉
I’m opening a short position on Bitcoin from the current level, targeting $118,200 as the first take-profit, and $117,600 as the second target.
⚠️ This is a high-risk trade, so make sure to apply proper risk management.
What Do You Think?
Which scenario do you think is more likely to happen? **Share your thoughts!** ⬇️
Don't forget that this is just an analysis to give you an idea and trade with your own strategy. And don't forget the stop loss🛑🛑🛑
❤️❤️❤️The only friend you have in financial markets is your stop loss❤️❤️❤️
Please support me with your ✅' like'✅ and comments to motivate me to share more analysis with you and share your opinion about the possible trend of this chart with me 🙏😊
Be Happy , Ali Jamali
BTC short setupGiven the bearish divergence on the lower timeframe and grabbing liquidity, we may be able to open a short position with low volume.

Update: Bull or Bear?I optimized and updated my trend lines. We have a fake breakout on there
What's your Idea? Bull or Bear?

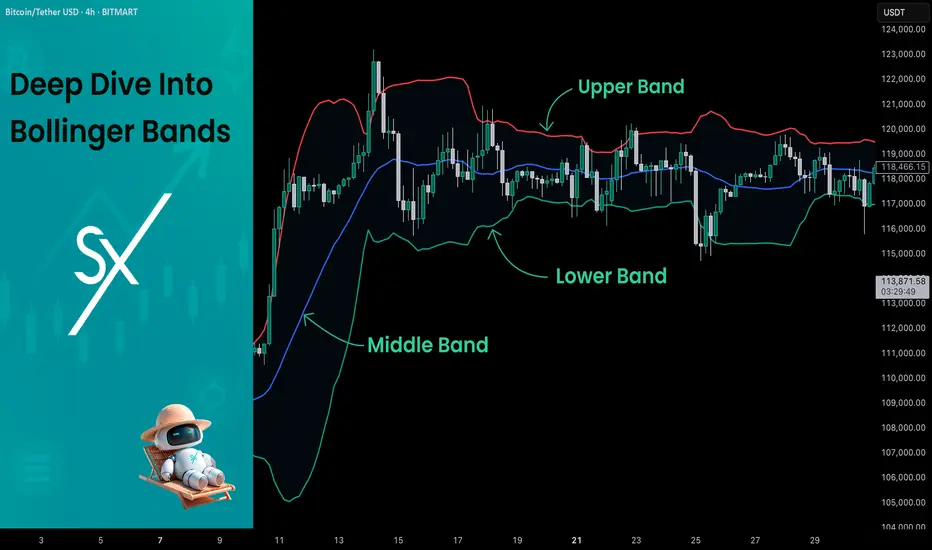
Deep Dive Into Bollinger Bands 🗓This article explores the Bollinger Bands indicator—a powerful volatility tool used by traders worldwide. You'll learn how it works, how to calculate it, and how to use it to detect potential breakouts, trend reversals, and overbought or oversold conditions in the market.
📚 Introduction to Bollinger Bands
In the fast-paced world of trading, understanding market volatility is key to making informed decisions. Bollinger Bands, developed by John Bollinger in the 1980s, offer a visual and statistical method to measure this volatility. Unlike simple moving averages, which only tell you the trend, Bollinger Bands expand and contract based on recent price action, helping traders spot overbought, oversold, or consolidation phases.
These bands dynamically adjust to market conditions, making them one of the most popular indicators for trend-following, mean-reversion, and breakout strategies. Whether you’re trading crypto, stocks, or forex, Bollinger Bands can help you identify high-probability setups by combining trend direction with volatility.
📚 How Bollinger Bands Are Calculated
Bollinger Bands consist of three lines:
Middle Band – This is a simple moving average (SMA) of the price, typically over 20 periods.
Upper Band – The middle band plus two standard deviations.
Lower Band – The middle band minus two standard deviations.
Middle Band = SMA(n)
Upper Band = SMA(n) + (k × σₙ)
Lower Band = SMA(n) - (k × σₙ)
Where σₙ is the standard deviation of the price for n periods and k is the multiplier, typically set to 2, which captures ~95% of price action under normal distribution. The middle band shows the average price over the last 20 candles. The upper and lower bands adjust based on how volatile the price has been — expanding in high volatility and contracting in low volatility.
🤖 For those traders who want to implement Bollinger Bands into algorithmic strategy we provide formula it's calculation in Pine Script:
basis = ta.sma(src, length) // Middle Band (SMA)
dev = mult * ta.stdev(src, length) // Standard Deviation × Multiplier
upper = basis + dev // Upper Band
lower = basis - dev // Lower Band
📚 How to Use MACD in Trading Strategies
⚡️Bollinger Band Squeeze (Volatility Contraction and Expansion)
The idea is pretty simple, а squeeze indicates low volatility and often precedes a breakout. The squeeze is the situation when the Upper Band and Lower Band contract, and BB width is at a local minimum. In this case you shall be prepared for the high volatility after the period of low volatility. This strategy doesn’t predict direction — it prepares you for volatility.
Long setup:
Price is in long-term uptrend, you can use 200 EMA as a major trend approximation - price shall be above it.
Bollinger Bands is narrow in comparison to the previous period. Price usually is in sideways.
Open long trade when candle shows a breakout and closes above the Upper Band.
Set a trailing stop-loss at the Middle Band.
Short setup:
Price is in long-term downtrend, you can use 200 EMA as a major trend approximation - price shall be below it.
Bollinger Bands is narrow in comparison to the previous period. Price usually is in sideways.
Open short trade when candle shows a breakdown and closes below the Lower Band.
Set a trailing stop-loss at the Middle Band
📈Long Trading Strategy Example
1. Price candle shall be closed above 200-period EMA. In our example we have BITMART:BTCUSDT.P 4h time frame.
2. Bollinger Bands shall be narrow in comparison with the previous periods.
3. Open long trade when candle closes above the Upper Band.
4. Close trade when price touched the Middle Band.
📉Short trading strategy example
1. Price candle shall be closed below 200-period EMA. In our example we have BITMART:BTCUSDT.P 4h time frame.
2. Bollinger Bands shall be narrow in comparison with the previous periods.
3. Open short trade when candle closes below the Lower Band.
4. Close trade when price touched the Middle Band.
⚡️Mean Reversion (Rebound from the Bands)
This is the most common approach to use Bollinger Bands. The idea is also very simple, we just want to open long if price touches Lower Band and short if price reaches Upper Band. Price tends to revert to the mean (Middle Band), especially in range-bound markets. It's very important to trade in the direction of the major trend to reduce the probability of the large move against you.
Long setup:
Price is in long-term uptrend, you can use 200 EMA as a major trend approximation - price shall be above it.
Open long trade when price touches the Lower Band.
Set the initial stop-loss at the fixed percentage below entry price. Choose this percentage number with your personal risk/money management, you shall be comfortable to lose this amount of money in case of stop-loss hit.
If price reached Middle Band set stop-loss at breakeven.
Close trade when price reached the Upper Band.
Short setup:
Price is in long-term downtrend, you can use 200 EMA as a major trend approximation - price shall be below it.
Open short trade when price touches the Upper Band.
Set the initial stop-loss at the fixed percentage above entry price. Choose this percentage number with your personal risk/money management, you shall be comfortable to lose this amount of money in case of stop-loss hit.
If price reached Middle Band set stop-loss at breakeven.
Close trade when price reached the Lower Band.
🧪 Important: the most common approach to close trades is the Middle Band touch, this is classic mean reversion. We experimented multiple times with different approached and revealed that usually it's better to take profit at the Upper/Lower band for long/short trades and use Middle Band only for setting stop-loss at breakeven. This approach provides better risk to reward ratio.
📈Long Trading Strategy Example
1. Price candle shall be closed above 200-period EMA. In our example we have BITMART:BTCUSDT.P 4h time frame.
2. Open long trade the Lower Band.
3. Put Initial stop-loss 2% below the entry price.
4. When price reached Middle band place stop-loss at the breakeven.
5. Close long trade at the Upper Band.
📉Short trading strategy example
1. Price candle shall be closed below 200-period EMA. In our example we have BITMART:BTCUSDT.P 4h time frame.
2. Open short trade the Upper Band.
3. Put Initial stop-loss 2% above the entry price.
4. When price reached Middle band place stop-loss at the breakeven.
5. Close short trade at the Lower Band.
🧪 Important tip: notice that initial stop-loss is needed only to avoid disaster in case of price moves strongly against you. This percentage shall give enough space to avoid its reaching too often. Mean reversion strategy provides fast trades with the small average gain, so you shall maintain the high win rate (perfectly above 70%). You have to choose stop-loss based on particular asset volatility.
⚡️Combined Approach: Mean Reversion + Trend Following
Skyrexio made multiple researches about Bollinger Bands strategies and we found that we can receive better gains in combination of different approaches. Mean reversion gives you great entry with discount but you don't need to exit that early. Use the trading stop and allow to gain profit while market is moving in your direction.
This approach you can find in our advanced strategy Bollinger Bands Enhanced Strategy which we shared in 2024. Click on the link to read about it and understand how you can combine best features of this popular indicator.
📚 Conclusion
Bollinger Bands are more than just a volatility indicator — they provide a flexible framework for understanding price dynamics and market conditions. By visualizing the relationship between price and standard deviation around a moving average, traders can gain valuable insights into whether an asset is consolidating, trending, or preparing for a breakout.
The real strength of Bollinger Bands lies in their versatility. They can adapt to different trading styles — whether you’re a short-term scalper, a swing trader, or a long-term position holder. From identifying squeeze setups to riding strong trends or capturing mean reversion moves, BBs offer a strategic edge when used correctly.
However, Bollinger Bands should never be used in isolation. Like any technical tool, they work best when combined with momentum indicators like RSI or MACD, volume analysis, and price action signals. Context is key: a signal that works well in a ranging market may fail during high momentum trends.
Ultimately, Bollinger Bands help traders make more informed, disciplined decisions by clarifying where price stands relative to recent history. When paired with sound risk management and broader market awareness, they become a powerful ally in navigating market uncertainty.