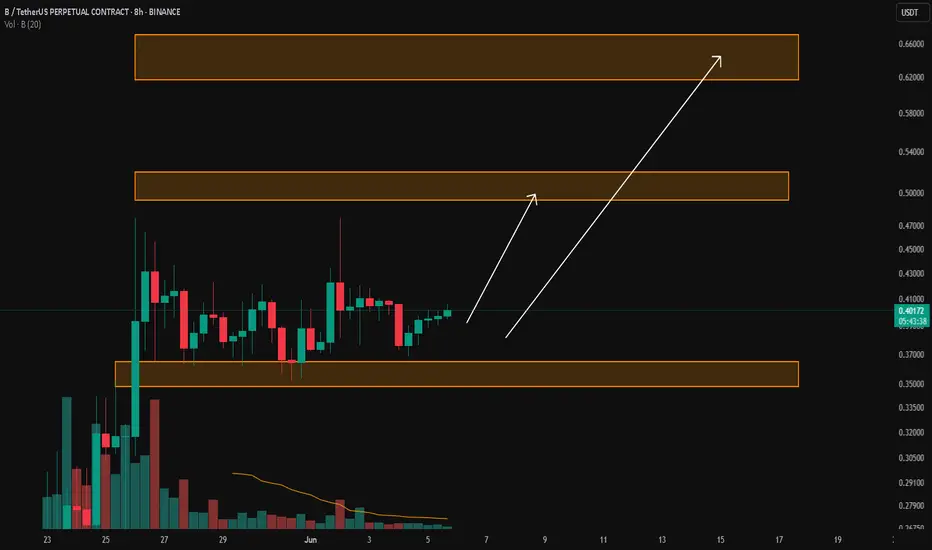
$BUSDT Ready to Explode? Breakout Could Send It Flying#BUSDT is demonstrating strong potential for a pennant breakout.
A successful breakout could trigger a +60% bullish rally in the coming days. 🚀
#Altseason2025
BUSDT.P trade ideas


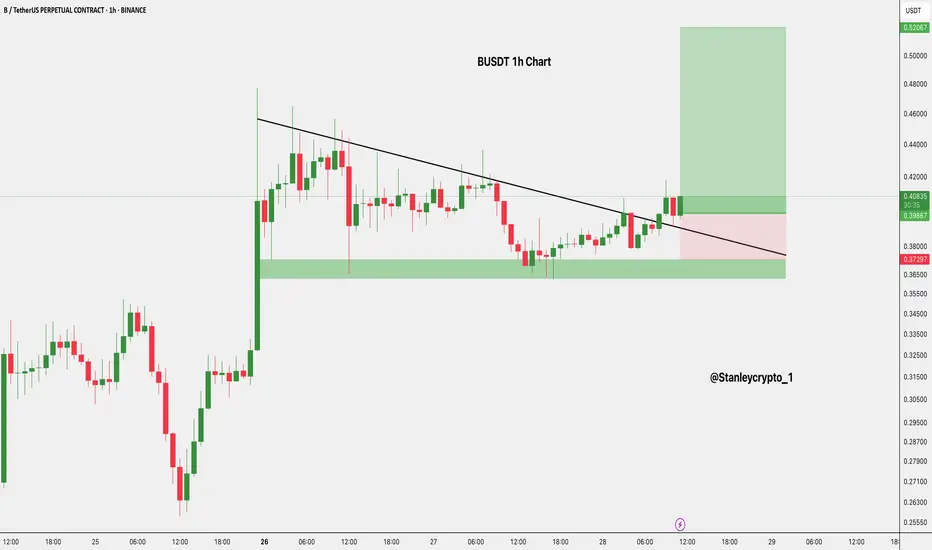
$B Long Setup 1H Chart Price has broken out of the trendline and is retesting the breakout zone
Strong support is seen around the $0.36–$0.37 demand zone.
- Entry: CMP
- Stop Loss: $0.37297
- Targets:
• TP1: $0.44455
• TP2: $0.53243
DYOR | NFA
Busdt Busdt could see an impulsive move up to 0.54 after a brief correction from a previous impulsive move

B/USDT Bullish flagB/USDT has recently formed a textbook bullish flag pattern on the lower timeframes, signaling a continuation of the prior upward move. Price action is currently showing strong momentum after breaking out of the flag consolidation.
a scalp trade targeting $0.50 as the next key resistance level.

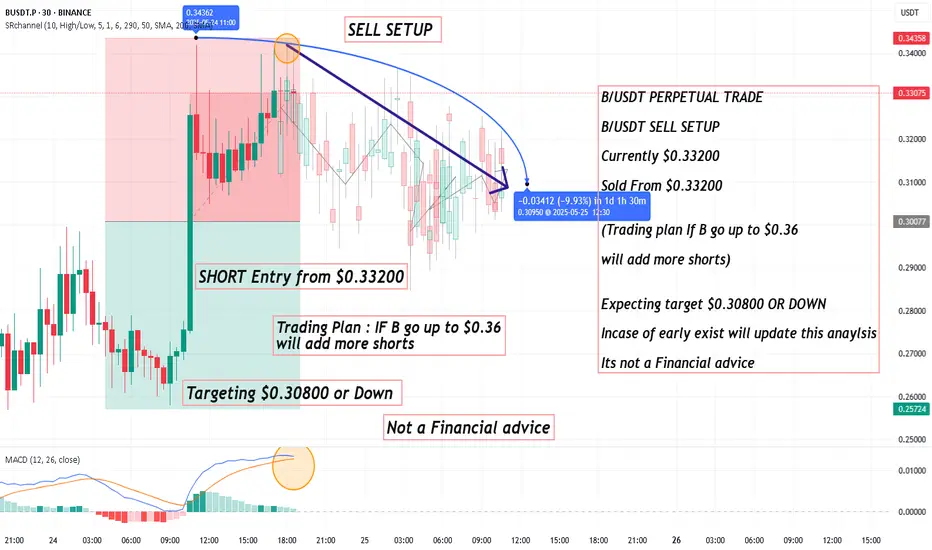
B/USDT PERPETUAL TRADE, Sold From $0.33200B/USDT PERPETUAL TRADE
B/USDT SELL SETUP
Currently $0.33200
Sold From $0.33200
(Trading plan If B go up to $0.36
will add more shorts)
Expecting target $0.30800 OR DOWN
Incase of early exist will update this anaylsis
Its not a Financial advice
Maybe your biggest risk is your biggest chance !!!The price, after this potential increase, needs some correction to the Fibonacci lines.
Give me some energy !!
✨We spend hours finding potential opportunities and writing useful ideas, we would be happy if you support us.
Best regards CobraVanguard.💚
_ _ _ _ __ _ _ _ _ _ _ _ _ _ _ _ _ _ _ _ _ _ _ _ _ _ _ _ _ _ _ _
✅Thank you, and for more ideas, hit ❤️Like❤️ and 🌟Follow🌟!
⚠️Things can change...
The markets are always changing and even with all these signals, the market changes tend to be strong and fast!!

B/USDTKey Level Zone: 0.34850 - 0.36500
HMT v8.1 detected. The setup looks promising, supported by a previous upward/downward trend with increasing volume and momentum, presenting an excellent reward-to-risk opportunity.
HMT (High Momentum Trending):
HMT is based on trend, momentum, volume, and market structure across multiple timeframes. It highlights setups with strong potential for upward movement and higher rewards.
Whenever I spot a signal for my own trading, I’ll share it. Please note that conducting a comprehensive analysis on a single timeframe chart can be quite challenging and sometimes confusing. I appreciate your understanding of the effort involved.
Important Note :
Role of Key Levels:
- These zones are critical for analyzing price trends. If the key level zone holds, the price may continue trending in the expected direction. However, momentum may increase or decrease based on subsequent patterns.
- Breakouts: If the key level zone breaks, it signals a stop-out. For reversal traders, this presents an opportunity to consider switching direction, as the price often retests these zones, which may act as strong support-turned-resistance (or vice versa).
My Trading Rules
Risk Management
- Maximum risk per trade: 2.5%.
- Leverage: 5x.
Exit Strategy
Profit-Taking:
- Sell at least 70% on the 3rd wave up (LTF Wave 5).
- Typically, sell 50% during a high-volume spike.
- Adjust stop-loss to breakeven once the trade achieves a 1.5:1 reward-to-risk ratio.
- If the market shows signs of losing momentum or divergence, ill will exit at breakeven.
The market is highly dynamic and constantly changing. HMT signals and target profit (TP) levels are based on the current price and movement, but market conditions can shift instantly, so it is crucial to remain adaptable and follow the market's movement.
If you find this signal/analysis meaningful, kindly like and share it.
Thank you for your support~
Sharing this with love!
HMT v2.0:
- Major update to the Momentum indicator
- Reduced false signals from inaccurate momentum detection
- New screener with improved accuracy and fewer signals
HMT v3.0:
- Added liquidity factor to enhance trend continuation
- Improved potential for momentum-based plays
- Increased winning probability by reducing entries during peaks
HMT v3.1:
- Enhanced entry confirmation for improved reward-to-risk ratios
HMT v4.0:
- Incorporated buying and selling pressure in lower timeframes to enhance the probability of trending moves while optimizing entry timing and scaling
HMT v4.1:
- Enhanced take-profit (TP) target by incorporating market structure analysis
HMT v5 :
Date: 23/01/2025
- Refined wave analysis for trending conditions
- Incorporated lower timeframe (LTF) momentum to strengthen trend reliability
- Re-aligned and re-balanced entry conditions for improved accuracy
HMT v6 :
Date : 15/02/2025
- Integrated strong accumulation activity into in-depth wave analysis
HMT v7 :
Date : 20/03/2025
- Refined wave analysis along with accumulation and market sentiment
HMT v8 :
Date : 16/04/2025
- Fully restructured strategy logic
HMT v8.1 :
Date : 18/04/2025
- Refined Take Profit (TP) logic to be more conservative for improved win consistency
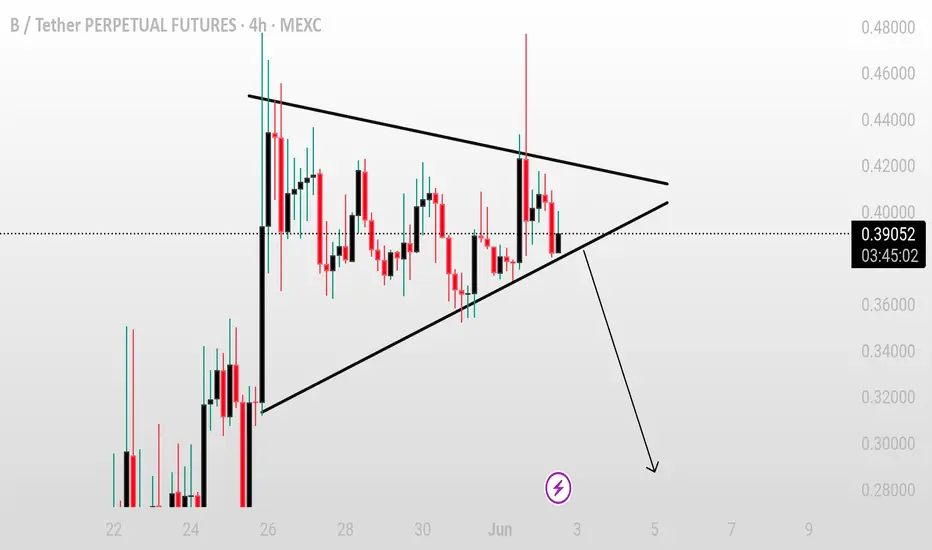
BUSDT/USDT – Symmetrical Triangle Breakdown SetupBUSDT/USDT – Symmetrical Triangle Breakdown Setup
BUSDT is currently trading within a symmetrical triangle pattern on the 4H timeframe, indicating price compression and a possible breakout or breakdown ahead. The price is now hovering near the lower trendline, and pressure is building up.
A clean breakdown below the support trendline with volume could confirm bearish continuation, opening the door for further downside. The projected move, if breakdown confirms, could lead price towards the next key support zones.
**Key Points:**
* Triangle formation tightening
* Watch for 4H candle close below the support line
* Breakdown confirmation could trigger a short setup
Keep this pair on your radar — confirmation and volume are key to validating the move.
$BUSDT Trade Setup 1HMEXC:BUSDT Trade Setup (1H)
Entry: CMP
SL: $0.37796
TP: $0.47400 / $0.53300
Setup: Breakout above trendline with strong support at $0.37313.
Needs 1H close above $0.41 for confirmation.
DYRO, NFA
