$BUSDT Ready to Explode? Breakout Could Send It Flying#BUSDT is demonstrating strong potential for a pennant breakout.
A successful breakout could trigger a +60% bullish rally in the coming days. 🚀
#Altseason2025


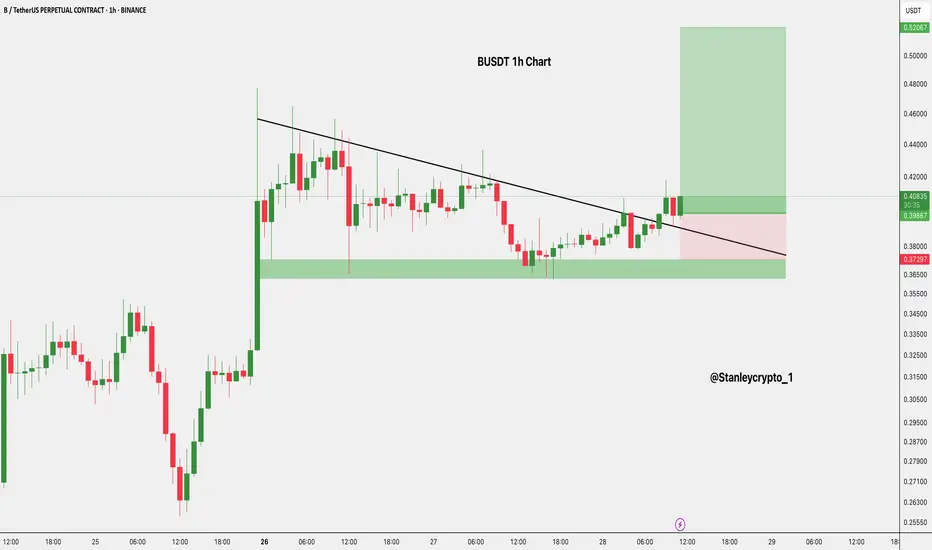
$B Long Setup 1H Chart Price has broken out of the trendline and is retesting the breakout zone
Strong support is seen around the $0.36–$0.37 demand zone.
- Entry: CMP
- Stop Loss: $0.37297
- Targets:
• TP1: $0.44455
• TP2: $0.53243
DYOR | NFA
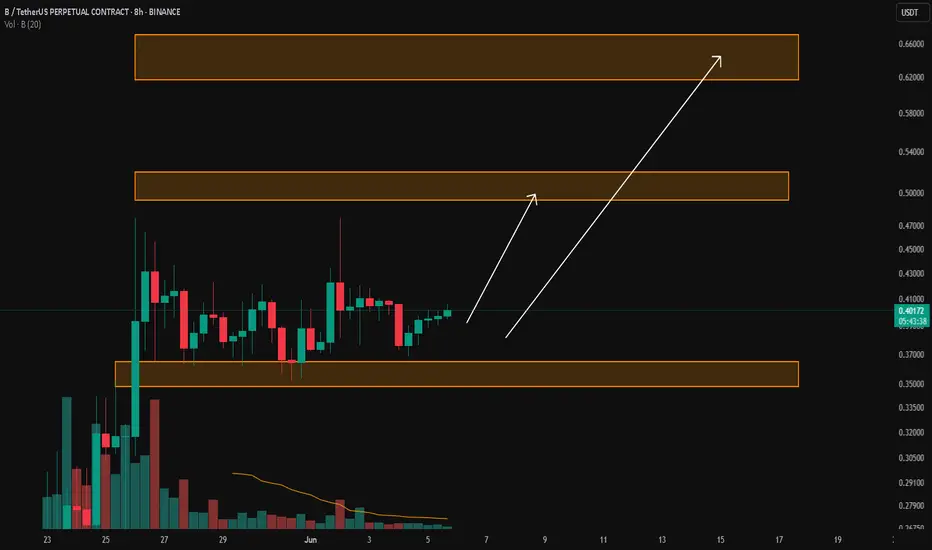
Busdt Busdt could see an impulsive move up to 0.54 after a brief correction from a previous impulsive move

B/USDT Bullish flagB/USDT has recently formed a textbook bullish flag pattern on the lower timeframes, signaling a continuation of the prior upward move. Price action is currently showing strong momentum after breaking out of the flag consolidation.
a scalp trade targeting $0.50 as the next key resistance level.

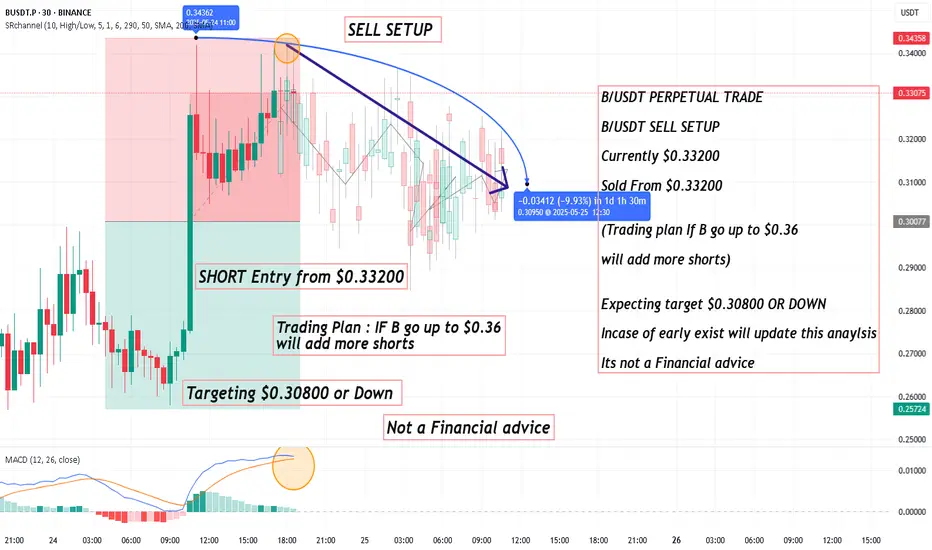
B/USDT PERPETUAL TRADE, Sold From $0.33200B/USDT PERPETUAL TRADE
B/USDT SELL SETUP
Currently $0.33200
Sold From $0.33200
(Trading plan If B go up to $0.36
will add more shorts)
Expecting target $0.30800 OR DOWN
Incase of early exist will update this anaylsis
Its not a Financial advice
Maybe your biggest risk is your biggest chance !!!The price, after this potential increase, needs some correction to the Fibonacci lines.
Give me some energy !!
✨We spend hours finding potential opportunities and writing useful ideas, we would be happy if you support us.
Best regards CobraVanguard.💚
_ _ _ _ __ _ _ _ _ _ _ _ _ _ _ _ _ _ _ _ _ _ _

B/USDTKey Level Zone: 0.34850 - 0.36500
HMT v8.1 detected. The setup looks promising, supported by a previous upward/downward trend with increasing volume and momentum, presenting an excellent reward-to-risk opportunity.
HMT (High Momentum Trending):
HMT is based on trend, momentum, volume, and market s
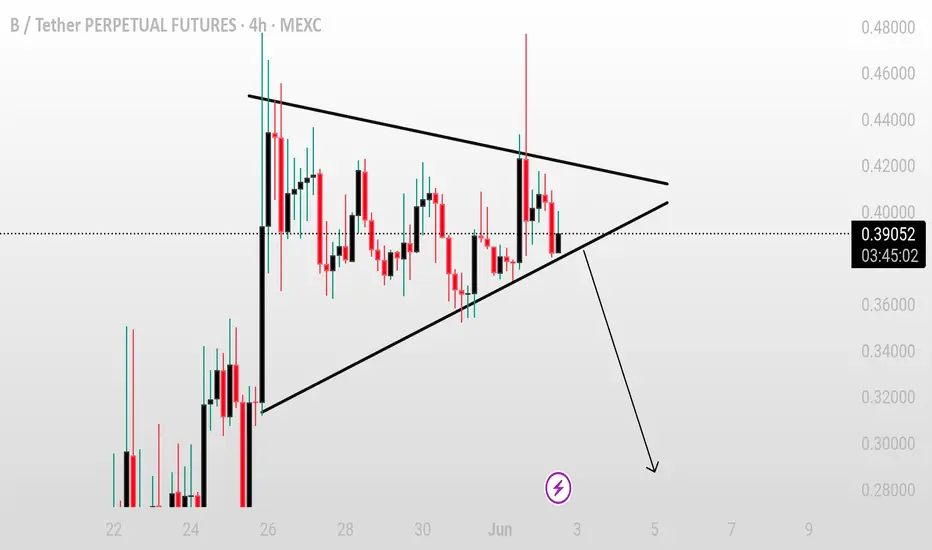
BUSDT/USDT – Symmetrical Triangle Breakdown SetupBUSDT/USDT – Symmetrical Triangle Breakdown Setup
BUSDT is currently trading within a symmetrical triangle pattern on the 4H timeframe, indicating price compression and a possible breakout or breakdown ahead. The price is now hovering near the lower trendline, and pressure is building up.
A clean
$BUSDT Trade Setup 1HMEXC:BUSDT Trade Setup (1H)
Entry: CMP
SL: $0.37796
TP: $0.47400 / $0.53300
Setup: Breakout above trendline with strong support at $0.37313.
Needs 1H close above $0.41 for confirmation.
DYRO, NFA

See all ideas
Summarizing what the indicators are suggesting.
Oscillators
Neutral
SellBuy
Strong sellStrong buy
Strong sellSellNeutralBuyStrong buy
Oscillators
Neutral
SellBuy
Strong sellStrong buy
Strong sellSellNeutralBuyStrong buy
Summary
Neutral
SellBuy
Strong sellStrong buy
Strong sellSellNeutralBuyStrong buy
Summary
Neutral
SellBuy
Strong sellStrong buy
Strong sellSellNeutralBuyStrong buy
Summary
Neutral
SellBuy
Strong sellStrong buy
Strong sellSellNeutralBuyStrong buy
Moving Averages
Neutral
SellBuy
Strong sellStrong buy
Strong sellSellNeutralBuyStrong buy
Moving Averages
Neutral
SellBuy
Strong sellStrong buy
Strong sellSellNeutralBuyStrong buy
Related pairs
Frequently Asked Questions
The current price of BUSDT SPOT (B) is 0.37983 USDT — it has risen 1.91% in the past 24 hours. Try placing this info into the context by checking out what coins are also gaining and losing at the moment and seeing B price chart.
BUSDT SPOT price has risen by 6.28% over the last week, its month performance shows a 1.91 K% increase, and as for the last year, BUSDT SPOT has increased by 1.80 K%. See more dynamics on B price chart.
Keep track of coins' changes with our Crypto Coins Heatmap.
Keep track of coins' changes with our Crypto Coins Heatmap.
BUSDT SPOT (B) reached its highest price on May 25, 2025 — it amounted to 0.46997 USDT. Find more insights on the B price chart.
See the list of crypto gainers and choose what best fits your strategy.
See the list of crypto gainers and choose what best fits your strategy.
BUSDT SPOT (B) reached the lowest price of 0.02000 USDT on May 22, 2025. View more BUSDT SPOT dynamics on the price chart.
See the list of crypto losers to find unexpected opportunities.
See the list of crypto losers to find unexpected opportunities.
The safest choice when buying B is to go to a well-known crypto exchange. Some of the popular names are Binance, Coinbase, Kraken. But you'll have to find a reliable broker and create an account first. You can trade B right from TradingView charts — just choose a broker and connect to your account.
BUSDT SPOT (B) is just as reliable as any other crypto asset — this corner of the world market is highly volatile. Today, for instance, BUSDT SPOT is estimated as 21.15% volatile. The only thing it means is that you must prepare and examine all available information before making a decision. And if you're not sure about BUSDT SPOT, you can find more inspiration in our curated watchlists.
You can discuss BUSDT SPOT (B) with other users in our public chats, Minds or in the comments to Ideas.