Key stats
About ISHARES CORE S&P 500 UCITS ETF
Home page
Inception date
May 19, 2010
Structure
Irish VCIC
Replication method
Physical
Dividend treatment
Capitalizes
Primary advisor
BlackRock Asset Management Ireland Ltd.
ISIN
IE00B5BMR087
The investment objective of the Fund is to deliver the net total return performance of the Benchmark Index (being the S&P 500 Index), less the fees and expenses of the Fund.
Related funds
Classification
What's in the fund
Exposure type
Technology Services
Electronic Technology
Finance
Stock breakdown by region
Top 10 holdings

SXR8 BEARISH ETFEMA 24 (Monthly) Acting as a dynamic recent price support
EMA 50 (Monthly) Acting as a dynamic support
Confluences: May 21 low and -0.27 fibbonacci
Rejecting 0.618 fibb line
Structure flag - A breakdown below the lower boundary of the channel could trigger this idea.

Double hit on upcoming EURO investements. A short comparison of the SP500 Index with the SP500 ETF traded in EUR.
Due to the weakness of the EUR, the ability to profit from lower SP500 prices is substantially reduced.
Inflation and weakness of the EUR is killing the cash deposits in the Euro Zone.
You can thank the ECB.

A bit of a short-term relief on the S&P?The divergence played out well, but no long signals so far. Maybe just a temporary relief and then down again.
Let's wait an see if RSI breaks through the 50 resistance level.

Low Cost Index Funds and the "bubble"As the majority of the investment community is aware, low cost index funds such as the iShares CSPX are a great way of investing your money in such a way that it will beat inflation and any other factors that will reduce the overall value of your money. Warren Buffett (CEO of Berkshire Hathaway) is

Don't try to be smart, just buy regularly an Index :)Forget stock picking, Timing the market, etc. Just buy regularly (during decades) a broad index fund and you should not do bad :)


SP500 (GBP-hedged) - still bullishThe correction that began in May and finished in October of last year is tricky and I have no idea if my count is even close to being correct but whichever way I look at this I end up bullish. To me, it's just a question of how deep the present correction will take before this index resumes it's pa

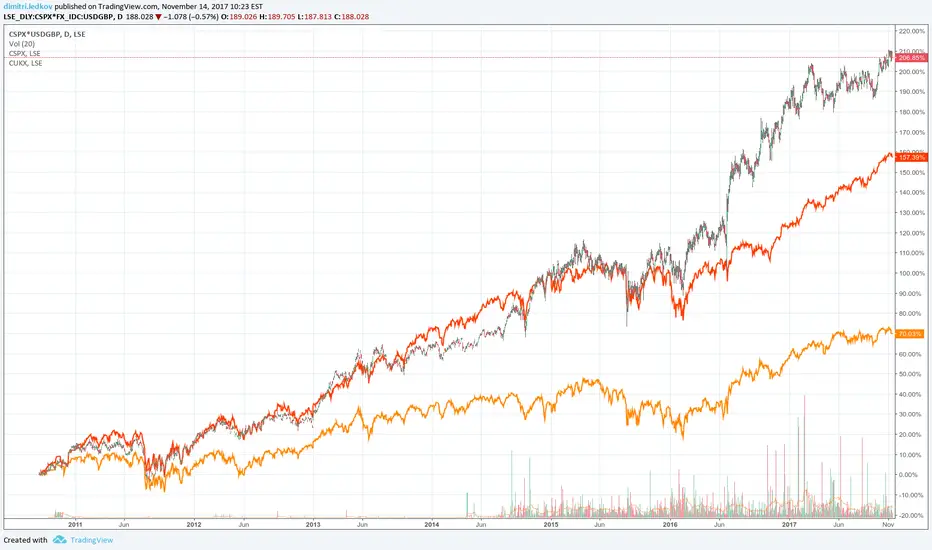
SPX investing in GBPCompare investing in a S&P 500 ETF, for an investor based in GBP currency. With dividends reinvested.
vs S&P500 ETF tracked in USD
vs FTSE100 ETF tracked in GBP
For comparison, how much returns are due to underlying vs currency effects.
See all ideas
Summarizing what the indicators are suggesting.
Oscillators
Neutral
SellBuy
Strong sellStrong buy
Strong sellSellNeutralBuyStrong buy
Oscillators
Neutral
SellBuy
Strong sellStrong buy
Strong sellSellNeutralBuyStrong buy
Summary
Neutral
SellBuy
Strong sellStrong buy
Strong sellSellNeutralBuyStrong buy
Summary
Neutral
SellBuy
Strong sellStrong buy
Strong sellSellNeutralBuyStrong buy
Summary
Neutral
SellBuy
Strong sellStrong buy
Strong sellSellNeutralBuyStrong buy
Moving Averages
Neutral
SellBuy
Strong sellStrong buy
Strong sellSellNeutralBuyStrong buy
Moving Averages
Neutral
SellBuy
Strong sellStrong buy
Strong sellSellNeutralBuyStrong buy
Displays a symbol's price movements over previous years to identify recurring trends.
Frequently Asked Questions
An exchange-traded fund (ETF) is a collection of assets (stocks, bonds, commodities, etc.) that track an underlying index and can be bought on an exchange like individual stocks.
CSPX trades at 2,602,000 COP today, its price has risen 0.91% in the past 24 hours. Track more dynamics on CSPX price chart.
CSPX net asset value is 2,596,401.22 today — it's fallen 1.87% over the past month. NAV represents the total value of the fund's assets less liabilities and serves as a gauge of the fund's performance.
CSPX assets under management is 466.63 T COP. AUM is an important metric as it reflects the fund's size and can serve as a gauge of how successful the fund is in attracting investors, which, in its turn, can influence decision-making.
CSPX price has risen by 0.53% over the last month, and its yearly performance shows a 7.82% increase. See more dynamics on CSPX price chart.
NAV returns, another gauge of an ETF dynamics, have risen by −1.87% over the last month, have fallen by −1.87% over the last month, showed a 3.86% increase in three-month performance and has increased by 7.70% in a year.
NAV returns, another gauge of an ETF dynamics, have risen by −1.87% over the last month, have fallen by −1.87% over the last month, showed a 3.86% increase in three-month performance and has increased by 7.70% in a year.
CSPX fund flows account for 66.09 T COP (1 year). Many traders use this metric to get insight into investors' sentiment and evaluate whether it's time to buy or sell the fund.
Since ETFs work like an individual stock, they can be bought and sold on exchanges (e.g. NASDAQ, NYSE, EURONEXT). As it happens with stocks, you need to select a brokerage to access trading. Explore our list of available brokers to find the one to help execute your strategies. Don't forget to do your research before getting to trading. Explore ETFs metrics in our ETF screener to find a reliable opportunity.
CSPX invests in stocks. See more details in our Analysis section.
CSPX expense ratio is 0.07%. It's an important metric for helping traders understand the fund's operating costs relative to assets and how expensive it would be to hold the fund.
No, CSPX isn't leveraged, meaning it doesn't use borrowings or financial derivatives to magnify the performance of the underlying assets or index it follows.
In some ways, ETFs are safe investments, but in a broader sense, they're not safer than any other asset, so it's crucial to analyze a fund before investing. But if your research gives a vague answer, you can always refer to technical analysis.
Today, CSPX technical analysis shows the sell rating and its 1-week rating is buy. Since market conditions are prone to changes, it's worth looking a bit further into the future — according to the 1-month rating CSPX shows the buy signal. See more of CSPX technicals for a more comprehensive analysis.
Today, CSPX technical analysis shows the sell rating and its 1-week rating is buy. Since market conditions are prone to changes, it's worth looking a bit further into the future — according to the 1-month rating CSPX shows the buy signal. See more of CSPX technicals for a more comprehensive analysis.
No, CSPX doesn't pay dividends to its holders.
CSPX trades at a premium (0.22%).
Premium/discount to NAV expresses the difference between the ETF’s price and its NAV value. A positive percentage indicates a premium, meaning the ETF trades at a higher price than the calculated NAV. Conversely, a negative percentage indicates a discount, suggesting the ETF trades at a lower price than NAV.
Premium/discount to NAV expresses the difference between the ETF’s price and its NAV value. A positive percentage indicates a premium, meaning the ETF trades at a higher price than the calculated NAV. Conversely, a negative percentage indicates a discount, suggesting the ETF trades at a lower price than NAV.
CSPX shares are issued by BlackRock, Inc.
CSPX follows the S&P 500. ETFs usually track some benchmark seeking to replicate its performance and guide asset selection and objectives.
The fund started trading on May 19, 2010.
The fund's management style is passive, meaning it's aiming to replicate the performance of the underlying index by holding assets in the same proportions as the index. The goal is to match the index's returns.