F trade ideas

🟢 Idea about FordAfter gaining 60% in less than two months, the instrument is not allowed to roll back. Buyers are "sitting" in the action. The instrument is approaching the local maximum with the closing of the daily candles at the rising highs; in general, it looks long. Entry from the low of the last daily candle at $ 19.5, stop at $ 19.14, risk 2%.
Target 8% (speculative).
NOT IRR.

(F) Ford sitting in consolidation, looking to break a wedge. Scenario 1: The pivot trend continue with a break out of consolidation and out of its current wedge.
Scenario 2: The wedge breaks down and finds support on the prior trend
Scenario 3: Consolidation continues and the wedge is broken to meet support and continue on a bull run
Scenario 4: Wedge breaks down, support is broken, and a reversal in trend is confirmed.

Ford is Bearish. FDivergence, Elliott flat in progress, negative momentum and fractally correcting.
We are not in the business of getting every prediction right, no one ever does and that is not the aim of the game. The Fibonacci targets are highlighted in purple with invalidation in red. Fibonacci goals, it is prudent to suggest, are nothing more than mere fractally evident and therefore statistically likely levels that the market will go to. Having said that, the market will always do what it wants and always has a mind of its own. Therefore, none of this is financial advice, so do your own research and rely only on your own analysis. Trading is a true one man sport. Good luck out there and stay safe!

Flooks like a lot of these older stocks are poised for a break out in the coming weeks
follow the money to get to the treasure
i'm eyeing $20 as a target for my trade

FordFord Motor Company is an American multinational automobile manufacturer headquartered in Dearborn, Michigan, United States. It was founded by Henry Ford and incorporated on June 16, 1903. The company sells automobiles and commercial vehicles under the Ford brand, and luxury cars under its Lincoln luxury brand.Wikipedia

Ford is turning around. FIt appears like Wave 5 of a major impulse has finished growing. We are looking for a turnaround confirm, and are trading off what we see as Wave 5 first. If that falls, more short positions may be placed by us in that instance. Bearish outlook for this one.
We are not in the business of getting every prediction right, no one ever does and that is not the aim of the game. The Fibonacci targets are highlighted in purple with invalidation in red. Fibonacci goals, it is prudent to suggest, are nothing more than mere fractally evident and therefore statistically likely levels that the market will go to. Having said that, the market will always do what it wants and always has a mind of its own. Therefore, none of this is financial advice, so do your own research and rely only on your own analysis. Trading is a true one man sport. Good luck out there and stay safe!

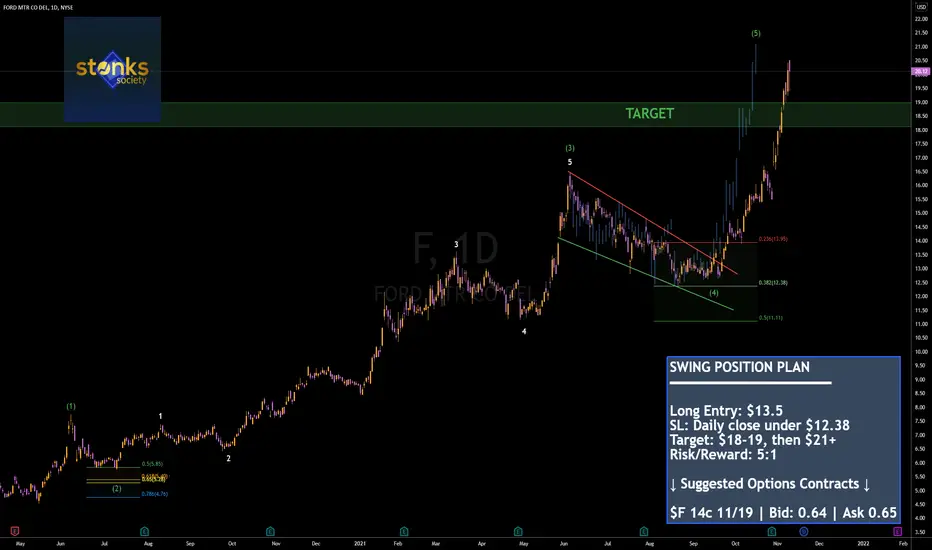
$F | UPDATEWe have successfully predicted this ENTIRE move since the initial falling wedge breakout resulting in a 56% move on the stock.
If you took the suggested options play, here are the potential gains: F 14C 11/19 @0.65 -> 6.0 or over 800% gain!
Congrats if you played.
F Crossing 20.25 Tons of flo and dark pool orders.F Crossing 20.25
Tons of flo and dark pool orders.

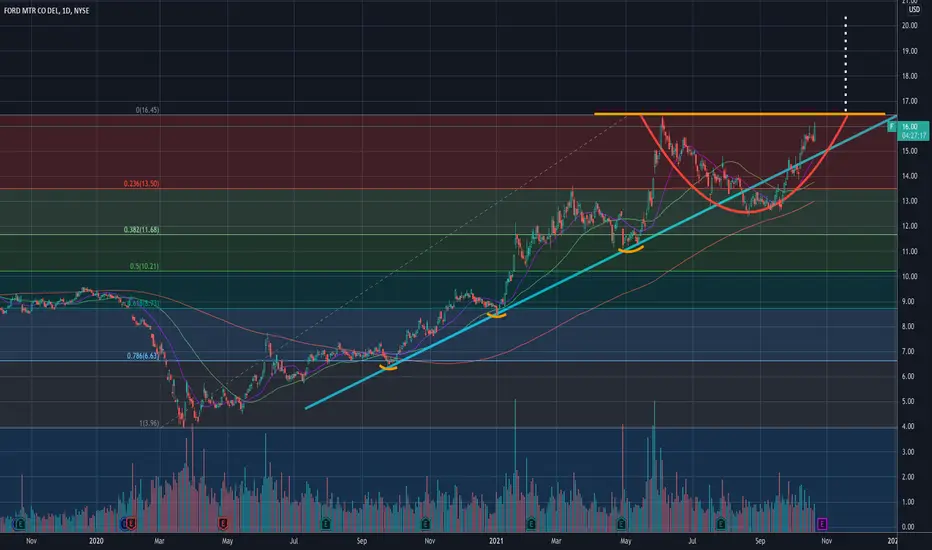
$F - Forming cup! Target $20Ford is right now forming a cup. Breaking above the prior high of 16.43 could send the stock to $20!
Which co-insides with the credit susie's analyst's new target price. Perhaps he did it based on technicals as well? :)
Target - $20
———————————————————
How to read my charts?
- Matching color trend lines shows the pattern. Sometimes a chart can have multiple patterns. Each pattern will have matching color trend lines.
- The yellow horizontal lines shows support and resistance areas.
- Fib lines also shows support and resistance areas.
- The dotted white lines shows price projection for breakout or breakdown target.
Disclaimer: Do your own DD. Not an investment advice.
$F Elliott wave scenario 2This is my brief count 2nd count of 2 scenarios with extensions and pitchfork/// If you have any questions just ask : )
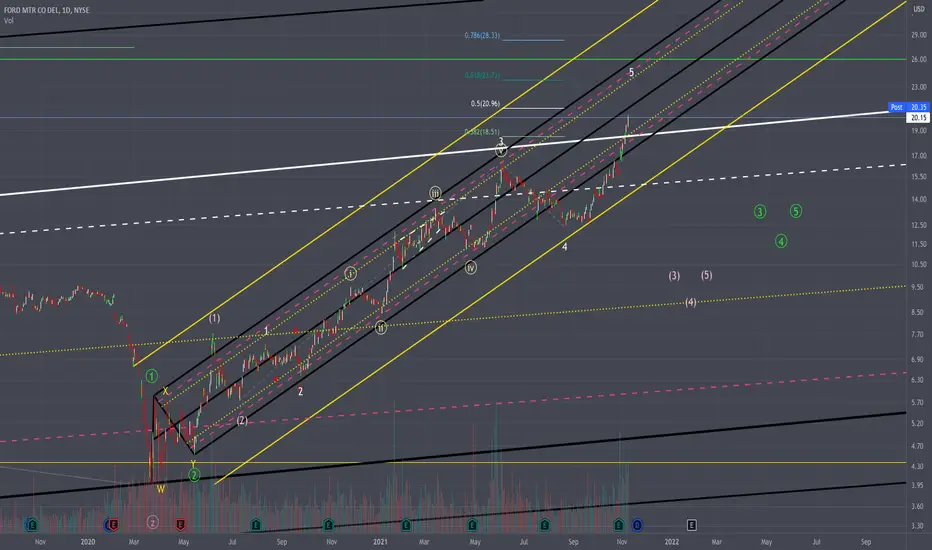
$F Elliott wave count (1)This is my brief count 1st count of 2 scenarios with extensions and pitchfork/// If you have any questions just ask : )

Ford Analysis 08.11.2021Hello Traders,
welcome to this free and educational analysis.
I am going to explain where I think this asset is going to go over the next few days and weeks and where I would look for trading opportunities.
If you have any questions or suggestions which asset I should analyse tomorrow, please leave a comment below.
If you enjoyed this analysis, I would definitely appreciate it, if you smash that like button.
Thank you for watching and I will see you tomorrow!

Ford (Weekly) Wave 5Increased volume during wave 5 suggests an extension to 1.618 is likely. I expect the end of wave 5 to mark the end of wave 1 of a motive wave of one larger degree, which should be followed by a zig zag correction and then an even more powerful motive wave for wave 3. Analysis is based entirely on Elliott's Wave Theory.

Ford Motor Co. (F) Overall Macro Trends & Bullish Case for ATHsThis a fairly long video on Ford Motor Company NYSE:F and the overall macro trends I see in its market. I am long on Ford and this is my bullish case-video and DD. I hope you enjoy! NYSE:F . This is also my first voice over video, so please be kind and let me know if there is ANYTHING you disagree with on the charting aspect of the video or otherwise.
Identified:
1. Falling Wedge
2. Ascending Rising Channel
3. Ascending Broadening Wedge
4. Levels of Support
5. Levels of Resistance
6. Breakout Zones
7. Overall Options-Chain Sentiment
Tools Used:
1. Trading View
2. Google
3. Unusual Whales
4. www.ford.com
5. My brain
Indicators Used:
1. Weekly Candles to find levels of support and resistance - keeping it simple
Could Ford be on the verge of a breakout? How is Ford fitting itself into the EV future? What does the big money say about Ford?
After careful study of Ford NYSE:F I have come to a bullish conclusion that this stock is getting very close to all time highs. There are 3 major overall macro BULLISH patterns at play that I have highlighted in my video.
1. Falling Wedge
2. Ascending Rising Channel
3. Ascending Broadening Wedge
NYSE:F
We are possibly about to enter into a breakout zone with NYSE:F as a Broadening Wedge breakout is forming right now. This Broadening Wedge breakout could propel Ford out of its Ascending Channel, which itself was used to thrust Ford out of its Falling Wedge. This is my mind is BULLISH. Please watch the video for more details on my case of Ford reaching new ATH and when that could potentially happen. Any feedback is greatly welcomed!
I am long on Ford F

Ford Motor Company Overall MacrotrendsIdentified:
1. Falling Wedge
2. Ascending Rising Channel
3. Ascending Broadening Wedge
4. Levels of Support
5. Levels of Resistance

$F Ford loves cup pattern. $F Cup pattern. Next week it will be good for healthy price movement to 22$ price zone if a short consolidation period may occur.

FORDAnalyst downgraded to 13
Ford says lets see $20 first.
swing trade entered on 11/1
35 contracts exp 11/5 $20 strike cost is .02 each :)
I have shares that im holding long term at about $13 average
breaking a 20 year downtrend !

Look at FordWas challenged by a friend to take a look at Ford. With the objective to get more at bats and better at analyzing these graphs I thought I'd take a swing. In short, I see a drop coming here soon. The cycles appear to have averaged around 130 days since May. Ford is at an ATH right now with around 87 days left in the cycle. The downward trend always appears to be longer than the spike. With its current place in the cycle I expect our downward trend should be starting here soon. Again, this is me homing in on the skill. If you have any feedback or tools that I could have used to speed this up or be more accurate I would love feedback.

F: Imagine buying Ford in 1996Ford is on a strong bull run and should hit 18.30 soon but more interesting is monthly chart that shows Ford has broken out of it's 30 years long bearish trend! So how is this relevant? This fact tells us that this run has the potential to hit 26 and 40 at some point. But the short term goal is 18.3 and we are on target. Is there going to be some pull backs, absolutely. But not to our current prices. I'm predicting that Ford might cool off after passing 18 and settle around 16 before it's next mega run. Also checkout that GOLDEN cross on weekly that's about to happen and shoot this ticker up to the sky.

F to $20 as mentioned. Get in during a dip for $25Great continuation since the breakout. It has long way to go.

Ford correctionthere will be a potential zone for a good correction in the major ascending trend ...

Ford New all time highs. Ford has been a successful investment for me as i have seen very good gains both in stocks and option calls. The daily chart shows a very bullish scenario and if you look closely you can see the cup with handle pattern which played out perfectly. I believe in Ford as the current shift to EVs will benefit the company for the long run. Great earnings and with the dividend coming back this will see more volume. Price target for me is 20 dollars and definitely see this going higher with EVs being a big focus for the administration, and that electric F150 sure looks nice.
