GOOG Put Calendar Spread July 22, 2025GOOG has earnings upcoming and is in the top Bollinger band, daily RSI is 74. With a price target of $185 this trade is profitable between $200 and $172 providing a large target window in a short timeframe. Trade will be a
PUT CALENDAR SPREAD
GOOG 8/1 $185P +1
GOOG 7/25 $185P -1
MAX LOSS -$71
MAX
Key facts today
Next report date
—
Report period
—
EPS estimate
—
Revenue estimate
—
38,660 COP
441.05 T COP
1,541.00 T COP
5.80 B
About Alphabet Inc (Google) Class C
Sector
Industry
CEO
Sundar Pichai
Website
Headquarters
Mountain View
Founded
2015
FIGI
BBG01P120PQ3
Alphabet, Inc is a holding company, which engages in the business of acquisition and operation of different companies. It operates through the Google and Other Bets segments. The Google segment includes its main Internet products such as ads, Android, Chrome, hardware, Google Cloud, Google Maps, Google Play, Search, and YouTube. The Other Bets segment consists of businesses such as Access, Calico, CapitalG, GV, Verily, Waymo, and X. The company was founded by Lawrence E. Page and Sergey Mikhaylovich Brin on October 2, 2015 and is headquartered in Mountain View, CA.
Related stocks

Alphabet (GOOGL) Stock Chart Analysis Following Earnings ReleaseAlphabet (GOOGL) Stock Chart Analysis Following Earnings Release
Earlier this week, we highlighted the prevailing bullish sentiment in the market ahead of Alphabet’s (GOOGL) earnings report, noting that:
→ an ascending channel had formed;
→ the psychological resistance level at $200 was of particu
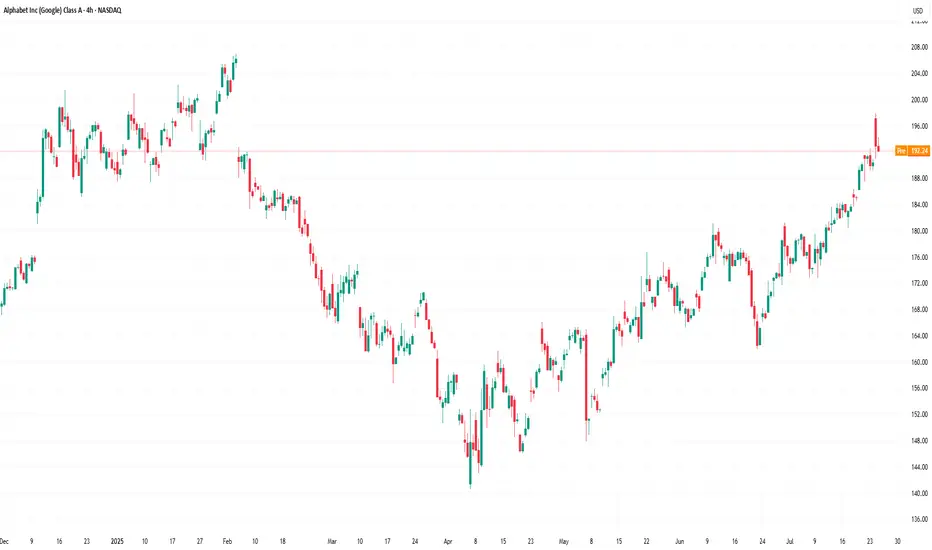
Alphabet (GOOGL) Stock Approaches $200 Ahead of Earnings ReleaseAlphabet (GOOGL) Stock Approaches $200 Ahead of Earnings Release
According to the Alphabet (GOOGL) stock chart, the share price rose by more than 2.5% yesterday. Notably:
→ the price reached its highest level since early February 2025;
→ the stock ranked among the top 10 performers in the S&P 500
GOOG Earnings Setup (2025-07-23)
📈 GOOG Earnings Setup (2025-07-23) 🚀
🔥 STRONG BULLISH BIAS – 85% Confidence
Alphabet (GOOG) is set to report after market close. Here’s why this setup is 🔥:
⸻
📊 Fundamental Highlights:
• 💸 TTM Revenue Growth: +12.0%
• 🧾 Profit Margin: 30.9%
• 💯 Earnings Beat Rate: 8/8 last quarters
• 📈 EPS E

Alphabet - The textbook break and retest!📧Alphabet ( NASDAQ:GOOGL ) will head much higher:
🔎Analysis summary:
If we look at the chart of Alphabet we can basically only see green lines. And despite the recent correction of about -30%, Alphabet remains in a very bullish market. Looking at the recent all time high break and retest, the

With price near $190 and strong volume, $200+ looks imminent.🔥 NASDAQ:GOOGL Weekly Chart Signals a Golden Cross
Alphabet’s (GOOG)9-week MA is crossing the 20 and 50-week MA—classic bullish setup. With price near $190 and strong volume, $200+ looks imminent.
💡 Why It’s Climbing:
- AI breakthroughs (Gemini, DeepMind)
- Google Cloud gaining traction
- Big tec

Momentum Watch: GOOG Entry ZoneNASDAQ:GOOG – Trend Continuation Setup
The price has been trending within a clean ascending channel since April 2025.
After a pullback toward the midline and Bollinger basis, price is showing potential support.
Setup:
• Entry: $175 (conceptual)
• Stop: $165.5 (below channel)
• Target: $208 (u

GOOG - Possible Break OutHello Everyone,
Happy Sunday to All.
I would like to make a quick Analyse on GOOG. When i was scanning the stocks,i reliazed that this could be a possible breakout and could be a opportunity to buy.
This looks like a breakout and i am expecting to Re-test trend line which price level 175 $.
Then

Google About to 10x Off Agentic AIAlright, no dashes, just straight talk:
If you believe agentic AI is going to take off and actually become a core part of everyone’s daily life, Google is the best setup out there. They already have the user base, the data, and the infrastructure. Think search, Android, Gmail, YouTube, Maps, Chrome

EOY based on yesterday's earnings and the flywheel effect# Alphabet's Accelerating Flywheel: Q2 2025 Earnings Validate the Strategy
technicals grounded in an anchored pitchfork hinged on the pre-covid levels (covid bottom just makes the path too aggressive for EOY) and fib retracements of the 2022 bear market decline. General and simple targets since m

See all ideas
Summarizing what the indicators are suggesting.
Neutral
SellBuy
Strong sellStrong buy
Strong sellSellNeutralBuyStrong buy
Neutral
SellBuy
Strong sellStrong buy
Strong sellSellNeutralBuyStrong buy
Neutral
SellBuy
Strong sellStrong buy
Strong sellSellNeutralBuyStrong buy
An aggregate view of professional's ratings.
Neutral
SellBuy
Strong sellStrong buy
Strong sellSellNeutralBuyStrong buy
Neutral
SellBuy
Strong sellStrong buy
Strong sellSellNeutralBuyStrong buy
Neutral
SellBuy
Strong sellStrong buy
Strong sellSellNeutralBuyStrong buy
Displays a symbol's price movements over previous years to identify recurring trends.
US2079KAF4
ALPHABET 20/50Yield to maturity
7.07%
Maturity date
Aug 15, 2050
US2079KAG2
ALPHABET 20/60Yield to maturity
6.94%
Maturity date
Aug 15, 2060
US2079KAE7
ALPHABET 20/40Yield to maturity
6.30%
Maturity date
Aug 15, 2040
GOOG6065579
Alphabet Inc. 5.3% 15-MAY-2065Yield to maturity
5.55%
Maturity date
May 15, 2065
GOOG6065578
Alphabet Inc. 5.25% 15-MAY-2055Yield to maturity
5.46%
Maturity date
May 15, 2055
GOOG6065581
Alphabet Inc. 4.5% 15-MAY-2035Yield to maturity
4.78%
Maturity date
May 15, 2035
GOOG5025299
Alphabet Inc. 0.45% 15-AUG-2025Yield to maturity
4.53%
Maturity date
Aug 15, 2025
US2079KAD9
ALPHABET 20/30Yield to maturity
4.48%
Maturity date
Aug 15, 2030
US2079KAC1
ALPHABET 16/26Yield to maturity
4.31%
Maturity date
Aug 15, 2026
XS306443038
ALPHABET 25/54Yield to maturity
4.19%
Maturity date
May 6, 2054
US2079KAJ6
ALPHABET 20/27Yield to maturity
4.07%
Maturity date
Aug 15, 2027
See all GOOGL bonds
Curated watchlists where GOOGL is featured.


Frequently Asked Questions
The current price of GOOGL is 798,500 COP — it has increased by 1.59% in the past 24 hours. Watch Alphabet Inc (Google) Class A stock price performance more closely on the chart.
Depending on the exchange, the stock ticker may vary. For instance, on BVC exchange Alphabet Inc (Google) Class A stocks are traded under the ticker GOOGL.
GOOGL stock has risen by 8.24% compared to the previous week, the month change is a 15.26% rise, over the last year Alphabet Inc (Google) Class A has showed a −80.81% decrease.
We've gathered analysts' opinions on Alphabet Inc (Google) Class A future price: according to them, GOOGL price has a max estimate of 1,020,408.16 COP and a min estimate of 653,061.22 COP. Watch GOOGL chart and read a more detailed Alphabet Inc (Google) Class A stock forecast: see what analysts think of Alphabet Inc (Google) Class A and suggest that you do with its stocks.
GOOGL reached its all-time high on Oct 17, 2019 with the price of 4,160,140 COP, and its all-time low was 620,000 COP and was reached on Apr 3, 2025. View more price dynamics on GOOGL chart.
See other stocks reaching their highest and lowest prices.
See other stocks reaching their highest and lowest prices.
GOOGL stock is 2.82% volatile and has beta coefficient of 0.95. Track Alphabet Inc (Google) Class A stock price on the chart and check out the list of the most volatile stocks — is Alphabet Inc (Google) Class A there?
Today Alphabet Inc (Google) Class A has the market capitalization of 9,537.57 T, it has increased by 2.93% over the last week.
Yes, you can track Alphabet Inc (Google) Class A financials in yearly and quarterly reports right on TradingView.
Alphabet Inc (Google) Class A is going to release the next earnings report on Oct 28, 2025. Keep track of upcoming events with our Earnings Calendar.
GOOGL earnings for the last quarter are 9.43 K COP per share, whereas the estimation was 8.91 K COP resulting in a 5.83% surprise. The estimated earnings for the next quarter are 9.51 K COP per share. See more details about Alphabet Inc (Google) Class A earnings.
Alphabet Inc (Google) Class A revenue for the last quarter amounts to 393.58 T COP, despite the estimated figure of 383.82 T COP. In the next quarter, revenue is expected to reach 405.36 T COP.
GOOGL net income for the last quarter is 115.09 T COP, while the quarter before that showed 143.92 T COP of net income which accounts for −20.03% change. Track more Alphabet Inc (Google) Class A financial stats to get the full picture.
Yes, GOOGL dividends are paid quarterly. The last dividend per share was 871.37 COP. As of today, Dividend Yield (TTM)% is 0.42%. Tracking Alphabet Inc (Google) Class A dividends might help you take more informed decisions.
Alphabet Inc (Google) Class A dividend yield was 0.32% in 2024, and payout ratio reached 7.46%. The year before the numbers were 0.00% and 0.00% correspondingly. See high-dividend stocks and find more opportunities for your portfolio.
As of Jul 26, 2025, the company has 183.32 K employees. See our rating of the largest employees — is Alphabet Inc (Google) Class A on this list?
EBITDA measures a company's operating performance, its growth signifies an improvement in the efficiency of a company. Alphabet Inc (Google) Class A EBITDA is 566.78 T COP, and current EBITDA margin is 36.45%. See more stats in Alphabet Inc (Google) Class A financial statements.
Like other stocks, GOOGL shares are traded on stock exchanges, e.g. Nasdaq, Nyse, Euronext, and the easiest way to buy them is through an online stock broker. To do this, you need to open an account and follow a broker's procedures, then start trading. You can trade Alphabet Inc (Google) Class A stock right from TradingView charts — choose your broker and connect to your account.
Investing in stocks requires a comprehensive research: you should carefully study all the available data, e.g. company's financials, related news, and its technical analysis. So Alphabet Inc (Google) Class A technincal analysis shows the buy rating today, and its 1 week rating is buy. Since market conditions are prone to changes, it's worth looking a bit further into the future — according to the 1 month rating Alphabet Inc (Google) Class A stock shows the neutral signal. See more of Alphabet Inc (Google) Class A technicals for a more comprehensive analysis.
If you're still not sure, try looking for inspiration in our curated watchlists.
If you're still not sure, try looking for inspiration in our curated watchlists.