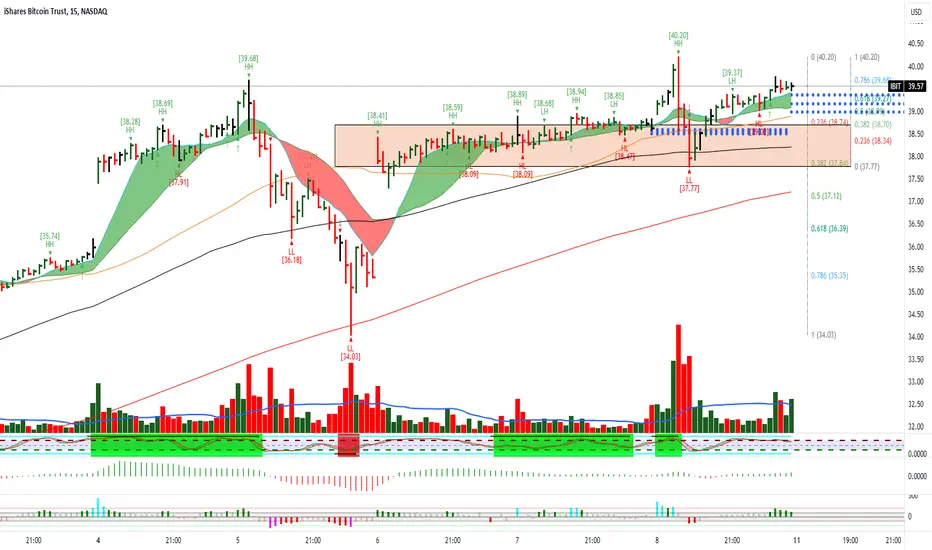
BTC next big move (trade IBIT)Hold zone 39.00 without more downside move - very good pattern for new ATH, but need Plan B - 0.5 Fib zone under like second try to put size. Let see
IBIT trade ideas

$IBIT March 26, 2024NASDAQ:IBIT March 26, 2024
60 Minutes
As expected 35 levels were held.
For the rise from 28.91 to 41.99 35 levels represented about 50% retracement value.
Now formed HL at 35.71 which becomes an important number to hold for the current uptrend.
Consider the fall from 41.99 to 35.41. NASDAQ:IBIT retraced 61.8% and managed to hold the gap up.
Now if we consider the rise from 35.71 to 40.62 holding 38.5 to 39 levels is important as it is a converging of averages 9,21,50 and 100.
Adding around t 38.5 -39 levels on a retracement today should be a good trade as risk is only 35 levels being 200 averages for a target 43 +

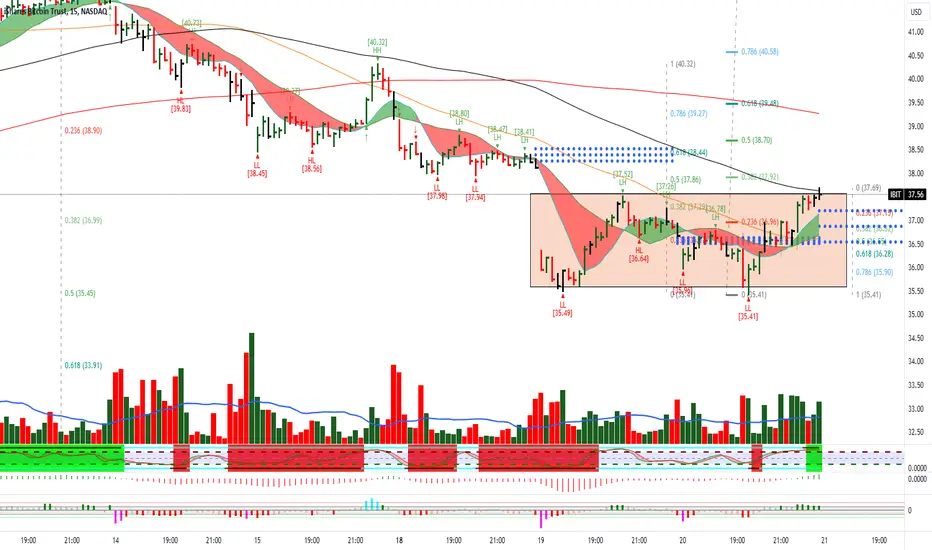
$IBIT March 21, 2024NASDAQ:IBIT March 21, 2024
15 Minutes.
For the rise from 28 to 41.99 levels NASDAQ:IBIT retraced 50%.
The LL at 35.41 made on Wednesday had oscillator divergence.
We have 39.4 levels as 200 averages. That should provide resistance for the current move.
That level is also 61.8 % retracement for the fall from 41.99 to 35.41.
For the day the rise from 35.41 to 37.69, 36-365 levels must hold for the uptrend target 39 - 39.5 levels.
$IBIT March 18, 2024NASDAQ:IBIT March 18, 2024
60 Minutes
Looks like HL, HH pattern is broken.
Also NASDAQ:IBIT too far from moving averages.
At the moment below 9,21 and 50 averages in 60 minute time frame.
I will consider 3 moves.
The rise from 28.91 to 41.99.
The rise from 34.03 to 41.99
The fall from 41.99 to 37.45
for the first rise NASDAQ:IBIT has retraced 23.6 levels. So up trend is intact.
For the second rise NASDAQ:IBIT has retraced 50% of the rise and needs to hold 36-37 levels to continue up trend.
For the fall from 41.99 to 38.45, it retraced to 40.32 which is around 61.8% retracement for the fall.
So buy is only above 42 levels.
Today must cross 41.3 levels to continue up trend. Else I will short around 40.5 levels.
I expect a consolidation this week between 36 to 41 levels so the moving averages can catch up.

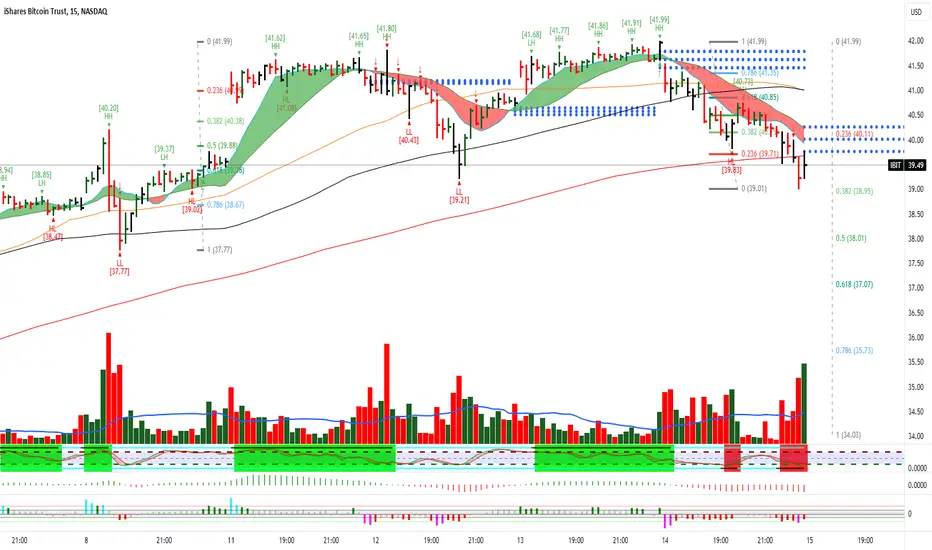
$IBT March 15, 2024LSE:IBT March 15, 2024.
15 Minutes.
NASDAQ:IBIT retraced back to 200 averages in 15 minutes time frame.
For the rise from 34.03 to 41.99 NASDAQ:IBIT has retraced to 38.2 levels.
And for the rise from 37.77 to 41.99 it had retraced more than 61.8%.
So holding 39 resistance can be expected around 41-42 levels.
On the downtrend i expect 37 as a target initially which is 61.8% retracement for the larger rise and 100 average in the 60-minute time frame too. Bias is towards 37 levels initially.
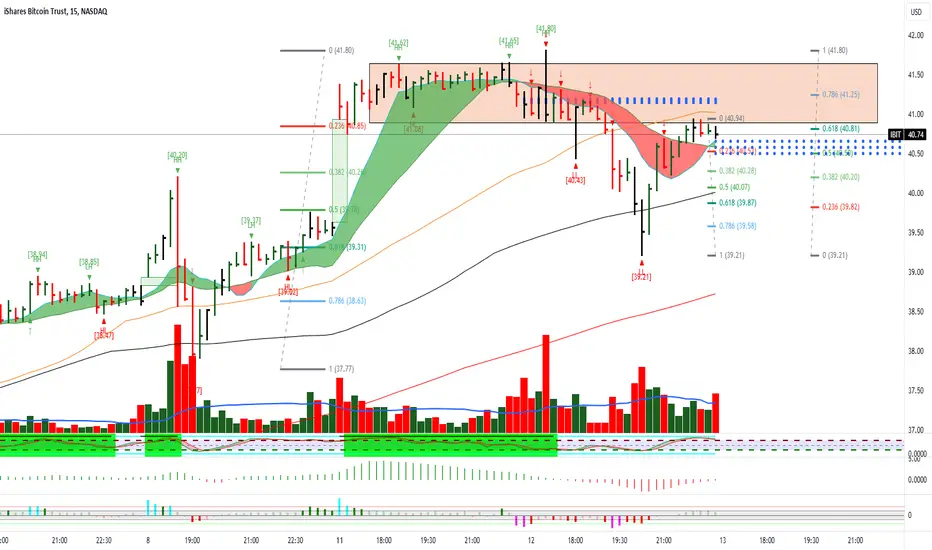
$IBIT March 13, 2024NASDAQ:IBIT March 13, 2024
15 Minutes
The gap was filled yesterday.
If we consider the rise from 37.77 to 41.8 then NASDAQ:IBIT retraced 61.8% of the move.
And for the fall 41.8 to 39.21, it has again retraced 61.8 of the fall.
For the day considering the last rise from 39.21 to 40.94 NASDAQ:IBIT has to hold 39.9 levels for 40-41 as a target.
More uptrend only above 41.8 levels.
I am long yesterday from 39.5 levels SL below 200 average around 38.6 levels.
It is a contra trade as per my setup as my buys are not supported by the Elliott oscillator or black bar on stochastics being on top or CCI green.
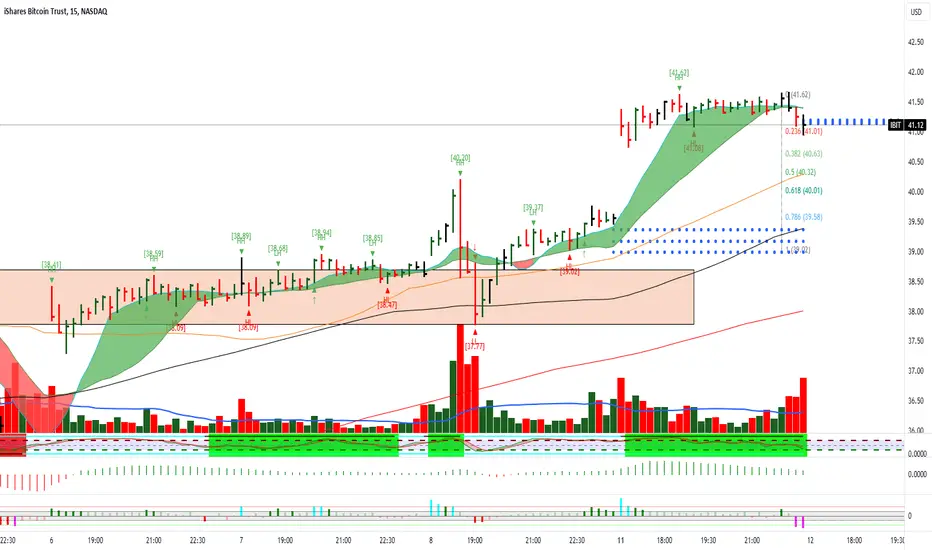
$IBIT March 12, 2024NASDAQ:IBIT March 12, 2024
Closed longs at 41.5 levels.
it was approximately 1.618 extension for the move from 37.77 to 39.37 to 39.02.
So far NASDAQ:IBIT consolidates or retraces to 50 averages.
So for the rise from 39.02 to 41.62, I expect a retrace today to 40.6 levels.
I have a next target as 43 levels if this retracement low is held.
Also if 39.5 is broken then the gap is filled which will lead to a fall in the current momentum on the upside. Then I expect some more consolidation before the next leg.
$IBIT March 11, 2024NASDAQ:IBIT March 11, 2024
As of now, the uptrend is intact. Broke the box. On retest took support at the bottom of the rectangle and now above box.
The sideways movement has given enough time for moving averages to catch up.
For the rise of 34.03 to 40.2 NASDAQ:IBIT retraced to 37.77 which is approximately 38.2% retracement.
And for the fall 40.2 to 37.77 NASDAQ:IBIT is around 39.6 well above 61.8% levels.
Holding 38.7 I expect the uptrend to continue for an initial target of 41.5 to 42.5 levels.
I am holding longs at the moment for 42+- 0.5 as targets.
IBIT ETFHello friends, as you know, on March 12th, the Federal Reserve's support for the banks is supposed to be removed, so this could be the beginning of Bitcoin's liquidation and a correction in Bitcoin.

$IBIT March 7, 2024NASDAQ:IBIT March 7, 2024
15 Minutes.
Yesterday we had sideways after a gap up open.
For the rise from 34.03 to 38.59, holding 36.5 levels uptrend continues.
I expect a correction as oscillator divergence is seen.
For the larger move from 29 to 39 we need to hold 35 levels being the 61.8 reteracement for the shorter rise 34.03 to 38.59, which is also 200 average sloping upwards.
Any upward movement for today I expect to be resisted around 40 levels allowing moving averages to catch up.

OMG BLACKROCK IBIT FEROCIOUS SELL-OFF Today ???But how can that be since according to most talking heads it's institution money doing the buying. If RETAIL & Institution(according to talking heads) money is being put into those newly listed ETF's, THEN WHO IS SELLING Such a chunk while supposedly financial institutions are buying???
According to my perspective, FUNDS are pouring RETAIL into Bitcoin while the SMART Institutional money is selling into demand!
Nice triangle suggested the next potential move was going to be forming into a potential top, and that's what price printed.
In my humble opinion.

IBIT short-term ideal based on BTC I’ve been looking at the trend bitcoin is taking and i think it may be exhausted and taking a breather… I also have been looking at crypto mining stock such as riot and Mara both developing a double top, and with the ascending triangle Btc has, i think it may actually move downwards to fill a gap, and push back up. Also the long tail on the red candle tell me people have selling sentiment at that level and it will give people the opportunity to get in. I’m new to posting my ideals but i’ve been at it awhile. Not finical advice, do your own due diligence.

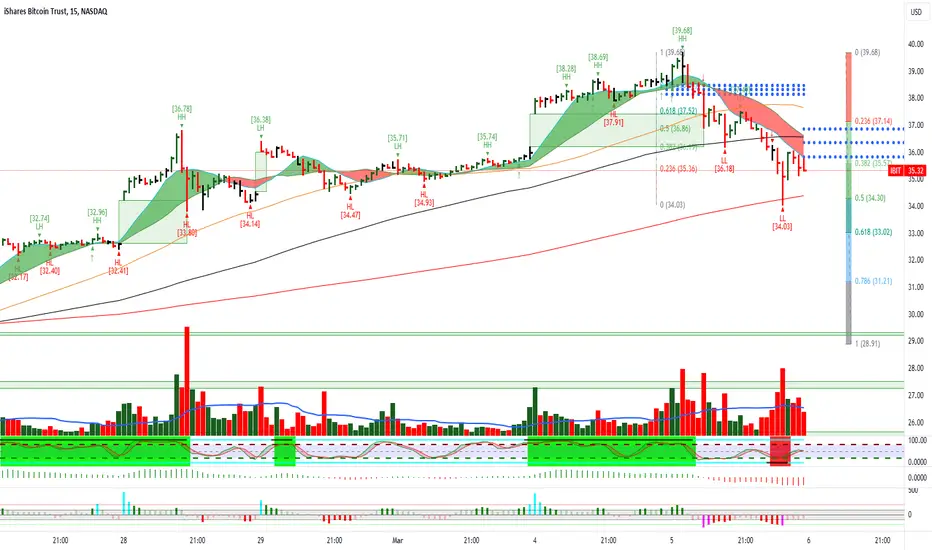
$IBIT March 6, 2024.NASDAQ:IBIT March 6, 2024.
Started to track this ETF last few days.
For the move from 28.91 to 39.68, IBIT retraced yesterday 50% of the last rise.
Considering the fall of 39.68 to 34.03 uptrend is only above 37.6 levels.
Even crypto I found when too far away from moving averages either goes sideways or retraces.
We have 33 levels as 9 moving averages in daily time frames. Holding that on a retracement target is 38-39 levels as the retrace will be more than 61.8 of the rise.
I would like to watch this for a short around 37 levels SL 38 for a target of 33-34 levels.
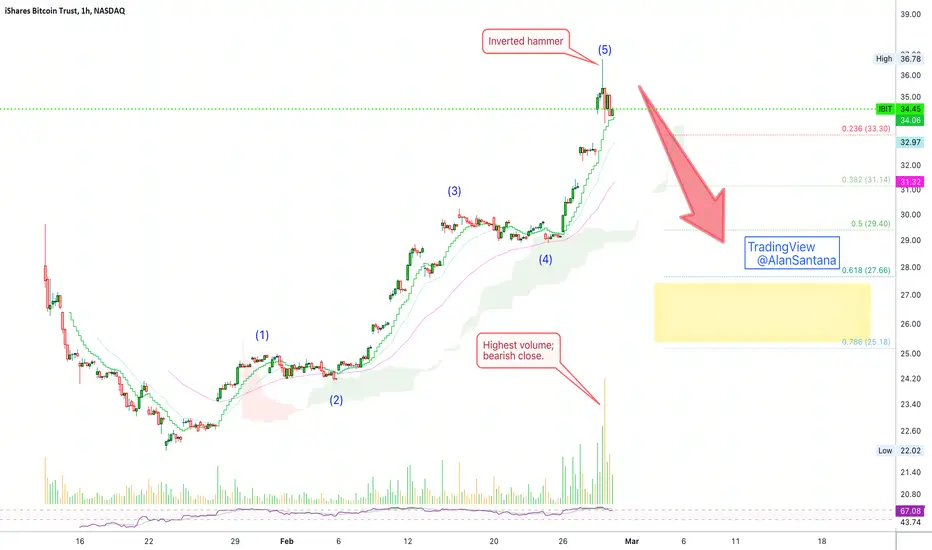
📉 iShares Bitcoin Trust Bearish Signals (26.42 Next)➖ 5 up-waves pattern detected.
➖ Wave five ends as an "inverted hammer" candlestick pattern.
➖ The inverted hammer is followed by a strong bearish candle (confirmation of the pattern); the biggest bearish candle since 11-Jan.
➖ Highest bearish volume right after the top signal.
➖ Bearish divergence on the RSI.
➖ Many GAPs left open on the way up.
➖ Confirmation through correlation to other related markets, i.e., Bitcoin and Coinbase.
👉 Correction target can happen between 25.18 to 27.66.
Thank you for reading.
Namaste.
Trading setup at IBIT gaps on US market opening👀🚨❓The BitcoinETF IBIT will open the US market with a pre-market gap up today dear Crypto Nation👀🚨
Why can this be important❓
In 6 out of 6 times when that happened we saw BTC go up at least 1,000 USD before getting down 500 USD🚀
No financial advice to open a trade at US market opening with RR 2,0... but keep an eye on the behavior today - might be an interesting trading setup in general👀
Comments💭, Likes♥️ & Follow🔗appreciated🤗
Disclaimer:
Not financial advice
Do your own research before investing
The content shared is for educational purposes only and is my personal opinion

What if Bitcoin ETF's Never Make Money?Above is Blackrock's new Bitcoin ETF.
This is mostly a joke and a "wait and see" post. I'm curious whether the liquidity generated by these Bitcoin ETF's creates a permanent resistance at their opening day high, which is around $30 for IBIT. I'm speculating that Bitcoin may never again breach $50k. Again, I'm partially kidding with this post but wouldn't be surprised if it came true.
Essentially, when various cryptocurrencies are listed on prominent exchanges like Coinbase or Binance, they initially pump on their first day of trading, only to dump endlessly in the weeks following. Hardly any hyped cryptocurrencies survive their listing date and move on to achieve new highs. That's because the listing day is the day where the most of that coin is traded, the sellers being insiders and whales who held until that very date with the intent to never buy back. With access to so much more liquidity, it becomes easier to sell without immediately tanking the price. Price only tanks once demand totally evaporates. Essentially "exit liquidity."
So, the demand for Bitcoin must remain elevated in order for these ETF's to be successful. We'll have to see what happens. I speculate that the demand will not be high enough given the liquidity and the scarcity of Bitcoin to keep price up. In theory, Bitcoin's scarcity is an advantage here, but my implication is that it's a double-edged sword. Scarcity can also have a psychological impact, which I think Bitcoin proponents often ignore. Especially if the thing itself isn't very useful, scarcity can just cause people to have less interest in it. "It just doesn't matter as much anymore. I'll just buy other things. People already own most of it, why bother?"
Bitcoin does not have much value at all to society. This is easily provable because if it ceased to exist, not much would change. Until this is no longer the case, I will continue to believe Bitcoin doesn't have much growth ahead of it. It'll remain niche and important for some utilities, but it isn't the future of money.
On the other hand, if the Internet ceased to exist we'd have way more problems. Society would likely collapse until we rework our systems backwards to how they were before. It would probably be worse than the great depression.
Now about a popular theory as to why price dropped recently.
Grayscale this, grayscale that. Grayscale's high fees and the resulting switch from grayscale to newer ETF's is only part of the equation, I think. Otherwise, we'd see those funds quickly going into the new ETF's. Many Grayscale buyers bought their shares at a huge negative premium, and so they are making extra profit, on top of Bitcoin's gains from the last year. They could be selling, never looking back. I'm also guessing some long term Bitcoin holders are folding here, with not much else to speculate about. Again, I think this is a "jig is up" moment, much like the super bowl ads in 2022.
Because Bitcoin is now trading outside of the crypto world in such a meaningful way, there is now a vacuum between the two markets. The stablecoin cartel will then have a much harder time influencing price, which is how Bitcoin's scarcity works against it. Now, the big boys on wall street can also go short on these new ETF's.
It will be simple to prove this speculation wrong. Bitcoin will just have to pump over $50k at some point in the future. It'll be funny if this turns out to be correct, but I don't think the chance of it is high. My opinion on Bitcoin is pretty low, so I wouldn't be surprised if it turned out to be true either.
I still think Michael Saylor will become a forced seller at some point in the future. He is quite overleveraged and controls a very large portion of all the Bitcoin.
Thanks for reading, even though there isn't much substance in this post.
As always, this is meant for speculation and entertainment only.
-Victor Cobra

BTC and IBIT Blackrock ETF prices are pushing higher!Bitcoin and IBIT Blackrock ETF prices are pushing higher showing buyers are back in the game.
But I also think we're hitting the upper range of this trend channel and likely due for a pullback.
The Total Market Cap has a strong resistance area around $1.75T
My thesis is that Bitcion pulls back after this bull trap rally and pushes back towards $38k before resuming the bull run (which would still be in the uptrending channel and bullish market structure).
What are your thoughts?

silver etf vs btc etfcorrelation of first TVC:SILVER etf vs first CRYPTOCAP:BTC etf aka Bull trap aka why I am short

📊 iShares Bitcoin Trust Bearish Close, Bearish StartIBIT ended the week on a bearish note. Trading started down/red and pullbacks were weak and short-lived.
The last 1h candle has an upper wick and closed at the sessions low.
➖ Monday is a Holiday in the USA —no trading.
➖ Tuesday, a bearish close can lead to a bearish start... Tomorrow is likely the day when everything starts to crash.
Enjoy today.
Prepare... Prepare base on reality and not based on expectations, expectations tend to disappoint.
Patience is key by the way.
Namaste.

Btc ETF Sell the news Projection I embedded how first silver etf reacted on btc etf chart, using it as a forecast. It is a hard trade so be careful

IBIT VS GBTC - The Market Has Spoken. IBIT Raging
I did not personally expect this much Spot BTC being converted from GBTC to IBIT but the numbers are right there.
IBIT's low fee's and Blackrock's brand name have just drained the GBTC supply.
As of today
IBIT's holdings is $1,060,712,715.95
GBTC holdings is $23,707,965,989.80
This will become a close battle within months and the low fee battle will always exist.

ISHARES BITCOIN TRUSTHello traders!
If you "Follow" us, you can always get new information quickly.
Please also click “Boost”.
Have a good day.
-------------------------------------
(IBIT chart)
Trading will begin with the approval of BTC ETF (ISHARES BITCOIN TRUST).
As you can see, the current trend is a downward trend.
In order to turn this downward trend into an upward trend, the price must rise above 23.60 to maintain the price.
However, since the volume profile section is currently formed in the 24.84-25.15 section, it is expected that the upward trend will continue only if it rises above this section.
The HA-Low indicator on the 1D chart is formed at the 24.40 point, so if it shows support in the 23.60-25.15 range, it is time to buy.
If you buy at the current price range, the 23.60-25.15 area is expected to be the first resistance area.
With the approval of the BTC ETF, I believe that the coin market has been officially recognized as an investment market.
------------------------------------------------
The biggest issue this year is the BTC halving.
Therefore, it is expected that we will prepare to continue the upward trend in the future.
Have a good time.
thank you
--------------------------------------------------
- The big picture
The full-fledged upward trend is expected to begin when the price rises above 29K.
This is the section expected to be touched in the next bull market, 81K-95K.
#BTCUSD 12M
1st: 44234.54
2nd: 61383.23
3rd: 89126.41
101875.70-106275.10 (when overshooting)
4th: 13401.28
151166.97-157451.83 (when overshooting)
5th: 178910.15
These are points that are likely to encounter resistance in the future.
We need to see if we can break through these points upward.
Since it is thought that a new trend can be created in the overshooting area, you should check the movement when this area is touched.
If the general upward trend continues until 2025, it is expected to rise to around 57014.33 and then create a pull back pattern.
1st: 43833.05
2nd: 32992.55
-------------------------------------------------- -------------------------------------------
** All explanations are for reference only and do not guarantee profit or loss in investment.
** Trading volume is displayed as a candle body based on 10EMA.
How to display (in order from darkest to darkest)
More than 3 times the trading volume of 10EMA > 2.5 times > 2.0 times > 1.25 times > Trading volume below 10EMA
** Even if you know other people’s know-how, it takes a considerable amount of time to make it your own.
** This chart was created using my know-how.
---------------------------------

First long term view of this historic ETF!3X by 2026 based on long term pattern of BTC. Question remains whether the ETF brings in additional volume to pump the price to the stratosphere and soften any landings.... or the likes of Blackrock simply ruin this space.
