NVDA Analysis To 164?Quick breakdown of NVDA
Appears we hit our corrected level, we could go deeper possibly or hold at this level and drive up to 164
This is looking like a nice little setup long indeed
Trade Smarter Live Better
Kris/Mindbloome Exchange
NVDA trade ideas

Nvda bearish ideaGiven the recent euphoric blast of NVDA on the AI wave, I'm calling for a deep technical correction. While fundamentals are still there, it shows overvaluation and is in dire need of a cool off period

NVDA$ - possible pullback to $50 (-67% from pick) in the making.NASDAQ:NVDA have done this before (67% pullbacks after long rally).
NVDA is following very predictable patterns for many years now, despite excitement around this stock - stock made "new recent low" and current rally maybe just a part of a "head and shoulders" in the making. If "new all time high" is not reached with in the next few weeks - we will see stock pullback to $50 or less in the next 6-9 month.

(NVDA) Long Pre-Market position off of previous support. Should wick down, grab liquidity then continue upwards.

NVDA Support and Resistance Lines Valid from July 1 to 31st 2025Overview:
These purple lines act as Support and resistance lines when the price moves into these lines from the bottom or the top direction. Based on the direction of the price movement, one can take long or short entries.
Trading Timeframes
I usually use 30min candlesticks to swing trade options by holding 2-3 days max. Anyone can also use 3hr or 4hrs to do 2 weeks max swing trades for massive up or down movements.
I post these 1st week of every month and they are valid till the end of the month.

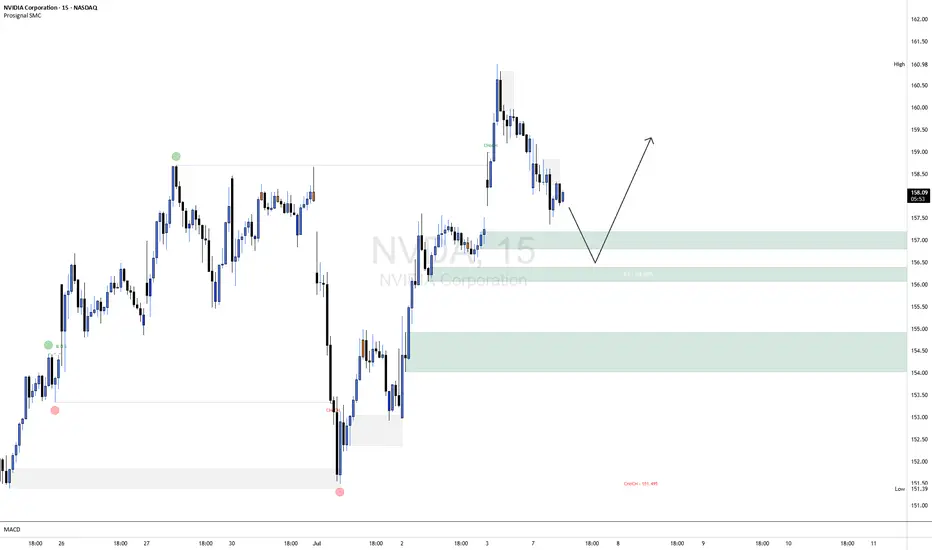
NVDA ShortNVDA is currently exhibiting short-term bearish order flow on the 15-minute chart, with price making lower highs and lower lows following a clear CHoCH (Change of Character) to the downside. The current leg suggests continued weakness as price retraces toward the highlighted bullish order block around the 156.20–157.00 range, aligning closely with the 50% equilibrium level of the last bullish impulse.
This area represents a high-probability demand zone where we anticipate a potential bullish reaction. A confirmation entry (e.g., bullish BOS or lower timeframe CHoCH within the OB) will be required to validate a long setup from this zone. Should confirmation present itself, upside targets can be trailed back toward recent highs near 159.00–160.00.
Risk Management Note:
Always wait for confirmation before entering against the prevailing short-term trend. Use a well-defined stop-loss below the order block and calculate your position size based on your overall risk tolerance (typically 0.5–1% of account equity per trade). Avoid overleveraging, and remember that patience and discipline are key to capital preservation.
NVIDIA -- Major Resistance // Confluence of 3 FactorsHello Traders!
WOW... This chart is quite incredible I must say.
It's amazing how price is currently at an exact point where 2 major trendlines converge which also nearly coincides with the 1.618 Fibonacci extension. Price closed almost to the penny just above the major trendline connecting the prior highs. It will be very interesting to see what price does over the next few days.
What Does These Converging Trendlines Mean?: Think of a trendline like a wall... Depending on how "strong" the trendline is, this wall could be made from wood all the way through to vibranium straight from Captain Americas shield! These two trendlines converging would likely resemble a steel wall and would be extremely hard to penetrate. (Although there are no gurantees in trading)
What To Watch For: I will be watching to see if price can both break and confirm above both resistance trendlines. It will take MEGA buying pressure to accomplish this and would likely mean continuation to the upside. If price cannot break and confirm above then we will likely see a large retrace to support.
Thanks everyone and best of luck on your trading journeys!

NVIDIA NVIDIA (NVDA) CORP IS LEADING IN AI CHIPS
NVIDIA closed the week in a massive green candle at $159.34 , marking a new all-time high.
NVIDIA’s market capitalization is approximately $3.89 trillion, making it the world’s most valuable publicly traded company as of July 2025.
Financial Performance
Q1 Fiscal 2026 (ended April 27, 2025):
Revenue: $44.1 billion (up 12% quarter-over-quarter, up 69% year-over-year)
GAAP EPS: $0.76; Non-GAAP EPS: $0.81
Gross Margin: 60.5% (61.0% non-GAAP), impacted by a $4.5 billion charge related to US export restrictions to China
Fiscal 2025 (ended January 2025):
Revenue: $130.5 billion (up 114% year-over-year)
GAAP EPS: $2.94 (up 147% year-over-year)
Non-GAAP EPS: $2.99 (up 130% year-over-year)
Business Highlights
AI and Data Center Leadership:
NVIDIA’s explosive growth is driven by surging demand for its AI chips, especially in data centers. The company’s Hopper and Blackwell GPU platforms are in high demand, with Blackwell samples now shipping to partners and customers.
Robotics and Automotive Expansion:
Robotics is emerging as a major growth area. NVIDIA’s robotics and automotive division generated $1.7 billion in revenue last year, with projections to exceed $7.5 billion by the early 2030s. The company recently unveiled the AEON humanoid robot and continues to invest in platforms for autonomous vehicles and industrial automation.
Product Innovation:
At Computex 2025, NVIDIA announced new AI infrastructure technologies, including NVLink Fusion and the Isaac GR00T-Dreams platform for robotics. The company is also expanding into custom AI server solutions and ARM-based CPUs for PCs and servers.
NVIDIA remains moderately bullish, the Bullish scenarios/probability could potentially reclaim $200–$250 per share in 2025 if AI demand accelerates and China market headwinds ease.
Growth Drivers:
Continued AI adoption across industries
Expansion in robotics, automotive, and cloud infrastructure
Strategic partnerships and global supply chain investments
Recent News
Market Leadership:
NVIDIA briefly surpassed Microsoft and Apple to become the most valuable company in history, with a market cap nearing $3.92 trillion.
Dividend:
The next quarterly cash dividend of $0.01 per share was paid on July 3, 2025.
Summary Table
Metric Value (July 2025)
Stock Price $159.34
Market Cap $3.89 trillion
Q1 FY26 Revenue $44.1 billion
Q1 FY26 EPS $0.76 (GAAP), $0.81 (non-GAAP)
Fiscal 2025 Revenue $130.5 billion
Fiscal 2025 EPS $2.94 (GAAP), $2.99 (non-GAAP)
Dividend (Quarterly) $0.01/share
NVIDIA remains the global leader in AI and accelerated computing, with record financial results, a dominant market position, and ambitious expansion into robotics and next-generation computing platforms.
#NVIDIA #AI #STOCKS

NVIDIA: More Room in Wave BNvidia’s strong rally over recent weeks lifted the stock above resistance at $153.13. Despite a brief pullback on Tuesday, we still expect beige wave B to extend toward $178.39. Afterward, beige wave C should initiate a substantial correction, likely finding its low above $81.98 to complete blue wave (IV). If Nvidia rallies directly through $178.39, that would support our alternative view that blue wave alt.(IV) has already bottomed (37% probability).
📈 Over 190 precise analyses, clear entry points, and defined Target Zones - that's what we do.

How To Spot The Breakout In 3 Steps Or More..In this video we dive into how to spot the breakout
but here is a catch we are using the Stochastic RSI
to spot these breakouts.
Also this spotting of these breakouts is happening
together with the Rocket booster
strategy.
Watch this video to learn more.
Disclaimer:Trading is risky please learn risk management and profit
taking strategies.Also feel free to use a simulation trading account
before you trade with real money.

NVIDIANVIDIA is due for correction, anytime it can start. This week probably would be a good week to start the correction.
Disclosure: We are part of Trade Nation's Influencer program and receive a monthly fee for using their TradingView charts in our analysis.

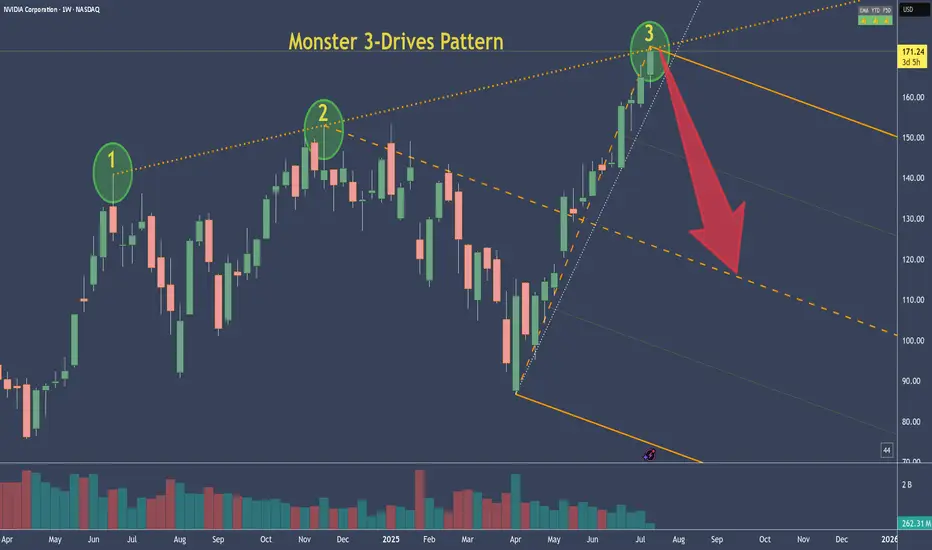
NVDA - NVIDIA's 3-Drive Pattern target if it plays outThis is the weekly chart of NVDA.
We can clearly see a 3-Drives pattern forming.
If this pattern plays out, the centerline would be my target. Of course, it's still too early to short.
But I’ve got my hunting hat on and I'm watching for signals on the daily chart.
One would be a break of the slanted trendline—but there are a couple of other conditions that need to align as well.
Always ask yourself: What if?
Inevitable Pull Back Coming Soon?| NVDA TSLA AAPL AMZN META MSFTStock market Forecast | QQQ SPY CME_MINI:NQ1! CME_MINI:ES1!
Mag 7 FORECAST| NASDAQ:NVDA NASDAQ:TSLA AAPL AMZN META MSFT July 2025 Forecast

NVDA GEX Analysis for Options Trading. Jul 7Gamma Exposure (GEX) Insights – July 5, 2025
* 📍Key Gamma Wall (Resistance):
→ 160.98 — Highest positive GEX level (strong call wall / gamma resistance).
→ 162.5 — Next large call wall, acting as a magnet or rejection pivot.
→ 165 / 170 — Thin GEX above = squeeze zone if breakout occurs.
* 🧲 Support Side:
→ 152.5 – 150: HVL + Put Support + GEX pocket.
→ 140: Second PUT wall, deeper support if breakdown worsens.
* 📉 IV Sentiment:
→ IVR: 5.6, IVx avg: 37.9 = Low implied volatility.
→ Current IV crush environment favors debit call spreads or directional long calls with tight risk.
* 📊 Call/Put Flow:
→ Calls: 3.3%, Puts: -0.53%
→ Slight bullish bias but not overcrowded — room for gamma expansion.
🔄 Options Trade Setups Based on GEX
Bullish Gamma Squeeze Setup:
🟢 Trigger: Price breaks and holds above 161.
🧨 Target: 165 → 170 (thin GEX zone could cause sharp move).
🛡️ Strategy: Buy 160C / Sell 165C (debit spread) or long 162.5C with defined stop.
⛔ Stop: If NVDA fails to hold above 158.
Bearish Gamma Rejection Setup:
🔴 Trigger: Rejection at 160.98–162.5 zone with volume fade.
🎯 Target: 156.5 → 152.
🛡️ Strategy: Long 160P / Short 155P (bear put spread) or short 162.5C naked if IV allows.
⛔ Stop: Breakout above 162.5 invalidates this setup.
📈 1-Hour Chart Technical Analysis
Structure & Price Action:
* NVDA is in bullish market structure, forming higher lows with a clean CHoCH → BOS → retest play.
* It reclaimed the 159.20 level and is testing the 160.98–162.5 zone — a key area where momentum traders will engage.
Zones to Watch:
* Support:
→ 156.68 (minor swing support)
→ 153–152 OB zone (valid bullish OB + HVL)
* Resistance:
→ 161–162.5 (GEX resistance + supply)
→ Above 162.5 opens room to 165+
Trend & Volume:
* Strong bullish candle breaking BOS.
* Volume picked up during BOS, but follow-through needs to come with breakout candles or retest hold.
🔍 My Suggestions for Intraday/Swing Traders:
✅ Bullish Setup:
If NVDA holds above 159.20 and reclaims 161, enter on retest of 160.50.
TP1: 162.5
TP2: 165
SL: Below 157.80
❌ Bearish Setup:
If price gets rejected near 162 and breaks below 157.80 → short retracement to 153.
TP1: 156.5
TP2: 152
SL: Above 162.50
My View:
Currently bullish bias but entering a decision zone. Wait for clean breakout with volume, or short rejection if momentum fades. Keep GEX in mind — above 162.5 has little resistance and can rip.
This breakdown is for educational purposes only and not financial advice. Always manage your risk before taking a trade.

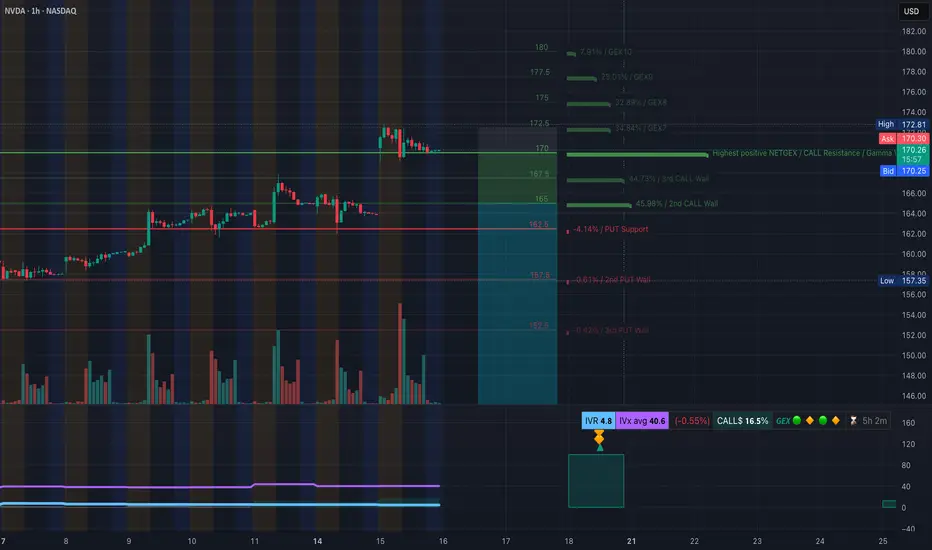
NVDA Bulls in Control Above $170? TA for July16Options Flow and Technical Setup🔥
🧠 GEX & Options Flow Analysis
* GEX Map Summary:
* Highest Call Wall & Gamma Resistance: $172.50
* Major GEX Clusters: $175–$178 → Layered GEX zones, strong positive sentiment
* PUT Support: $162.5 — This is the highest negative NetGEX zone and key downside defense
* IVR: 4.8 (Low)
* IVx: 40.6 (Decaying vol environment)
* Options Skew: 16.5% CALL-dominant bias — Traders leaning bullish.
🧩 Options Trading Suggestions:
* Bullish Play (Preferred Bias):
* Above $170, bulls can look for a push into $172.5 → $175 range.
* Suggested Strategy:
* Buy: $172.5 or $175 CALL (0DTE or 7/19 expiry)
* Condition: NVDA must hold above $170.00 on pullbacks
* Risk: Use $167.5 as a mental stop
* Target: $175–$178 possible gamma magnet if volume kicks in
* Bearish Hedge (if 170 fails):
* Below $167.5, NVDA could revisit $165 or $162.5 PUT wall
* Put Entry Idea: $165 PUT (7/19)
* Only if price shows CHoCH + BOS confirmation
🧠 1H Chart + SMC Price Action Breakdown
* Market Structure: BOS continuation → price consolidating below BOS high
* Current Box: NVDA trapped in a tight SMC range between $167.89–$172.81
* CHoCH Zone: None yet. We’re in a healthy bull flag consolidation pattern
🔍 Trading Scenarios:
* Bullish Setup:
* Wait for breakout above $172.5
* If price closes above and retests → long to $175, $178
* Alternatively, accumulate calls if price bounces from $170 with strength
* Bearish Setup:
* Watch $167.89 → a CHoCH and BOS below this opens $165, $162.5
* Be cautious: this is a bullish structure unless macro news hits
✅ Final Thoughts:
NVDA remains one of the strongest charts on the board. The consolidation under $172.5 is healthy, and GEX flow shows bullish momentum building. As long as $170 holds, this setup favors long trades, especially toward $175–$178.
Disclaimer: This analysis is for educational purposes only and not financial advice. Always do your own due diligence and manage risk properly.
NVDIA to 185 or Higher base Trend ExtensionInitial Impulse Move (P1 to P2): The strong upward movement from $90.33 to $153 shows significant bullish momentum.
Healthy Retracement (P2 to P3): The pullback to $87 represents a deep correction—deeper than the starting point, suggesting a potential shakeout before resuming upward.
Extension Projection: Using the 1.618 level from this wave structure, the projected price of ~$187 serves as a potential target or resistance level where price may react or consolidate.
Technical Significance: The 1.618 level is often used by traders to anticipate where profit-taking or trend exhaustion may occur in strong moves, especially after a retracement.

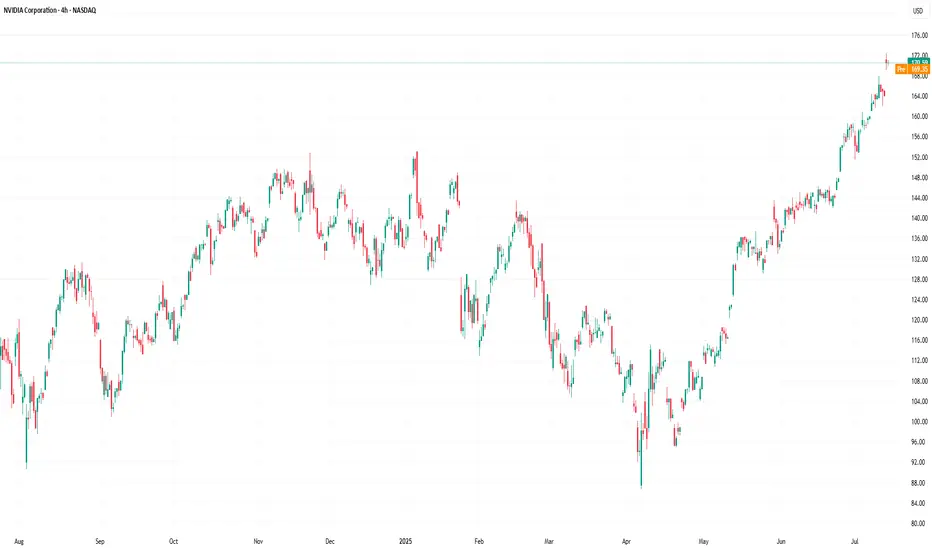
NVIDIA (NVDA) 4H Setup – Rocket Booster Strategy Building🚀 NVIDIA (NVDA) 4H Setup – Rocket Booster Strategy Building Momentum After Gap-Up and Volume Spike 📈
NVIDIA (NVDA) is showing early signs of another bullish
continuation on the 4-hour chart, echoing a similar pattern seen recently on Microsoft. This setup fits well within the Rocket
Booster Strategy framework — a method focused on catching strong trend acceleration signals backed by confluence.
Here’s what’s happening on NVDA’s chart:
1. High Volume on the 4H Candle
There’s been a strong increase in volume on a bullish 4H candle, indicating significant interest at current levels. This suggests
accumulation or breakout positioning, typically a good sign ahead of momentum bursts.
2. Stochastic RSI Between 50 and 20
While the Stochastic RSI hasn’t bounced from the oversold zone yet, it’s hovering between 50 and 20 — a zone that often acts as a
launching point for continued upward momentum. This shows that buyers are gradually regaining control without being overextended.
3. Price Above the 50 EMA and 200 EMA
NVDA is currently trading well above both the 50 EMA and 200 EMA on the 4-hour chart. This bullish structure confirms a strong
underlying uptrend, and it gives added confidence to long positions.
4. Bullish Gap-Up
A gap-up occurred recently, further confirming buying pressure. Gaps during trending conditions often signal the start of a new
impulsive wave, especially when backed by rising volume and clean trend structure.
Strategy Context
This is a textbook setup for the Rocket Booster Strategy, though the Stochastic RSI is not fully reset. Instead, it’s showing a more
gradual buildup of strength — which can be an early entry signal before larger players pile in.
Entry: On 4H candle continuation or brief intraday retracement
Stop Loss: Below the gap or recent support
Target: Previous swing highs or Fibonacci-based extensions
Final Thoughts
NVIDIA is showing strong signs of bullish continuation, and this could be the early stage of a new momentum phase. The
Stochastic RSI position adds a slightly different flavor to the setup
— more of a buildup than a reversal — but the overall structure remains solid. As always, risk management is key.
Let me know in the comments if you’re watching NVDA too or already in the trade. More setups like this coming soon.
🔥 Rocket Booster Strategy: Engaged for NVDA?
Disclaimer:
This analysis is for educational and informational purposes only. It does not constitute financial advice or a recommendation to buy or sell any security.
Always do your own research and consult a licensed financial advisor before making any trading decisions. Trade at your own risk.

Nvidia (NVDA) Share Price Surges Above $170Nvidia (NVDA) Share Price Surges Above $170
Yesterday, Nvidia’s (NVDA) share price rose by more than 4%, with the following developments:
→ It surpassed the psychological level of $170 per share;
→ Reached another all-time high;
→ Gained more than 9% since the beginning of the month.
The bullish sentiment is driven by Nvidia CEO Jensen Huang’s visit to China shortly after meeting with US President Trump. At the same time:
→ US Secretary of Commerce Howard Lutnick stated that the planned resumption of sales of Nvidia H20 AI chips in China is part of the US negotiations on rare earth metals.
→ The head of Nvidia stated that he was assured licences would be granted very quickly, and that a large number of orders for H20 chip deliveries had already been received from Chinese companies.
Market participants are viewing the situation with strong optimism, and analysts are raising their valuations for NVDA shares:
→ Morningstar analysts raised their fair value estimate for Nvidia shares from $140 to $170.
→ Oppenheimer analysts increased their target price from $170 to $200.
Technical Analysis of the NVDA Chart
The price trajectory of NVDA shares fully reflects the exceptionally strong demand:
→ The price is moving within an ascending channel with a steep growth angle;
→ Since early May, the RSI indicator on the 4-hour chart has not fallen below the 50 level;
→ Yesterday’s trading session opened with a large bullish gap.
The chart also shows the formation of a stable bullish market structure (shown with a purple broken line), expressed through a sequence of higher highs and higher lows.
Given the above, it is difficult to imagine what might cause a sharp shift from positive to negative sentiment. If a correction begins (for example, with a test of the $160 level), traders should watch for signs of its completion — this could present an opportunity to join the emerging rally.
This article represents the opinion of the Companies operating under the FXOpen brand only. It is not to be construed as an offer, solicitation, or recommendation with respect to products and services provided by the Companies operating under the FXOpen brand, nor is it to be considered financial advice.
NVDA Update: Breakout Fading or Wedge Still in Play?In my last post, I highlighted the rising wedge pattern forming at the top of NVDA’s strong rally. Price briefly pushed above the upper wedge resistance and tagged $172.40, but today’s session printed a bearish close at $170.70 — just above the breakout level, but with no real follow-through.
Volume came in higher, but price action failed to extend the breakout, suggesting this could be a stall or even a false breakout in progress. RSI remains overbought, and momentum may be slowing despite the recent push.
If price slips back below $168, we could see the original wedge breakdown scenario come back into play. Watch for support around:
🔹 $151.31–148.67
🔹 Below that: $125 zone
For bulls, continuation above $172.40 with strong volume would invalidate this pattern and confirm breakout strength. Until then, caution is warranted.

$NVDA – Going Long Long LONGTaking a long position here at $98 – yes, despite the noise.
There’s no denying the pressure across semiconductors following renewed tariff threats from the Trump administration. But I believe this is more short-term overreaction than long-term damage. Any meaningful negotiation or de-escalation could act as a slingshot for these names, especially leaders like Nvidia.
Nvidia's fundamentals remain incredibly strong. The company is still outpacing its peers in AI, data centers, and gaming hardware. Profitability remains intact, and there’s no indication of a breakdown in their competitive edge.
Technicals are giving us some strong signals:
We're seeing a long-term bullish divergence forming.
RSI is approaching oversold territory – rare for Nvidia and historically a signal for strong bounces.
Price is nearing key long-term support levels that held in previous cycles.
I'm positioning early here because I believe the broader market is mispricing geopolitical risk. If the situation improves – and it often does faster than expected – NVDA is one of the first names that will rebound aggressively.
Let’s see how this plays out, but I’m confident this is a high-conviction entry point in the 80's and 90's.

NVDA Buyers Getting Squeezed? What Gamma & Price Action Say NextGEX-Based Options Insight (Gamma Exposure):
📉 NVDA is currently sitting at $152.54, just above a key PUT wall at $150, with GEX sentiment tilted bearish short-term.
* Highest Call Resistance / Gamma Wall: $160
This is the level with the strongest net positive GEX, acting as a cap where market makers may short against CALLs.
* 2nd Call Wall: $158 – Heavy positioning here, could slow price if it bounces.
* PUT Support: $150 – Strong gamma magnet; price may hover or bounce near this.
* IVR: 8.6 (low) – Options are relatively cheap.
* CALLs Flow: 2.6% bias – Weak call flow, favors downside or range behavior.
💡 Options Trade Suggestion:
Because NVDA is under the gamma wall and just above strong PUT walls, consider buying a debit PUT spread, especially if $152.50 breaks.
* Setup: Buy 155P, Sell 150P expiring this Friday
* Risk: Defined
* Reward: Targets $150 zone (gamma magnet)
* Only valid below $152.50 breakdown
1H Price Action + SMC Trade Plan (Chart 2):
🟣 Structure Breakdown Confirmed – NVDA lost its rising structure and broke BOS + CHoCH zones near $157–158.
📉 Current Bias: Bearish
Multiple break-of-structure (BOS) and change-of-character (CHoCH) events suggest a shift to downtrend.
🟩 Possible Short Entry Zone:
* Price could retest the last order block around $155–156 for a lower high before dropping.
📍 Short Trade Idea:
* Entry: Around $154.80–$155.50 (if price retests)
* Stop: Above $157.99 (previous high)
* Target: $150 (1st TP), $147.50 (2nd TP, PUT wall)
📍 Alternative Scenario (invalidates the short):
If price reclaims $158 with strength, we could get a squeeze toward the $160 gamma wall.
Conclusion & Plan:
Right now, NVDA is in a short-term downtrend, aligning with bearish GEX flow. Option sentiment, volume, and structure all favor selling bounces into $155–157 with $150 as magnet. But don’t short blindly—watch if price retests OB and rejects. Use PUT debit spreads or simple 1 DTE options with tight stops.
Disclaimer: This analysis is for educational purposes only and does not constitute financial advice. Always do your own research and manage your risk before trading.

Nvidia - More Upside After Correction NVIDIA completed an irregular flat correction back in April. Since then, the price action has been strong and steady, forming higher highs and higher swing lows —a clear sign of bullish con-
continuation.
From an Elliott Wave perspective, the current move appears incomplete, as we cannot yet identify a full five five-wave advance from the April lows. This suggests that more upside may still be ahead.
However, we could see a wave four pullback develop sometime during the summer. If that occurs, the key support zone to watch would be around $140 down to $130, which could provide
an opportunity within the ongoing uptrend.
- Resistance: 170
- Support: 143 / 132
- Invalidation: 115
GH

Nvidia Breaks Out and Stays OutNvidia has powered to new all-time highs, reclaiming its title as the world’s most valuable
company. The move is being driven by a blend of AI-fuelled optimism and technical resilience.
AI spending is alive and well
After a rocky start to the year, Nvidia’s resurgence has been fuelled by a sharp rebound in
confidence across the AI ecosystem. At the company’s shareholder meeting, CEO Jensen Huang
painted a bullish long-term picture, calling the AI boom a multitrillion-dollar opportunity and
highlighting the rise of sovereign AI infrastructure around the world. That message landed well with
the market, especially after several big tech firms reaffirmed their commitment to AI investment
during earnings season.
Micron added fuel to the rally with a blowout earnings report, topping forecasts and issuing strong
guidance on AI-driven demand. Investors have also warmed to the idea that Nvidia’s grip on the AI
hardware stack remains firm, despite rumblings of competition. Cloud giants like Microsoft and
Amazon may want to build their own chips, but for now, the fastest and most scalable path still runs
through Nvidia.
The price action tells its own story
They say the strongest stocks are the ones that bounce back quickly from bad news. Nvidia fits the
bill. After a nasty correction in Q1, triggered by China export restrictions and the DeepSeek
breakthrough, it would’ve been easy for sentiment to stay sour. Instead, since mid-April, the chart
has told a different story. The January gap has been closed, the stock has gone sideways to digest,
and now we’ve seen a clean breakout to fresh highs.
Volume was healthy on the move higher. Not euphoric, but solid enough to back the price action.
What matters now is follow-through. Traders will want to see Nvidia hold above the breakout zone,
and so far the early signs are promising. Price has now closed above the breakout for three sessions
in a row, increasing the probability that this isn’t a fake-out.
There’s also a clear ascending trendline in play, offering a reference point for future pullbacks
alongside the old horizontal resistance. The RSI is up at 76, but that’s no red flag here. Nvidia has
happily trended with the RSI in the 80s before, and momentum doesn’t tend to fizzle out just
because it’s technically overbought.
NVDA Daily Candle Chart
Past performance is not a reliable indicator of future results
Disclaimer: This is for information and learning purposes only. The information provided does not
constitute investment advice nor take into account the individual financial circumstances or
objectives of any investor. Any information that may be provided relating to past performance is not
a reliable indicator of future results or performance. Social media channels are not relevant for UK
residents.
Spread bets and CFDs are complex instruments and come with a high risk of losing money rapidly
due to leverage. 85.24% of retail investor accounts lose money when trading spread bets and
CFDs with this provider. You should consider whether you understand how spread bets and CFDs
work and whether you can afford to take the high risk of losing your money.
