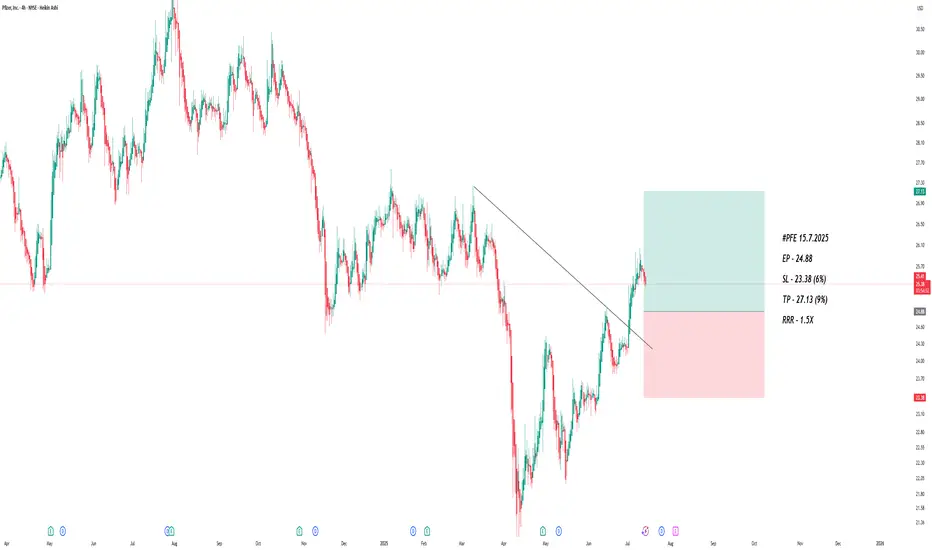
Pfizer stocks Buy Trade with Take Profit - Stocks SPOT ACCOUNTStocks SPOT ACCOUNT:
NYSE:PFE stocks my buy trade with take profit.
This is my SPOT Accounts for Stocks Portfolio.
Trade shows my Buying and Take Profit Level.
Spot account doesn't need SL because its stocks buying account.
Next report date
—
Report period
—
EPS estimate
—
Revenue estimate
—
5,780 COP
35.33 T COP
280.30 T COP
5.68 B
About Pfizer
Sector
Industry
CEO
Albert Bourla
Website
Headquarters
New York
Founded
1849
FIGI
BBG001BJ6532
Pfizer Inc. is a research-based global biopharmaceutical company, which engages in the discovery, development, manufacture, marketing, sales and distribution of biopharmaceutical products worldwide. The firm works across developed and emerging markets to advance wellness, prevention, treatments and cures that challenge the most feared diseases. The company was founded by Charles Pfizer Sr. and Charles Erhart in 1849 and is headquartered in New York, NY.
Related stocks

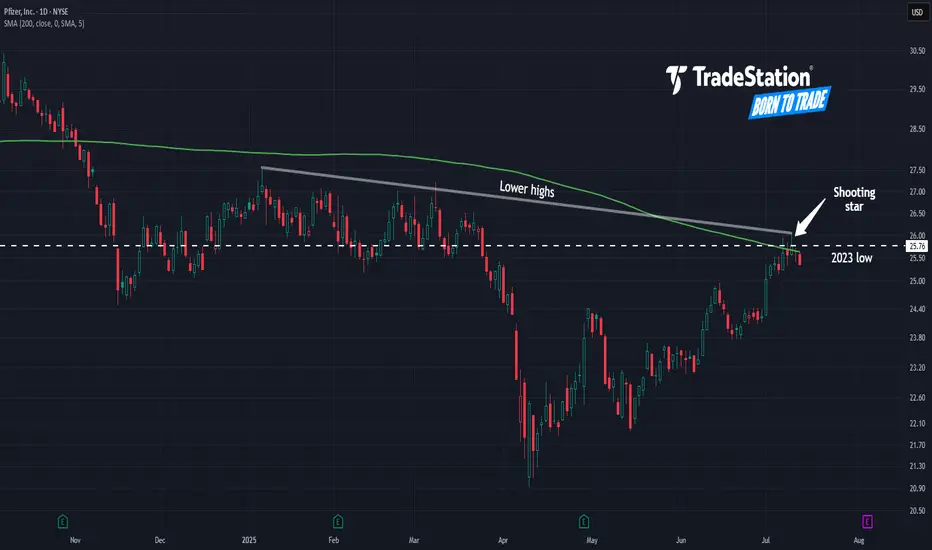
Pfizer May Be StallingPfizer has limped higher since April, but some traders may think the pharmaceutical giant is at risk of stalling.
The first pattern on today’s chart is the series of lower highs since January. PFE potentially just made another lower high at this falling trendline, which may suggest resistance is ta
Pfizer, Inc (Wave Analysis) Monthly - Update 17/7/2025Pfizer, Inc (Wave Analysis) Monthly - Update 17/7/202
See the chart
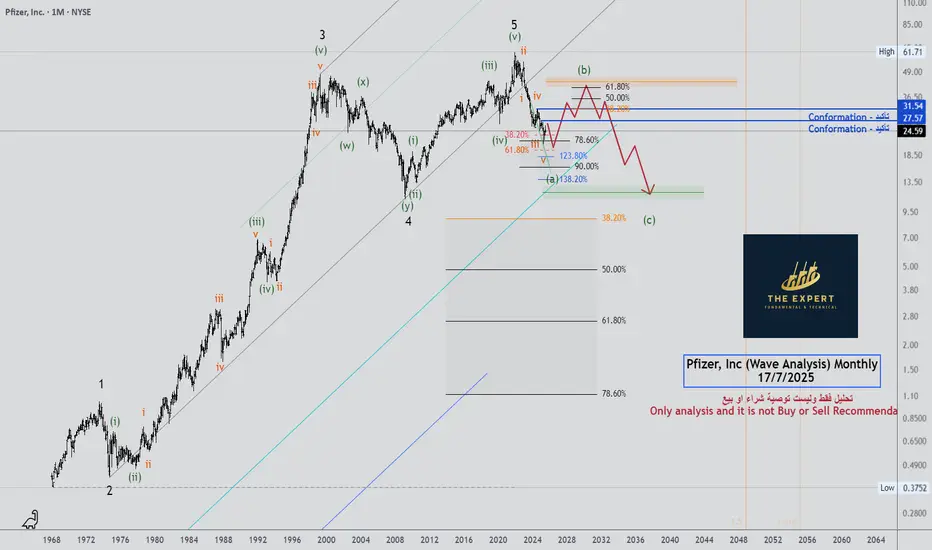
Attempting a breakout The price is attempting a breakout of the blue resistance.
Daily 200-period SMA is also located at $25.10.
It’s important to watch today’s closing price, if the breakout is confirmed, the next target will be the light blue resistance at $26.60

PFIZER INC. (NYSE)For all vaccine enthusiasts, Pfizer shares are currently among the best options.
At the time of publication, the price is holding steady at $24.83 . Our forecast is that the price will rise to $27.48 (minimum)! Most likely by August.
Personally, I don't trade stocks, as I have decided to change

Aggressive Trend Trade 1HAggressive Trend Trade 1H
- short trend
+ volumed T1
+ support level
+ biggest volume 2Sp+
Daily Trend
+ long impulse
+ T2 level
+ support level
+ 1/2 correction"
Monthly CounterTrend
"- short balance
+ expanding ICE
+ support level
+ unsuccessful biggest volume manipulation"
Yearly Trend
"+ long

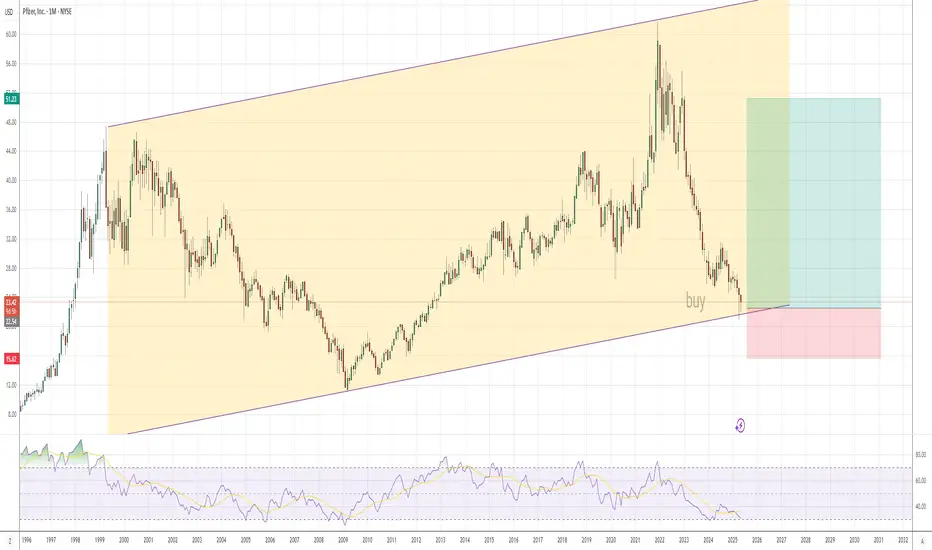
PFIZER is taking Viagrathe stock price of Pfizer is about to overdose on viagra. Looking at the bounce from the downfall due to corona virus there is solid support from previous wave 4. With the news of Vaccines, Pfizer is promising to produce one. I am looking at a target price of $45.00

BUY Pfizer (PFE) growth by Viagra
Tomorrow, I’m entering a position in Pfizer Inc. (NYSE: PFE)—a globally recognized pharmaceutical giant with strong fundamentals and an attractive technical setup.
Pfizer maintains a solid revenue base, reporting $62.46 billion in total revenue in the last fiscal year. Despite recent fluctuatio

See all ideas
Summarizing what the indicators are suggesting.
Neutral
SellBuy
Strong sellStrong buy
Strong sellSellNeutralBuyStrong buy
Neutral
SellBuy
Strong sellStrong buy
Strong sellSellNeutralBuyStrong buy
Neutral
SellBuy
Strong sellStrong buy
Strong sellSellNeutralBuyStrong buy
An aggregate view of professional's ratings.
Neutral
SellBuy
Strong sellStrong buy
Strong sellSellNeutralBuyStrong buy
Neutral
SellBuy
Strong sellStrong buy
Strong sellSellNeutralBuyStrong buy
Neutral
SellBuy
Strong sellStrong buy
Strong sellSellNeutralBuyStrong buy
Displays a symbol's price movements over previous years to identify recurring trends.
P
PFE5588844
Pfizer Investment Enterprises Pte. Ltd. 5.34% 19-MAY-2063Yield to maturity
6.09%
Maturity date
May 19, 2063
P
PFE5588843
Pfizer Investment Enterprises Pte. Ltd. 5.3% 19-MAY-2053Yield to maturity
5.95%
Maturity date
May 19, 2053
P
PFE5588591
Pfizer Investment Enterprises Pte. Ltd. 5.11% 19-MAY-2043Yield to maturity
5.74%
Maturity date
May 19, 2043
See all PFE bonds
Curated watchlists where PFE is featured.


Frequently Asked Questions
The current price of PFE is 102,480 COP — it has decreased by −0.58% in the past 24 hours. Watch PFIZER stock price performance more closely on the chart.
Depending on the exchange, the stock ticker may vary. For instance, on BVC exchange PFIZER stocks are traded under the ticker PFE.
PFE stock has risen by 3.64% compared to the previous week, the month change is a 3.66% rise, over the last year PFIZER has showed a −14.60% decrease.
We've gathered analysts' opinions on PFIZER future price: according to them, PFE price has a max estimate of 140,562.25 COP and a min estimate of 92,369.48 COP. Watch PFE chart and read a more detailed PFIZER stock forecast: see what analysts think of PFIZER and suggest that you do with its stocks.
PFE stock is 1.66% volatile and has beta coefficient of 0.37. Track PFIZER stock price on the chart and check out the list of the most volatile stocks — is PFIZER there?
Today PFIZER has the market capitalization of 575.27 T, it has decreased by −4.54% over the last week.
Yes, you can track PFIZER financials in yearly and quarterly reports right on TradingView.
PFIZER is going to release the next earnings report on Aug 5, 2025. Keep track of upcoming events with our Earnings Calendar.
PFE earnings for the last quarter are 3.83 K COP per share, whereas the estimation was 2.77 K COP resulting in a 38.23% surprise. The estimated earnings for the next quarter are 2.37 K COP per share. See more details about PFIZER earnings.
PFIZER revenue for the last quarter amounts to 57.15 T COP, despite the estimated figure of 58.00 T COP. In the next quarter, revenue is expected to reach 55.35 T COP.
PFE net income for the last quarter is 12.36 T COP, while the quarter before that showed 1.78 T COP of net income which accounts for 596.35% change. Track more PFIZER financial stats to get the full picture.
Yes, PFE dividends are paid quarterly. The last dividend per share was 1.76 K COP. As of today, Dividend Yield (TTM)% is 6.86%. Tracking PFIZER dividends might help you take more informed decisions.
PFIZER dividend yield was 6.37% in 2024, and payout ratio reached 119.94%. The year before the numbers were 5.73% and 444.50% correspondingly. See high-dividend stocks and find more opportunities for your portfolio.
As of Jul 27, 2025, the company has 81 K employees. See our rating of the largest employees — is PFIZER on this list?
EBITDA measures a company's operating performance, its growth signifies an improvement in the efficiency of a company. PFIZER EBITDA is 100.38 T COP, and current EBITDA margin is 36.93%. See more stats in PFIZER financial statements.
Like other stocks, PFE shares are traded on stock exchanges, e.g. Nasdaq, Nyse, Euronext, and the easiest way to buy them is through an online stock broker. To do this, you need to open an account and follow a broker's procedures, then start trading. You can trade PFIZER stock right from TradingView charts — choose your broker and connect to your account.
Investing in stocks requires a comprehensive research: you should carefully study all the available data, e.g. company's financials, related news, and its technical analysis. So PFIZER technincal analysis shows the buy rating today, and its 1 week rating is neutral. Since market conditions are prone to changes, it's worth looking a bit further into the future — according to the 1 month rating PFIZER stock shows the sell signal. See more of PFIZER technicals for a more comprehensive analysis.
If you're still not sure, try looking for inspiration in our curated watchlists.
If you're still not sure, try looking for inspiration in our curated watchlists.