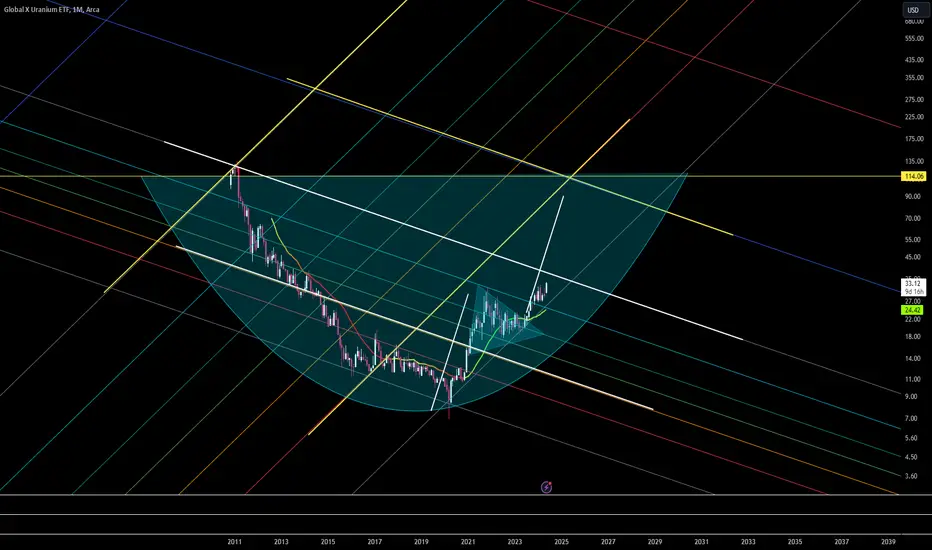
URANiUM: $24 | Demand for Power on the Risewith supply limited and regulated
investors in RADiOACTiVE Marterial
shall be rewarded big time
developing nations
are running out of coal
and oil being regulated to the highs by Russia and Arabs make it
difficult for new nations to keep up with demand for energy
URA trade ideas

bullish on Uranium bullish on uranium and expect this ETF to breakout soon
Support: $17
Resistance I: $43
Resistance II: $100
According to Munro, who is co-chair of the World Nuclear Association’s Nuclear Fuel Demand Working Group, “we are on the cusp of a new nuclear age in which decarbonisation imperatives collide head-on with unrealistic expectations of renewables penetration, leaving nuclear power to wean the world off coal and decarbonise the expanding electrical grid, domestic heating, industrial heating and hard to abate areas of industry including hydrogen production. If nuclear power can achieve its decarbonisation potential around the world, the implications for uranium demand will be astonishing.”

Rising supply could act as a headwind for uranium pricesThe price of uranium, known as yellow cake, has more than doubled in the past year amid a significant imbalance between supply and demand in the global market, sending uranium-related assets soaring to the sky. In addition, the return of Japanese appetite for carbon-free energy and the restart of two nuclear reactors last year, along with plans to restore more units in 2024, also contributed to rising prices. Then, more recently, the announcement of the U.S. ban on Russian imports of uranium and the approval of the GX Decarbonization Power Supply Bill in Japan, aimed at creating a carbon-free energy supply, have had the same effect, helping uranium to regain strength after a brief selloff in February and March 2024.
Illustration 1.01
Uranium-related assets, including Global X Uranium (URA), Sprott Physical Uranium Trust (SRUUF), Sprott Uranium Miners ETF (URNM), and Uranium Energy Corporation (UEC), all recorded huge gains in the past year or so.
Since the start of 2024, uranium has gained approximately 4.7%. Yet, for the year, its performance has been flat, which begs the question of whether the rally is not overdone at this point when the supply is coming online around the world, raising chances of the market moving toward balance and potentially leading to stabilization or reversal in prices. According to the quarterly Domestic Uranium Production Report published by the U.S. Energy Information Administration (EIA), uranium production in the United States for the first quarter of 2024 already surpassed the total output last year. Moreover, data from 2021 and 2022 suggest countries like Australia and Canada are also trying to ramp up their production in response to rising prices.
Illustration 1.02
The image above illustrates the weekly graph of Global X Uranium ETF (URA) and a major resistance at $31.60.
Regarding Global X Uranium ETF (URA), it recorded remarkable 353% gains since its lows in 2020, coupled with a nearly 15% increase in the current year alone. However, despite these impressive gains, the ETF has encountered a significant hurdle at the $31.60 mark, signaling a potential barrier to further upside momentum. Besides that, there is a growing perception that events traditionally viewed as catalysts for price appreciation are losing their potency over time, indicating a potential shift in market dynamics.
Technical conditions
Daily time frame = Bullish (losing momentum)
Weekly time frame = Bullish
Monthly time frame = Bullish
Please feel free to express your ideas and thoughts in the comment section.
DISCLAIMER: This analysis is not intended to encourage any buying or selling of any particular securities. Furthermore, it should not serve as a basis for taking any trade action by an individual investor or any other entity. Your own due diligence is highly advised before entering a trade.

Uranium Go Boom!Uranium looks ready to explode higher.
This commodity had a daily chart breakout today and no one is talking about it.
Silently triggering a bullish inverse head and shoulders, this should yield more upside.
I'm looking for this breakout move to be confirmed in the coming days. If it confirms a breakout this will be a likely trade that we can buy the dip on.

UEC Uranium space is breaking out again. Amir keeps looking smarter and smarter all the time. Like ten fifteen years ahead of the pack. Boss Energy also looking nice. It’s at least competitive with UEC, but they move a little differently, so the pair reduce volatility.

uraCheck out my #URA analysis AMEX:URA #trader #investor #stockmarket looking for a minimum of a 50 % retrace


3 Year Cup and Handle for $URA UraniumWhen in doubt, zoom out. URA is forming the handle on the multi-year cup and handle pattern on the weekly. While doom and gloom besets the new investors, they would be wise to observe that this contraction is a part of a much larger pattern.
Besides, nothing in the fundamentals has changed.

$URA - Potential head and shoulder!There is a possibility that AMEX:URA could form a head and shoulders pattern with the neckline at $26.
If it breaks below the neckline around $26, it will validate the pattern and could see a further downside to the $23 area.
The pattern will invalidate if the price breaks above the shoulder line around the $31 area.

Uran Uran sieht vielversprechend aus. Das erste Ausbrechen mit Retest ist schon passiert. Tendenzwechsel nach dem Basement mit anschliessendem Breakout.
Ein zweiter Retest bei 19 könnte jedoch notwendig sein bevor es richtig nach oben geht.

Uranium and the sentiment cycleOnce you work with Justin Mamis' sentiment cycle you start to see it everywhere.
s3.tradingview.com
AMEX:URA and uranium stocks have done very well after breaking out of a long consolidation. This perspective looks at a potential scenario for the sentiment cycle with Fibonacci confluence zones and volume weighted average prices anchored to key areas.
AVWAPs anchored to the 5/31 breakout, sentiment shift in early October, and early November align to areas that we would look for a subtle and overt warning, and a shift from disbelief to panic. Should this result in a further drawdown we will likely see 24.5-26 act as support before a recovery. In a more violent sell off we'll look for 21.10-21.80 to hold. The next overhead resistance should begin between 32.60-35.39.


Investing into Uranium-Backed Producers. Technical perspectivesUranium ore trades is at records highs, as several hedge fund managers are expanding their allocations to uranium stocks, with a conviction that an increasing embrace of nuclear energy as part of a "green" future - along with geopolitically-rooted ambitions to reduce dependence on Russian oil and gas -- means the trend has a lot of room to run.
On Wednesday, November 1, French President Emmanuel Macron arrived in uranium-rich Kazakhstan on the first leg of a trip to Central Asia.
According to a study by the World Nuclear Association (WNA,) published in August this year, Kazakhstan possesses 12 percent of the world's uranium resources and in 2021 produced about 21,800 tons. In 2009 it became the world's leading uranium producer, with almost 28 percent of world production. In 2019, the country produced a staggering 43 percent of the world's uranium.
A dozen years after the disaster at Japan's Fukashima reactor put nuclear energy on worldwide probation -- and in, Germany, gave it a death sentence -- various factors are combining to bring it back into the acceptable realm of energy solutions.
UXC URANIUM U3O8 Futures Price, over the past 5 years.
First reason, the International Energy Agency says that, in order to meet "net zero" goals -- which describes a state where carbon emitted into the atmosphere matches the amount removed from it - global nuclear generation capacity must double from 2020 levels by 2050.
In addition to nuclear energy coming to the fore as a zero-carbon-emitting power source, it's also seen as a way for the western economies to reduce their need for Russian oil and gas. The fact that Russia currently accounts for about 8% of the world's uranium reserves underscores the need to develop new supply sources. There's also an increasing appetite for nuclear power in Asia and Africa.
Taken together, the uranium-friendly trends could power significant gains in the sector. Uranium equities could see dramatic upside -- 50%, 100%, possibly MultiX more.
The main graph represents technical perspectives for AMEX:URA - The Global X Uranium ETF that provides investors access to a broad range of companies involved in uranium mining and the production of nuclear components, including those in extraction, refining, exploration, or manufacturing of equipment for the uranium and nuclear industries.
The Global X Uranium ETF is 35.66% year-to-date return in this time, that is much stronger against top 4 American well-known indices i.e. S&P500 Index SP:SPX (11.95% YTD), Nasdaq-100 Index NASDAQ:NDX (35.22% YTD), Russell 2000 Index TVC:RUT (-3.38% YTD) , and Dow Jones Industrial Average DJ:DJI (1.94% YTD).
Top 5 Holdings of AMEX:URA - The Global X Uranium ETF (as of November 1, 2023)
# Weight Name
1. 23.80% TSX:CCO - CAMECO CORP
2. 11.25% TSX:U.U - SPROTT PHYSICAL
3. 6.77% LSIN:KAP - NAC KAZATOMPROM-DR
4. 6.45% NYSE:NXE - NEXGEN ENERGY LTD
5. 5.41% AMEX:UEC - URANIUM ENERGY CORP
👉 The main graph says, there're alternative technical perspectives for AMEX:URA - The Global X Uranium ETF in this time, where the major break out of multi year highs can open the door to further huge, MultiX upside price action under well-knoww Technical figure "Cup-and-Handle".
👉 Vice versa, if resistance is still strong, it can bring the graph to its main 5yrs SMA support.

Uranium Bull Market has not even begun.....Buying opportunity of a lifetime in my humble opinion. Uranium equities are likely to outperform the commodity by at least 2.5x, and probably relatively quickly. I also fully expect spot prices to continue upward over 2024 and beyond.
Potential near term fundamental catalysts:
1. Major producers Cameco and Kazatomprom likely to miss production goals for 2024 and 2025. Will have clarity on both these in coming weeks.
2. Russian Uranium ban. House has passed HR1042 already, senate is dragging their feet because Ted Cruz is a douche nozzle. Will almost certainly pass eventually. Not that big of a deal on it's own, but Putin might retaliate by banning uranium exports to the west, which would be a big deal.
3. Sentiment is nowhere near "euphoric" yet. Media attention phase is just beginning.
4. Huge supply/demand imbalance. Most cannot comprehend how out of whack this tiny market is. Price of physical uranium was dirt cheap for a decade following Fukushima, that is over. Huge supply deficits in coming years and no meaningful added supply to come online for 3 years, MINIMUM.
It sounds ridiculous, but $200/lb spot uranium by the end of 2024 is not unreasonable at all. Utilities will pay any price because it is such a small part of their total operating costs. It is far more expensive to shut down a nuclear plant and restart it later than to bite the bullet and buy uranium at any price.
Cheers!

Macro trend reversal: Uranium ETFMultiple geopolitical and macroeconomic factors providing strong tailwind for Nuclear power.
From a technical perspective, there is a massive macro trend reversal playing out here with volume behind it, which presents a promising long-term opportunity.
DYOR.
happy trades,
CD

URA - Uranium getting readyUranium made a pullback as a wedge pattern.
Support here is 21EMA (29.00 zone level flip).
30.00 - potentially interesting zone for a breakout.

Uranium ETF Update - The perfect trade playing out Uranium ETF - $SRUFF
✅ 45% increase since entry at 200 day bounce
✅ Pennant Breakout confirmed trend
🎯 Target remains 0.618 Fib Ext at $45.00
❌ Stop Raised to $26.67 guaranteeing 27% profit
(Stop placed here as it is the most recent higher
low and should remain intact for short term trend
to remains valid)
Hope this simplifies the approach and structure of the trade.
Thanks
PUKA

$URA: Bulls at 30 seem positioned wellAMEX:URA showing promise here at 30 and we could be looking at a turn around in price soon. Growth stocks may need to find their footing and dollar may need to soften a bit but for now, this seems like a decent spot for longs. Best of luck traders..
The green line at 27.5 was where our previous trade occured for a nice little run and is linked to this post.

Uranium's Moment Uranium ETF (URA) is firing on multiple indicators today after news of House committee approving bill to ban Russian uranium imports
- MACD Cross on weekly chart
- OBV continues upwards trajectory
- Pennant forming above 200 week SMA
- 0.618 fib level is $45 (100%+ opportunity

Target on $URAThere is gap target of $111-$98 dollar this is quite the massive gap down after the Japan incident in 2011 that has not been retested this would be my short term target. However I will also be quite bullish beyond that target as a long term hold.

Uranium future projection The race to reduce carbon emissions by 2050 is on. Uranium being one of the top runner up and The biggest in capacity holding of energy holds my number one spot in this new energy transition and I will show you why below.
AMEX:URA current environment
1.Market Response to Production Shortfall
- The news of Kazatomprom potentially cutting its 2024 production plan due to sourcing issues with sulfuric acid has led to a significant reaction from the market. Shares of uranium companies have seen a sharp increase as investors anticipate a tighter supply, which could drive up uranium prices. The immediate price jump is a direct reflection of the market’s sensitivity to supply disruptions, especially from a major producer like Kazakhstan.
2. Impact on Uranium Prices:
- Uranium prices have reached their highest since the end of 2007, indicating a robust bullish sentiment in the market. This price movement aligns with the fundamental analysis where supply constraints act as a significant driver for price increases. The $97/lbs price point could serve as a new resistance level, and if prices remain above this threshold, it could signal a continued bullish trend.
3. Performance of URA and Other ETFs:
- The Global X Uranium ETF (URA) climbing by 5.3% is a strong indicator that the ETF is benefiting from the current market dynamics. The rise of URA, along with other ETFs like the Sprott Uranium Miners ETF, shows that the bullish sentiment is widespread across the sector. This positive movement in ETFs also reflects broader investor confidence in the uranium market's growth potential, amidst the current production and geopolitical concerns.
*Driver of uranium price in a macro perspective*
1. Technical Chart:
a "cup and handle," which is typically considered a bullish continuation pattern. This pattern is characterized by a gradual decline followed by a rise that mirrors the prior decline, forming a "cup," and then a smaller pullback before a breakout, forming the "handle." For URA, the pattern suggests that after a period of consolidation and pullback, there could be a potential upward breakout. The validity of this pattern would be further reinforced if it occurs with an accompanying increase in volume, which would indicate strong buying interest. Which is the case for ura on the 1 month chart
Volume: the volume on uranium has seen a significant increase which is visible on the chart. In September 29 2020 the average 30 day volume was 151,333.2 now fast forward todays day January 12, 2024 uranium is trading at an average 30 day volume of 2.85 million! Price Which is also near resistance level is just peaking above it currently looking like it wants to push higher given the significant Volume increase.
2. Fundamental Drivers:
- URA's performance is closely tied to the demand and supply dynamics of uranium. The push for clean energy and the need to reduce carbon emissions are driving countries to consider nuclear energy as a viable option. This could lead to an increased demand for uranium. Moreover, supply constraints, possibly due to geopolitical tensions in uranium-rich regions or production cuts like those potentially by Kazatomprom, can create a supply-side squeeze, leading to higher uranium prices, which would benefit URA.
3. Geopolitical Landscape
The geopolitical tensions, particularly those affecting countries like Kazakhstan which is a major uranium producer, can significantly impact uranium availability and prices. The Russia-Ukraine conflict also adds to the complexity, as it could lead to sanctions or disruptions that affect the global uranium market. Additionally, if European countries, in seeking to alleviate energy crunches, pivot more towards nuclear energy, that could further increase demand for uranium, benefiting URA in the process.
Outlook: uranium looks very bullish
BofA Global Research forecasts that spot uranium prices will reach $105 a pound this year and $115 a pound in 2025. Just how high prices can get depends in part on how quickly countries wean off Russian supplies.
Demand for uranium for nuclear plants is expected to rise to 83,840 tonnes by 2030 and 130,000 tonnes by 2040, from 65,650 this year, it said. The spot price of uranium has more than doubled over the past three years, but is well down from a peak of $140 a pound touched in 2007.
*Deeper analysis on URA*
1. Nuclear Energy's Reliability and Capacity Factor:
nuclear energy's high capacity factor, which measures the reliability of an energy source by comparing its actual output with its potential output. With a capacity factor of 92.5%, nuclear energy is presented as the most reliable energy source when compared to others like natural gas, coal, wind, and solar. This reliability is crucial for meeting base-load energy demands consistently, which is an advantage for countries aiming to reduce carbon emissions without compromising on energy availability.
2. Nuclear Energy in Carbon Emission Reduction:
- The fact that nuclear power produces zero carbon emissions during operation positions it as a clean energy source, especially important as countries race to meet emission reduction targets by 2030 and beyond. This bolsters the argument that demand for uranium, as a fuel for nuclear power plants, is likely to increase as part of global decarbonization efforts.
3. Nuclear Energy's Role in the Energy Transition:
- With the information on nuclear energy's big wins in 2023 and the goal of net-zero emissions by 2050, there is a clear indication that nuclear energy is gaining momentum. This trend can serve as a foundational driver for increased uranium demand, reinforcing the bullish outlook for uranium investments such as $URA.
